Manuscript version: Author’s Accepted Manuscript
The version presented in WRAP is the author’s accepted manuscript and may differ from the published version or Version of Record.
Persistent WRAP URL:
http://wrap.warwick.ac.uk/114400
How to cite:
Please refer to published version for the most recent bibliographic citation information. If a published version is known of, the repository item page linked to above, will contain details on accessing it.
Copyright and reuse:
The Warwick Research Archive Portal (WRAP) makes this work by researchers of the University of Warwick available open access under the following conditions.
© 2016 Elsevier. Licensed under the Creative Commons Attribution-NonCommercial-NoDerivatives 4.0 International http://creativecommons.org/licenses/by-nc-nd/4.0/.
Publisher’s statement:
Please refer to the repository item page, publisher’s statement section, for further information.
Insights into the hierarchical structure and digestion rate of alkali-modulated
1starches with different amylose contents
23
Dongling Qiao1,2,3, Long Yu1,2*, Hongsheng Liu1, Wei Zou4, Fengwei Xie5,6**, George Simon2, 4
Eustathios Petinakis3, Zhiqi Shen3, Ling Chen1 5
6
1 CPFRR, College of Food Science and Engineering, South China University of Technology, 7
Guangzhou, Guangdong 510640, China 8
2 Department of Materials Engineering, Monash University, Melbourne, Vic 3168, Australia 9
3 CSIRO, Manufacturing, Melbourne, Vic 3168, Australia 10
4 Centre for Nutrition and Food Sciences, Queensland Alliance for Agriculture and Food Innovation, 11
The University of Queensland, Brisbane, Qld 4072, Australia 12
5 Australian Institute for Bioengineering and Nanotechnology, The University of Queensland, Brisbane, 13
Qld 4072, Australia 14
6 School of Chemical Engineering, The University of Queensland, Brisbane, Qld 4072, Australia 15
16
17
* Corresponding author. Tel.: +86-20-87111971; E-mail: [email protected] (L. Yu). 18
** Corresponding author. Tel.: +61 7 3346 3199; fax: +61 7 3346 3973; Email address: [email protected]; 19
Abstract: Combined analytical techniques were used to explore the effects of alkali treatment on the 21
multi-scale structure and digestion behavior of starches with different amylose/amylopectin ratios. 22
Alkali treatment disrupted the amorphous matrix, and partial lamellae and crystallites, which weakened 23
starch molecular packing and eventually enhanced the susceptibility of starch to alkali. Stronger alkali 24
treatment (0.5% w/w) made this effect more prominent and even transformed the dual-phase digestion of 25
starch into a triple-phase pattern. Compared with high-amylose starch, regular maize starch, which 26
possesses some unique structure characteristics typically as pores and crystallite weak points, showed 27
evident changes of hierarchical structure and in digestion rate. Thus, alkali treatment has been 28
demonstrated as a simple method to modulate starch hierarchical structure and thus to realize the rational 29
development of starch-based food products with desired digestibility. 30
Keywords: Starch; Alkali treatment; In vitro digestion;Multi-scale structure; Amylose/amylopectin 31
ratio 32
Chemical compounds studied in this article: Starch (PubChem CID: 24836924); Water (PubChem 33
CID: 962); Sodium hydroxide (PubChem CID: 14798); Sodium azide (PubChem CID: 33557); Ethanol 34
(PubChem CID: 702); 4-Hydroxybenzhydrazide (PubChem CID: 1742); Maltose (PubChem CID: 35
10991489) 36
1. Introduction
38
Starch is the main storage carbohydrate in most higher plants and is one of the most important 39
energy sources for humans and animals. Starch contains two D-glucan biopolymers, i.e., amylose, a 40
relatively linear 1,4-α-D-glucan with a small number of long branches; and amylopectin, mainly a 1,4-α-41
D-glucan containing high-density branches (ca. 5% of glycosidic bonds are α-1,6) (Zhang et al., 2014a). 42
These two macromolecules are organized on different length scales in the starch granule to form the 43
supramolecular structure of starch, from the whole granule (<1 μm–100 μm), growth ring (100–400 nm), 44
semi-crystalline lamellae (9–10 nm), to crystalline structure (>0.1 nm–ca. 1 nm) (Pikus, 2005; Zhang, Li, 45
Liu, Xie & Chen, 2013). In addition, depending on the packing of amylopectin side chains into double 46
helices and amylose single helices, the crystalline structure (polymorph) of starch has been classified as 47
A-, B-, C- or V-type. All this multi-scale structure of starch depends on the botanical origin. 48
In addition, starch structure may be altered by various treatments, resulting in changes in the 49
digestibility and other properties of starch. As a main food ingredient, starch is usually processed for 50
consumption, in which case native starch in low-moisture foods (Blazek & Gilbert, 2010) (e.g., biscuits 51
and muesli), fruits, vegetables, and animal feeds can be ingested directly. Since the digestibility of starch 52
may be associated with metabolic diseases such as Type II diabetes, obesity, and cardiovascular diseases, 53
it plays a key role in determining the health benefits of starch-based foods (Zou, Sissons, Gidley, Gilbert 54
& Warren, 2015). Hence, there has been huge interest in understanding the digestion behavior (reflected 55
mainly by hydrolysis rate and digested proportion) of starch and starch-based foods, which is crucial for 56
rational development of starch-based food products with desirable digestibility. 57
The Englyst method (Englyst, Kingman & Cummings, 1992) is extensively employed to assess the 58
in vitro digestibility of starch. It characterizes the proportion of starch digested within a certain time 59
period, based on which starch can be classified into three different types, i.e., rapidly-digestible starch 60
(RDS), slowly-digestible starch (SDS), and resistant starch (RS). The digestion rate of starch is further 61
and selected completion time points (Aravind, Sissons & Fellows, 2011; Butterworth, Warren, Grassby, 63
Patel & Ellis, 2012; Edwards, Warren, Milligan, Butterworth & Ellis, 2014). Nonetheless, these methods 64
cannot allow for a rigorous, quantitative comparison between digestion rates and digested proportions, 65
and are incapable of quantifiably determining the digestion rate constant as starch digestion proceeds. To 66
offset this limitation, a novel method, termed as a logarithm of the slope (LOS) plot,(Poulsen, Ruiter, 67
Visser & Iversen, 2003) by modelling the hydrolytic process using first-order enzyme kinetic principles 68
(Goñi, Garcia-Alonso & Saura-Calixto, 1997), has been applied to acquire the hydrolysis rate of starch. 69
The LOS plot enhances the differences in starch digestion rate constant and visibly reveals the number 70
of starch digestion steps throughout the whole enzymatic hydrolysis period. This method based on the 71
LOS plot has been used to identify and quantify the digestion rates and digested proportions in purified 72
starches, homogeneous foods, and edible starch-rich plant tissues (Edwards et al., 2014). 73
For the production of starch and starch-based food products, alkali treatment has been widely used. 74
This treatment has not only been confirmed effective at isolating starches from agro-products with high 75
yields and purity, especially for starch tightly associated with protein (Correia & Beirão-da-Costa, 2012; 76
Han & Hamaker, 2002), it has also been used for preparation of diverse starch-based foods, such as 77
tortillas, yellow alkaline noodles and dumplings (Campus-Baypoli, Rosas-Burgos, Torres-Chavez, 78
Ramírez-Wong & Serna-Saldivar, 1999; Lai, Karim, Norziah & Seow, 2002). Moreover, the treatment 79
with reagents such as sodium hydroxide and sodium carbonate often imparts the foods with a 80
characteristic aroma and flavor, as well as a firm and elastic texture (Karim et al., 2008). Therefore, it is 81
necessary to understand how alkali treatment changes the structure and digestion behavior of starch. 82
Alkali treatment has been shown capable of altering the structures (morphology(Cai et al., 2014; 83
Cardoso, Putaux, Samios & da Silveira, 2007; Jiang et al., 2014; Nadiha, Fazilah, Bhat & Karim, 2010; 84
Paredes-Lópezb & Bello-Péreza, 2007; Wang & Copeland, 2012; Wang et al., 2014), short- and long-85
range orders (Cai et al., 2014; Cardoso et al., 2007; Jiang et al., 2014; Wang & Copeland, 2012), and 86
semi-crystalline lamellae (Cai et al., 2014)) and properties (e.g., swelling(Jiang et al., 2014; Paredes-87
2014; Paredes-Lópezb & Bello-Péreza, 2007; Wang et al., 2014), pasting(Han & Tyler, 2003; Karim et 89
al., 2008; Lai et al., 2002; Nadiha et al., 2010; Nor Nadiha, Fazilah, Bhat & Karim, 2010; Wang, Li, 90
Wang, Liu & Adhikari, 2012), rheological (Shiau & Yeh, 2001), and thermal properties (Cai et al., 2014; 91
Cardoso et al., 2007; Lai et al., 2002; Nadiha et al., 2010; Paredes-Lópezb & Bello-Péreza, 2007; Wang 92
& Copeland, 2012; Wang et al., 2014)) of starches of various botanical origins (e.g., corn (Paredes-93
Lópezb & Bello-Péreza, 2007; Wang et al., 2012) rice,(Cai et al., 2014; Cardoso et al., 2007), potato 94
(Nadiha et al., 2010), sago (Karim et al., 2008), and pea (Han & Tyler, 2003; Wang & Copeland, 2012)).. 95
However, the effect of alkali treatment on the digestion behavior has not been extensively studied as on 96
other properties of starch. To date, only the changes in in vitro digestibility of alkali-treated starches, 97
based on the Englyst classification method, have been investigated, which has shown that alkali 98
treatment can increase the digested proportion (Wang & Copeland, 2012; Wang et al., 2014). Yet, alkali-99
induced changes in digestion rate of starch have not been understood, in particular from a hierarchical 100
structural view. The lack of this understanding prevents us from exploring the mechanism of how alkali 101
treatment changes the digestion behavior of starch and the rational application of alkali-treated starch for 102
desired digestion patterns. 103
Although strong alkali can quickly disrupt starch structure, the degradation of starch molecules is 104
often induced (Han & Lim, 2004), due to the β-elimination of reducing semiacetal groups. Considering 105
this fact, low alkali concentrations (e.g., 0.1%, 0.2%, and 0.4%), moderate temperatures (e.g., 30 °C and 106
35 °C) and long time periods (up to 30 days) (Cai et al., 2014; Jiang et al., 2014; Nadiha et al., 2010; 107
Praznik, Buksa, Ziobro, Gambuś & Nowotna, 2012; Wang & Copeland, 2012) have been widely used 108
for a slow disruption of starch supramolecular structure without molecular degradation. This study is 109
mainly focused on how the starch supramolecular hierarchical structure and alkali treatment affect the 110
digestion behavior of starch. Thus, moderate alkali treatment for long periods should be used in the 111
present work, although further investigations are still needed to reduce the treatment time and thus to 112
better meet practical requirements 113
amylose content has a prominent influence on starch hierarchical structure. In particular, while regular 115
starches (with 10–30% amylose content) normally contain a large amount of A-type crystallites, high-116
amylose starches (with >50% amylose content) usually exhibit a B-type polymorph with lower 117
crystallinity and are less susceptible to various physicochemical treatments such as acid hydrolysis and 118
hydrothermal treatment (Kim & Huber, 2010; Zhang et al., 2014a). Thus, starches with different 119
amylose contents can be ideal models to probe the alkali treatment-digestion mechanism. Regarding this, 120
the current work involved the use of regular and high-amylose maize starches to study the effect of mild 121
alkali on the lamellar and crystalline structures of starch as well as thermal and digestion behaviors 122
(especially digestion rate). This resulted in ultimate understanding of the chemistry/structure-123
digestibility relationship for alkali-treated starch. More importantly, the understanding from this work 124
could be helpful in developing starch-based products with tailored digestibility using alkali and more 125
similar chemical treatments. 126
2. Materials and Methods
127
Materials 128
Regular maize starch (RMS) and high-amylose maize starch (Gelose 50 or G50) were purchased 129
from Penford Australia Pty Ltd. (Lane Cove, NSW, Australia). RMS and G50 have 130
amylose/amylopectin ratios of 23/77 and 50/50, respectively, as measured using the iodine colorimetric 131
method (Tan, Flanagan, Halley, Whittaker & Gidley, 2007). The moisture content of each starch sample 132
was determined using a MA35 moisture analyzer (Sartorius Stedim Biotech GmbH, Germany). Sodium 133
hydroxide, sodium azide, and ethanol, purchased from Tianjin Kemeou Chemical Reagent Co., Ltd. 134
(China), were of analytical grade. α-Amylase from porcine pancreas (A-3176; 23 unit amylase/mg solid, 135
one unit liberates 1.0 mg of maltose from starch in 3 min at pH 6.9 at 37 °C), phosphate buffered saline 136
tablet (P4417-100TAB), 4-hydroxybenzhydrazide (PAHBAH, H9882) and maltose (M-9171) were 137
Preparation of alkali-treated starch 139
About 10.0 g of starch was added into 150 mL sodium hydroxide aqueous solution at a concentration 140
of 0.1% (w/v) or 0.5% (w/v) with 0.1% (w/v) sodium azide as a chemical preservative. The starch 141
slurries were kept at 35 °C for 6 or 12 days with intermittent shaking twice a day for several minutes to 142
fully re-suspend the starch. After the treatment, the starch sediment was washed with 95% ethanol 143
(Jiang et al., 2014; Wang & Copeland, 2012) and centrifuged for 3–5 times until the slurry became 144
neutral. Then, the starch sediment was dried in an oven at 35 °C for 48 h. In the following discussion, 145
the samples are coded in the format of “RMS-0.5%-12”, where “RMS” denotes the type of starch, “0.5%” 146
indicates the concentration of sodium hydroxide, and “12” means the days for treatment. 147
Synchrotron small-angle X-ray scattering (SAXS) 148
SAXS measurements were performed on the SAXS/WAXS beamline (flux, 1013 photons/s) at the 149
Australian Synchrotron (Clayton, Vic, Australia), at a wavelength λ = 1.47 Å. A Pilatus 1M camera 150
(active area 169 × 179 mm; and pixel size 172 × 172 μm) was used to record the 2D scattering patterns. 151
The one-dimensional (1D) data were obtained from the 2D scattering patterns using the scatterBrain 152
software, and the data in the angular range of 0.0015 < q < 0.15 Å−1 were used as the SAXS pattern, 153
where q = 4πsinθ/λ (where 2θ is the scattering angle and λ the X-ray wavelength). All the data were 154
background subtracted and normalized. Starch slurries with a starch concentration of 40 wt% were 155
prepared by adding a desired amount of water to the starch samples. The starch suspensions were placed 156
on a multi-well stage provided by the Australian Synchrotron, and then the SAXS data were recorded for 157
an acquisition time of 1 s. The scattering of pure water with a Kapton tape (5413 AMBER 3/4IN X 158
36YD, 3M, USA) on the stage window was used as the background data. 159
X-ray diffraction (XRD) 160
Before the measurements, the unmodified and alkali-treated starch samples were kept in an oven at 161
35 °C for 12 h. The starch samples displayed similar moisture content of approx. 11%. The crystalline 162
structure of starch samples was evaluated using a powder X-ray diffractometer (D8 Advance, Bruker 163
scintillation counter detector. The radiation parameters were 40 kV and 30 mA, with a slit of 2 mm. 165
XRD patterns were acquired for a 2θ range of 4–40°, with a step size of 0.02° and a step rate of 0.5 s per 166
step. The relative crystallinity (Xc, %) for the starch samples was calculated using the PeakFit software 167
(Ver. 4.12), according to Eq. (1): 168
𝑋𝑐 = ∑𝑛𝑖=1𝐴𝑐𝑖
𝐴𝑡 (1)
169
in which, Aci is the area under each crystalline peak with index i, and At is the total area of the diffraction 170
pattern. 171
Differential scanning calorimetry (DSC) 172
The thermal behaviors of native and alkali-treated starches were measured using a PerkinElmer DSC 173
8500 with nitrogen purge gas (Liu, Yu, Xie & Chen, 2006; Zhang et al., 2013). A high-pressure stainless 174
steel pan with a gold-plated copper seal was used to run the tests. The starch samples with 70% moisture 175
content were prepared by premixing the starches with distilled water in sealed glass vials, which were 176
then kept at 26 °C for 12 h before the measurement to achieve homogeneous samples. The samples (ca. 177
12-15 mg) were heated from 30 °C to 120 °C at a heating rate of 10 K/min. The gelatinization onset 178
temperature (To) and enthalpy (ΔH) for the starch samples were recorded. All results were reported as 179
averages of three replicates. 180
In vitro digestion 181
In vitro digestion of starch was carried out in duplicate. A centrifuge tube with 90.0 mg of dried 182
starch and 16.0 mL of deionized water was incubated at 37 °C. Then, 5.0 mL of phosphate buffer 183
solution (PBS; one phosphate buffered saline tablet dissolved in 200 mL of deionized water yields 0.01 184
M phosphate buffer, 0.0027 M potassium chloride and 0.137 M sodium chloride, pH 7.4, at 25°C) with 185
9.0 mg of porcine α-amylase was pipetted into the tube. Afterwards, 100.0 μL of the digestion solution 186
was collected at each time point and transferred into a prepared centrifuge tube containing 900.0 μL of 187
0.3 mol/L Na2CO3 solution to terminate enzymatic digestion. The 1.0 mL of mixed solution was then 188
solution (prepared by dissolving 500.0 mg of PAHBAH powder into 10.0 mL of 0.5 M HCl, followed by 190
addition of 90.0 mL of 0.5 M NaOH). The resulting solution was incubated in boiling water for 5 min. 191
After cooling to ambient temperature, the absorbance at 410 nm (McDougall et al., 2005; Nwosu et al., 192
2011) was recorded by using a UV-1700 spectrophotometer (Shimadzu Corp., Kyoto, Japan). Maltose 193
solution (1.0 mol/L) was referenced for quantifying starch digested. The percentages of the starch 194
digested were calculated according to Eq.(2): 195
SD(%) = 𝐴𝑠𝑎𝑚𝑝𝑙𝑒 ×
100𝜇𝐿×1.0𝑚𝑔/𝐿
𝐴𝑚𝑎𝑙𝑡𝑜𝑠𝑒 × 10 × 210 × 100% 90𝑚𝑔×
324
342 (2)
196
In this equation, SD is the percentage of starch digested, and Asample and Amaltose are the absorbances for 197
starch digestion solution and maltose standard, respectively. The value of 10 × 210 is the computational 198
multiple from 100.0 μL aliquots to 21.0 mL reaction solution, and 324/342 is the transformation 199
coefficient from maltose to starch in weight. 200
First-order kinetics 201
Except the commonly-used first-order kinetic model (Eq.(3)), the accompanying logarithm of the 202
slop (LOS) plot (Eq.(4)) was adopted to fit the digestion data to describe the sequential first-order 203
kinetics of starch digestion (Zou et al., 2015). 204
𝐶𝑡= 𝐶∞(1 − 𝑒−𝑘∙𝑡) (3)
205
ln𝑑𝐶𝑡
𝑑𝑡 = −𝑘 ∙ 𝑡 + ln(𝐶∞∙ 𝑘) (4)
206
where Ct (%) is the amount of starch digested at a given time (t (min)), C∞ (%)is the estimated
207
percentage of starch digested at the end point of a digestion stage, and k (min−1) is the coefficient of 208
starch digestion rate. The calculated digestion data (ln[(Ci+2 − Ci)/(ti+2 − ti)]) at each time point ((ti+2+ti)
209
/2), except the last two points, was used to obtain the LOS pattern and the related fit curve. 210
The LOS plot visibly reveals the number of starch digestion steps throughout the whole reaction 211
period according to the changes in the slope of digestion pattern (ln(dCt/dt)) versus the time (t). 212
Therefore, using the LOS plot derived from digestion data, the different digestion stages with different 213
digestion rate coefficients (k) could be shown. The obtained k and C∞were employed to plot the starch
digestion curve according to Eq.(3) to compare the original data with the fit starch digestion curves 215
generated by the fit model. 216
Statistical analysis 217
Datawere expressed as means ± standard deviations (SD). Starch digestion rate constants were 218
analyzed by one-way ANOVA and multiple comparison test with least significant difference using IBM 219
SPSS software version 20.0 (Chicago, IL, USA). A statistical difference of P 0.05 was considered to 220
be significant. Linear regression fitting and regression analysis were carried out in Microsoft Excel 2010 221
(Redmond, WA, USA). 222
3. Results and Discussion
223
3.1Lamellar structure 224
Fig. 1 shows the double logarithm SAXS patterns of native and alkali-treated starches in the range of 225
0.015 Å −1q 0.15 Å−1. All starch samples displayed a scattering peak at ca. 0.06 Å−1, corresponding 226
to the average repeat distance of semi-crystalline lamellae (crystalline-amorphous lamellae) of starch 227
(Zhang et al., 2015). Normally, semi-crystalline lamellae with a high degree of ordering and without 228
flawless can generate a scattering peak with fine visibility (Zhang et al., 2014b). As revealed by the 229
SAXS patterns in Fig. 1, alkali treatment reduced the visibility of the lamellar peak at ca. 0.06 Å−1, 230
indicating an increased amount of flawed semi-crystalline lamellae with a lower ordering degree. That is, 231
for both RMS and G50, alkali treatment disrupted semi-crystalline lamellae to a certain degree and 232
decreased the organization of lamellae. 233
234
236
Fig.1 SAXS patterns for native and alkali-treated RMS and G50. 237
238
239
Apart from the reduced visibility of lamellar peak, the scattering intensity at low q values was also 240
raised by alkali treatment (see Fig. 1), which could be attributed to the changes in the lamellar regions 241
and the background materials on the nano scale (Zhang et al., 2013). According to the paracrystalline 242
model (Cameron & Donald, 1992, 1993a, b), two parameters on semi-crystalline lamellae could be 243
acquired, i.e., the electron density difference between crystalline and amorphous lamellae Δρ = ρc–ρa 244
(where ρc and ρa are the electron densities of crystalline lamellae and amorphous lamellae in semi-245
crystalline lamellae, respectively) and the electron density difference between the amorphous 246
background and amorphous lamellae Δρu = ρu–ρa (where ρu is the electron density of the amorphous 247
background (amorphous growth rings)). While the major effect of increasing Δρ is to increase the 248
overall intensity, the increase in Δρu has the concurrent effects of raising the low-angle intensity and 249
lowering the definition of the peak without changing the peak position (Cameron & Donald, 1992). 250
From Fig. 1, compared to the native counterparts, increases in the overall scattering intensity and in the 251
low-angle intensity and a decrease in the peak definition were observed for alkali-treated RMS and G50, 252
and this phenomenon became more apparent especially as the alkali concentration (not treatment time) 253
increased. This indicates that alkali treatment increased both Δρ and Δρu, resulting from a greater 254
destruction to amorphous lamellae, and relatively lower destruction to the amorphous background and 255
0.04 0.08 0.12
103 104
105
q (A-1)
In te n sit y ( a .u .) RMS RMS-0.1%-6 RMS-0.1%-12 RMS-0.5%-6 RMS-0.5%-12 A
0.04 0.08 0.12
103
104
q (A-1)
crystalline lamellae. Nonetheless, previous reports confirmed that alkali treatment could reduce not only 256
the value of Δρu for Araucaria angustifolia starch (Thys et al., 2008) but also the value of Δρ for indica 257
and high-amylose rice starches (Cai et al., 2014). 258
To further illustrate the alterations of semi-crystalline lamellae induced by alkali treatment, the 259
average thicknesses of semi-crystalline (d), crystalline (dc) and amorphous (da) lamellae were obtained 260
using the linear correlation function f(r) (Zhang et al., 2015), as shown in Eq. (5): 261
f(r) =∫ 𝐼(𝑞)𝑞
2cos(𝑞𝑟)𝑑𝑞 ∞
0
∫ 𝐼(𝑞)𝑞∞ 2𝑑𝑞 0
(5) 262
In this equation, r(nm) is the distance in real space, and d is the second maximum of f(r) (the repeat 263
distance, i.e., the thickness of semi-crystalline lamellae). da, representing the average thickness of 264
amorphous lamellae within semi-crystalline lamellae, can be acquired by the solution of the linear region 265
and the flat f(r) minimum. Thus, dc, the average thickness of crystalline lamellae within the semi-266
crystalline lamellae, is calculated by dc= d–da. 267
The calculated lamellar parameters are summarized in Table 1. The thickness of semi-crystalline 268
lamellae kept constant for RMS after the 0.1% concentration alkali treatment, whereas for G50 this 269
thickness slightly increased but no further changes with time was observed. Nonetheless, the high 270
concentration (0.5%) alkali solution resulted in a similar increase in the thickness of semi-crystalline for 271
both RMS and G50. Hence, unlike previous findings (Cai et al., 2014; Thys et al., 2008) that alkali 272
treatment makes semi-crystalline lamellae thinner for C-polymorphic Araucaria angustifolia starch (a 273
hybrid of A- and B-polymorphs) but does not alter the thickness of semi-crystalline lamellae for A- and 274
C-polymorphic rice starches, the results here demonstrated that alkali tended to increase the semi-275
crystalline lamellar thickness for maize starches with a single A- or B-polymorph. 276
277
278
Table 1. Lamellar, crystalline and thermal parameters of native and alkali treated starches a 279
starch 6 days 12 days 6 days 12 days
RMS d (nm) 9.35±0.00 9.35±0.00 9.35±0.00 9.55±0.00 9.57±0.01
da (nm) 2.65±0.01 2.64±0.00 2.64±0.01 2.60±0.01 2.58±0.01
dc (nm) 6.70±0.01 6.71±0.00 6.71±0.01 6.95±0.01 6.99±0.02
Xc (%) 39.80 38.54 37.11 36.57 36.34
△H (J/g) 14.67±0.15 14.47±0.32 14.07±0.27 8.33±0.32 8.27±0.47
To (°C) 68.37±0.28 70.11±0.16 69.32±0.34 77.12±0.28 77.20±0.39
G50 d (nm) 9.40±0.00 9.47±0.00 9.47±0.01 9.62±0.00 9.62±0.01
da (nm) 2.57±0.01 2.58±0.01 2.58±0.01 2.65±0.01 2.65±0.01
dc (nm) 6.83±0.01 6.89±0.01 6.89±0.02 6.97±0.01 6.97±0.02
Xc (%) 32.68 32.41 31.05 31.22 31.16
ΔH (J/g) 6.88±0.47 6.22±0.38 6.86±0.39 5.52±0.25 4.96±0.39
To (°C) 73.94±0.20 73.70±0.12 73.64±0.38 78.93±0.30 79.18±0.01
a Parameters measured by SAXS: d, average thickness of semi-crystalline lamellae; d
c, average thickness of 280
crystalline lamellae; da, average thickness of amorphous lamellae. Parameter obtained by XRD: Xc, relative degree 281
of crystallinity. Parameters of endotherm G measured by DSC: ΔH, enthalpy; To, onsite temperature. 282
283
284
For clarifying how the thickness of semi-crystalline lamellae was increased by alkali, the evolution 285
for the thicknesses of crystalline and amorphous lamellae was also examined. From the dc and da results 286
in Table 1, it is seen that after the alkali treatment (especially 0.5%), an increase in the thickness of 287
crystalline lamellae and a decrease in the thickness of amorphous lamellae could be observed for RMS, 288
whereas for G50 the treatment (in particular 0.5%) increased the thicknesses of both crystalline and 289
amorphous lamellae. This suggested that alkali treatment could make semi-crystalline lamellae (d) 290
thicker by increasing the thickness of crystalline lamellae (dc) rather than that of amorphous lamellae (da)
291
for RMS, and by simultaneously increasing both the thicknesses of crystalline (dc) and amorphous (da)
292
lamellae for G50. Accounting for this, alkali ions penetrated into the starch granule interior to partially 293
break the hydrogen bonding network of starch crystallites, leading to movement of double helices in 294
crystalline lamellae and thus an increase in semi-crystalline lamellae. In addition, it is noted that alkali 295
amorphous lamellar thickness, whereas for G50 the treatment tended to increase the thickness of 297
amorphous lamellae, presumably due to alkali-induced swelling in amorphous lamellae (rather than the 298
predominantly out-phasing of starch molecules) or disorganization of partial crystalline lamellae (i.e., 299
transformation of crystalline lamellae into amorphous lamellae). This was again different from the case 300
for Araucaria angustifolia starch (Thys et al., 2008) which showed alkali decreased the thickness of 301
amorphous lamellae but did not apparently change that of crystalline lamellae. 302
3.2Crystalline structure 303
Since the starch granule is a semi-crystalline system comprised of crystalline and amorphous regions, 304
the XRD pattern of starch shows sharp peaks for the crystalline regions and a diffuse pattern for the 305
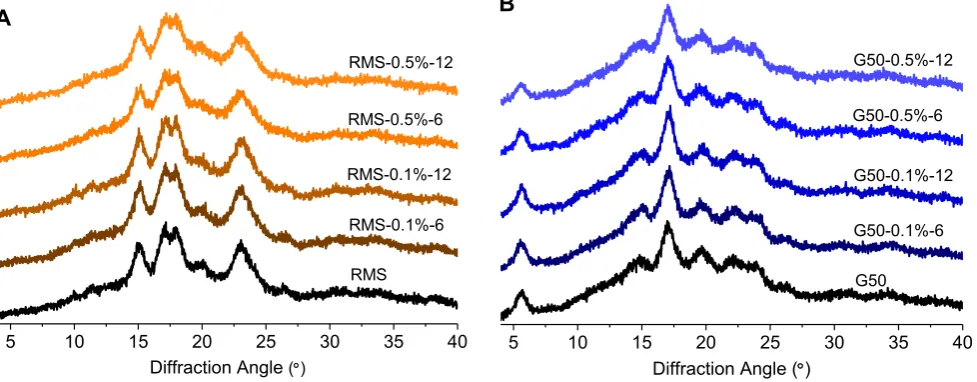
amorphous components. Fig. 2 shows the XRD patterns of RMS and G50 before and after alkali 306
treatment. While RMS displayed a typical A-type polymorph with intense diffraction peaks at ca. 15° 307
and 23° (2θ), and an unresolved doublet at ca. 17° and 18°; G50 exhibited a typical B-type polymorph 308
with the strongest diffraction peak at around 17°, several smaller peaks at ca. 15°, 20°, 22° and 24°, and 309
a characteristic peak at ca. 5.6°. For both starches, alkali treatment (with increased alkali concentration 310
and treatment time) resulted in no change to the original polymorphic type, which was in agreement with 311
previous findings (Cai et al., 2014; Cardoso et al., 2007; Jiang et al., 2014; Wang & Copeland, 2012). 312
313
315
Fig. 2 XRD patterns for native and alkali-treated RMS and G50. 316
317
318
The relative degree of crystallinity (Xc) was calculated from the ratio of the total diffraction peak 319
area to the total area of diffraction pattern, and the results are recorded in Table 1. Expectedly, RMS 320
showed higher Xc than did G50. With a higher amylopectin content in RMS, amylopectin side chains 321
formed double-helices (the short-range-scale order) and contributed to an increase in the quantity of 322
starch crystallites (the long-range-scale order) (Manners, 1989; Tan et al., 2007). With alkali treatment, 323
the crystallites were reduced. A greater decrease in Xc was observed for RMS, especially when a higher 324
alkali concentration was used, suggesting that RMS crystallites were more susceptible to alkali treatment. 325
Crystallinity reduction is normally observed for alkali treated starch (Cardoso et al., 2007; Thys et al., 326
2008; Wang & Copeland, 2012), though alkali probably increase the quantity of crystallites through 327
preferentially attacking the amorphous region rather than the crystalline regions (Jiang et al., 2014). 328
The polymorphic components (crystallites) of starch at the long-range scale are predominantly 329
comprised of monoclinic and/or hexagonal crystal units which are constituted by short-range double-330
helices and inter-helical water molecules. Those double-helices and water molecules are organized 331
together through a huge amount of inter- and intra-molecular hydrogen bonds (Perez & Bertoft, 2010). 332
Hence, the reduction of starch crystallites during alkali treatment was considered due to the breakage of 333
5 10 15 20 25 30 35 40
Diffraction Angle ()
RMS RMS-0.1%-6 RMS-0.1%-12 RMS-0.5%-6 RMS-0.5%-12 A
5 10 15 20 25 30 35 40
Diffraction Angle ()
[image:16.612.65.554.42.233.2]hydrogen bonds at the molecular level. 334
A previous study (Thys et al., 2008) has shown that for a C-polymorphic starch (Araucaria 335
angustifolia), the B-type crystallites in the center of starch granule have greater susceptibility to alkali 336
than do the more superficial A-type crystallites, due to the large quantity of water on the crystalline 337
packing. Also, the crystallites of B-polymorphic starch (D. persimilis) are disrupted by alkali firstly with 338
cavity formation, accompanied by the destruction of amorphous components in the latter stage, while for 339
an A-type starch (D. zingiberensis) the crystallites are gradually degraded in the whole process as the 340
compact structure and bulk crystalline lamellae form a protective layer around (Jiang et al., 2014). In 341
this current work, however, with alkali treatment especially at high concentration (0.5%), RMS 342
experienced a more pronounced increase in the average thickness of crystalline lamellae consisting of A-343
type double-helices. In other words, the alkali was more powerful at degrading the A-type crystallites of 344
RMS than the B-type polymorph of G50. This information on how alkali reduces starch crystallinity is 345
important in the following discussion about in vitro digestion. 346
3.3Thermal behaviors 347
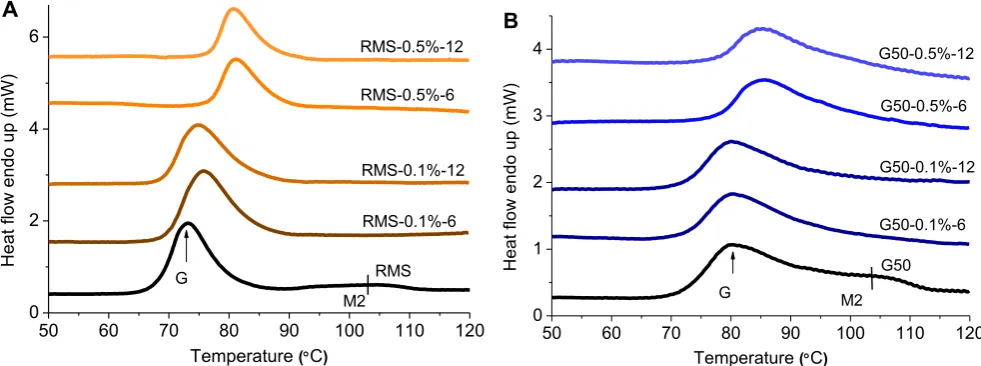
Fig. 3 presents the DSC thermograms of RMS and G50 before and after alkali treatment, and the 348
related thermal parameters are summarized in Table 1. For native RMS and G50, two endotherms, 349
termed as G and M2, were observed, attributed to the melting of amylopectin orders (crystallites and 350
double-helices) and amylose-lipid complexes, respectively (Cooke & Gidley, 1992; Liu et al., 2006; 351
Russell, 1987). Consistent with our previous report (Liu et al., 2006), G50 showed a lower enthalpy (ΔH) 352
and a higher onset temperature (To) of the endotherm G than did RMS. This is presumably due to the 353
fact that compared to G50, RMS contained inferior A-type crystallites with “weak points” resulting from 354
short double helices and branch points clustered in the crystalline region (Jane, Wong & McPherson, 355
1997), which led to weaker thermal resistance of RMS amylopectin orders (i.e., a lower To of the 356
endotherm G). 357
With alkali treatment, the endotherm M2 for both starches became less apparent, as the alkali 358
which was similar to the trend of changes in crystallinity (Xc) (Table 1). Besides, an increase in G
360
thermal transition temperature was observed for both RMS and G50, with RMS experiencing a more 361
prominent increase in To. This effect was evidently enhanced by increasing the alkali concentration 362
(rather than the treatment time). Along with the XRD results, the DSC results here revealed that 363
although some starch crystallites were disorganized by alkali, leading to reduced Xc, the rearrangement 364
of starch molecular chains occurred to allow the formation of new starch molecular orders (amylopectin 365
crystallites and double-helices) with increased thermal stability (demonstrated by the increased thermal 366
transition temperature). This was similar to the changes in crystallinity and thermal parameters of starch 367
as induced by heat-moisture treatment (Hoover, 2010; Zhang et al., 2014b). As the alkali was more 368
effective at changing the structural characteristics of RMS, the thermal stability of RMS orders showed a 369
greater increase, caused by enhanced rearrangement of starch molecules. 370
371
372
373
Fig. 3 DSC thermograms for native and alkali-treated RMS and G50. 374
375
376
3.4Digestion rate of untreated starch 377
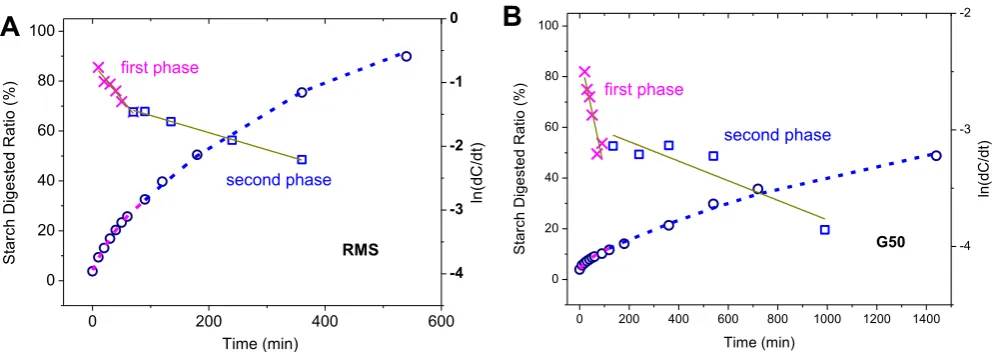
The typical digestion curves and LOS plots, along with their fit curves, for native RMS and G50 are 378
50 60 70 80 90 100 110 120
0 2 4 6 H e a t fl o w e n d o u p ( m W)
Temperature (C)
G M2 RMS RMS-0.1%-6 RMS-0.1%-12 RMS-0.5%-6 RMS-0.5%-12 A
50 60 70 80 90 100 110 120
0 1 2 3 4 H e a t fl o w e n d o u p ( m W)
Temperature (C)
[image:18.612.57.548.397.580.2]shown in Fig. 4; and Table 2 presents the related parameters of starch digestion. The LOS plots 379
consisted of two linear ranges, identified by different rate constants (k1 and k2). This suggested that both 380
starches experienced digestion in dual phases, with the first phase having a higher digestion rate than the 381
second one (k1 > k2). For RMS, k2 was just ca. ¼ of k1; and for G50, k2 was 1/13 of k1 (Table 2). 382
383
384
[image:19.612.55.554.200.376.2]385
Fig. 4 Typical digestion curves, LOS plots and fit curves for native RMS and G50. ○, Experiment data; 386
× and □, LOS plot data in first and second phases, respectively; , linear fit curve for LOS plot data; 387
and , fit curve based on the slope and intercept values of the linear fit curve for LOS plot in 388
first and second phases, respectively. 389
390
391
The dual-phase digestion for both starches could result from the heterogeneity of starch granules, in 392
particular the semi-crystalline nature. As reported before (Gallant, Bouchet, Buléon & Pérez, 1992; 393
Lopez-Rubio, Htoon & Gilbert, 2007), amorphous starch is more easily hydrolyzed by an enzyme due to 394
the relatively loose packing of starch molecules, whereas starch molecules in long- and short-range 395
orders are less accessible to the enzyme (digestible at a rather lower rate or even indigestible) unless 396
they are disorganized. Here, it is proposed that in the first phase the digestion mainly occurred to 397
amorphous starch at a higher digestion rate, although the present work did not show any difference in 398
0 200 400 600
0 20 40 60 80 100
A
Time (min) S ta rc h D ig e ste d R a tio ( % ) RMS first phase second phase -4 -3 -2 -1 0 ln (d C /d t)the digestion rate between non-lamellar amorphous starch and lamellar amorphous starch. 399
400
[image:20.612.53.562.143.525.2]401
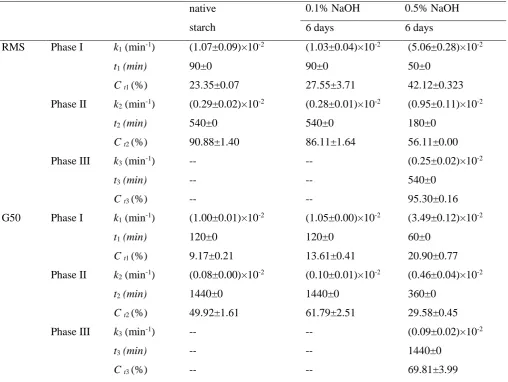
Table 2. Digestion parameters of native and alkali-treated starches a
402
native
starch
0.1% NaOH 0.5% NaOH
6 days 6 days
RMS Phase I k1 (min-1) (1.07±0.09)×10-2 (1.03±0.04)×10-2 (5.06±0.28)×10-2
t1 (min) 90±0 90±0 50±0
C t1(%) 23.35±0.07 27.55±3.71 42.12±0.323
Phase II k2 (min-1) (0.29±0.02)×10-2 (0.28±0.01)×10-2 (0.95±0.11)×10-2
t2 (min) 540±0 540±0 180±0
C t2(%) 90.88±1.40 86.11±1.64 56.11±0.00
Phase III k3 (min-1) -- -- (0.25±0.02)×10-2
t3 (min) -- -- 540±0
C t3(%) -- -- 95.30±0.16
G50 Phase I k1 (min-1) (1.00±0.01)×10-2 (1.05±0.00)×10-2 (3.49±0.12)×10-2
t1 (min) 120±0 120±0 60±0
C t1(%) 9.17±0.21 13.61±0.41 20.90±0.77
Phase II k2 (min-1) (0.08±0.00)×10-2 (0.10±0.01)×10-2 (0.46±0.04)×10-2
t2 (min) 1440±0 1440±0 360±0
C t2(%) 49.92±1.61 61.79±2.51 29.58±0.45
Phase III k3 (min-1) -- -- (0.09±0.02)×10-2
t3 (min) -- -- 1440±0
C t3(%) -- -- 69.81±3.99
ak
1, k2 and k3 are the rate constants for the first, second and third phases of digestion, respectively; t1, t2 and t3 are 403
the times required for the first, second and third phases of digestion, respectively; Ct1, Ct2 and Ct3 are the digested 404
proportion of starch in the first, second and third phases of digestion, respectively.
405
406
407
While G50 and RMS had similar hydrolysis rates in the first phase (k1), the latter had a greater 408
proportion of starch digested (Ct1). As shown in Table 2, Ct1 was 23.35% for RMS and 9.17% for G50. 409
similar k1 (unpublished data). This means the fraction of starch that could be rapidly digested in the first 411
phase was not only linked to the crystallinity, but also to other structural features as influenced by the 412
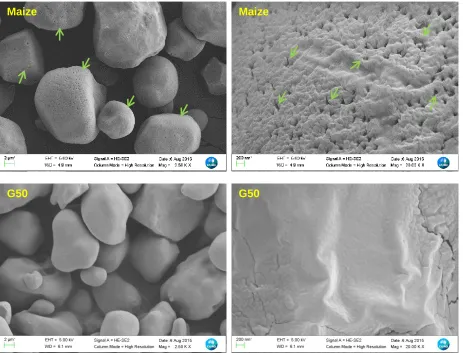
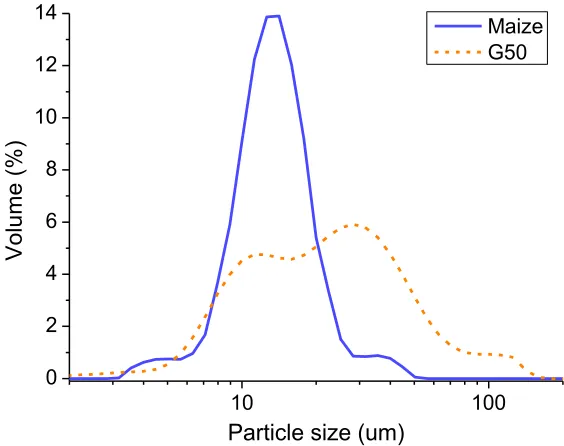
amylose content. RMS was observed to have a large number of pores which could connect the granule 413
surface to the interior (hilum), whereas G50 is known to have a compact granule structure without such 414
pores (Chen et al., 2009) (see SEM images in Fig. S1). As the pores allowed the penetration of α-415
amylase molecules (with a size of ca. 6 nm) (Payan et al., 1980) into the interior of the granules, RMS 416
could be digested centrifugally through an “inside-out” manner; in contrast, for G50, the absence of 417
pores hindered the penetration of enzyme into the granules, resulting in a “centripetal” (from surface to 418
core) digestion pattern (Dhital, Butardo, Jobling & Gidley, 2015; Zhang, Ao & Hamaker, 2006). 419
Consequently, RMS had a large fraction of loosely-packed starch molecules in the hilum, close to the 420
pores, and in the granule surface, which were all highly susceptible to the enzyme (and easily leached 421
out from the starch granule) and could be rapidly hydrolyzed at a high rate (k1). For G50, the enzyme 422
could only rapidly digest some starch molecules in the granule surface and the leached molecules 423
although at a similar high rate (k1). In other words, while both RMS and G50 showed similar rates in the 424
first digestion phase, the former had a higher digested proportion of starch (Ct1) at the end of this first 425
phase. 426
In the second digestion phase, the enzyme gradually hydrolyzed the digestible matrix of remainder 427
starch. At the end of the second phase, 90.88% (Ct2) of RMS and 49.92% (Ct2) of G50 were hydrolyzed. 428
Since the amorphous content in RMS was 60.02% (Table 1), it is proposed that in the second phase, not 429
only could the amorphous matrix in RMS be sufficiently digested by the enzyme, also part of A-type 430
crystallites were hydrolyzed. Nevertheless, as G50 had an amorphous content of 67.32% (Table 1), only 431
part of this amorphous starch was hydrolyzed by the enzyme. It is worth mentioning that the reduction 432
of enzyme concentration and the deactivation of enzyme were unavoidable as starch digestion proceeds. 433
Since our work mainly focused on the effects of starch inherent structure and alkali treatment on the 434
digestion behavior of RMS and G50, those enzyme related factors would not be discussed in the 435
Besides, RMS had much higher k2 than G50 (ca. 2.5 times higher), suggesting that the remainder 437
amorphous matrix of RMS after the first digestion phase could be digested more easily than that of G50. 438
It was possible that for RMS the enzymatic hydrolysis in the first phase made the feature of pores more 439
apparent and promoted the starch-enzyme interactions. Besides, compared with G50, RMS with A-type 440
polymorph possesses shorter amylopectin side chains and a larger proportion of short chains (Hizukuri, 441
1985). While B- polymorphic G50 contains branch points mostly clustered in the amorphous regions, A-442
polymorphic RMS has branch points scattered in both amorphous and crystalline regions. The shorter 443
double helices derived from the shorter side chains and the branch linkages presented in the crystalline 444
region lead to the “weak points” (i.e., flaws) in crystalline regions of RMS (Jane et al., 1997). For these 445
reasons, the enzyme digested most parts of the remainder RMS much more quickly and even degraded 446
part of the A-type crystallites in the second digestion phase. In addition, the Ct2 results revealed that G50 447
contained more resistant starch than did RMS, which was consistent with previous research (Shrestha et 448
al., 2012), as the existence of pores and crystallite “weak points” enhanced the accessibility of starch 449
molecules to the amylase (i.e., reduced enzymatic resistance for RMS). 450
3.5Digestion rate of alkali-treated starch 451
The above discussions have shown that compared to the increased treatment time, the increased 452
alkali concentration was more effective at changing the multi-scale structure and thermal behavior of 453
starch. Thus, the starches treated by the alkali solutions of both concentrations for 6 days were selected 454
to further understand the effect of alkali on starch digestion rate. Fig. 5 shows the typical digestion 455
curves, LOS plots and fit curves for alkali-treated RMS and G50; and Table 2 records the related 456
parameters of digestion. Note that the residuals deduced from the fit data and digestion data (see Fig. S3) 457
were in the range of -2~2, indicating that LOS model was capable of describing the starch digestion 458
process accurately. 459
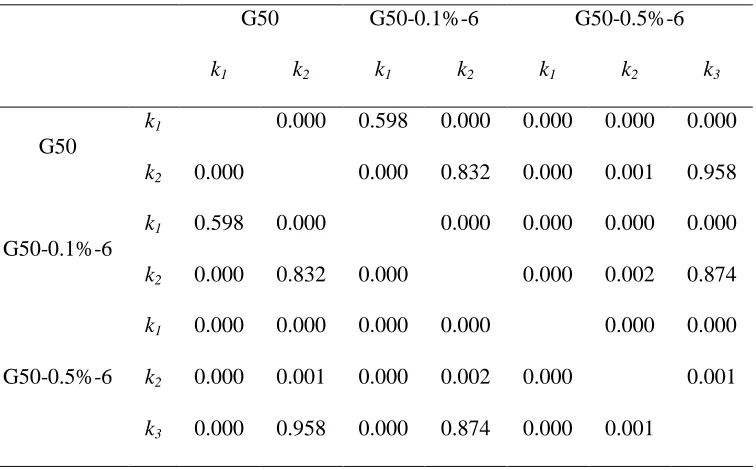
With alkali treatment at the low concentration (0.1%), the LOS plots retained two linear ranges 460
(dual-phase digestion) for both starches. In the first phase, both alkali-treated RMS and G50 were 461
counterparts. It was possible that some parts in native starch with a lower digestion rate (k2) were 463
transformed into materials with a higher digestion rate (k1). The increases in Ct1 were similar for two 464
starches, but still alkali-treated RMS had higher Ct1 than alkali-treated G50. In the second phase, both 465
alkali-treated starches showed unchanged k2 from those for their native counterparts. 466
Interestingly, when the alkali concentration was increased to 0.5%, a digestion course with three 467
different rates (with k1 > k2 > k3, see Fig. 5 and Table 2) was employed to fit the digestion data instead of 468
dual-phase one (see Fig. S4), indicating that the treatment with high alkali concentration gave rise to a 469
triple-phase digestion pattern. Both RMS and G50 after the 0.5% alkali treatment showed higher k1 and 470
Ct1 than those with the 0.1% alkali treatment, suggesting enhanced digestibility. In addition, in all three 471
digestion phases, the high-concentration alkali-treated RMS showed higher digestion rates (k1,k2, and k3) 472
and higher digested proportions (Ct1, Ct2 and Ct3) than G50 treated under the same condition. In the 473
intermediate phase, 14% (Ct2 − Ct1) of starch was digested for RMS and 9% (Ct2 − Ct1) for G50. 474
Similar to the enzymatic hydrolysis procedure of starch, the treatment by alkali solution of starch 475
granules could act in several steps, including the penetration of alkali into the granules, the alkali-476
induced disorganization in the multi-scale structure, and the out-phasing of starch molecules (especially 477
with low molecular weight) from the granules. The efficiency of alkali treatment at weakening starch 478
packing could be influenced by the porosity of starch granules. With pores in RMS granules, the alkali 479
solution could not only easily penetrate into the granules, inducing breakage of hydrogen bonding in the 480
hierarchical structure, but also enhance the leaching of starch molecules from the granule interior. For 481
G50, alkali treatment could only act through a “washing” procedure from the superficial regions of 482
granules, although the alkali solution might gradually diffuse into the granules at a rather slow rate. Thus, 483
“centrifugal” and “centripetal” alkali treatment manners existed for RMS and G50, respectively. Also, 484
RMS had the less-perfect A-type polymorph containing “weak point” (Jane et al., 1997) which was more 485
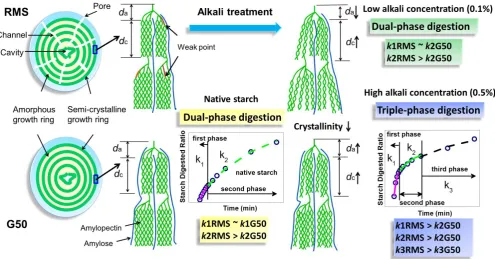
susceptible to alkali treatment (see Fig. 6). 486
487
489
490
Fig. 5 Typical digestion curves, LOS plots and fit curves for alkali-treated RMS and G50. ○, Experiment 491
data; ×, □ and ☆, LOS plot data in first, second and third phases, respectively; , linear fit curve for 492
LOS plot data; , or, , fit curve based on the slope and intercept values of the linear fit curve 493
for LOS plot in first, second and third phases, respectively. 494
495
496
Consequently, the alkali treatment at low (0.1%) concentration was capable of disorganizing the 497
crystallites (decreased Xc) accompanied with increased thermal stability of the molecular order, and
498
disrupting semi-crystalline lamellae. For both starches, the crystalline lamellae were swollen, as 499
confirmed by increased dc. This was because alkali treatment reduced the degree of alignment of double
500
helices within lamellae. As the pores in RMS granules could facilitate the leaching of starch molecules 501
from the granule interior, the alkali induced a reduction in the amorphous lamellar thickness of RMS 502
0 200 400 600
0 20 40 60 80 100 Time (min) S ta rc h D ig e ste d R a tio ( % ) RMS-0.1%-6
A
-4 -3 -2 -1 0 ln (d C /d t) first phase second phase0 200 400 600 800 1000 1200 1400 0 20 40 60 80 100 G50-0.1%-6 Time (min) St arc h D iges ted R at io (%)
B
-4 -3 -2 -1 ln(dC /dt ) first phase second phase0 200 400 600
0 20 40 60 80 100 Time (min) St arc h D iges ted R at io (%) -4 -3 -2 -1 0 1
C
ln(dC /dt ) RMS-0.5%-6 first phase second phase third phase [image:24.612.59.555.35.399.2]through the out-phasing of starch molecules from amorphous lamellae. However, G50 showed increased 503
da (Fig. 1 and Table 1), as the out-phasing of starch molecules from amorphous lamellae might be
504
greatly suppressed. Also, the compactness of amorphous materials, including amorphous lamellae and 505
amorphous growth rings, could be reduced by alkali to a certain degree, as disclosed by SAXS. With 506
weakened packing of starch structures on these different scales, some starch fractions (amorphous starch 507
and crystallites with flaws) with a lower digestion rate (k2) in the second phase was transformed into 508
predominantly-amorphous starch with a higher digestion rate (k1). Due to mild treatment by alkali 509
solution (0.1% concentration), all these changes were relatively moderate. And eventually a modest 510
increase in Ct1 was observed for both starches, although they displayed almost unchanged digestion rates 511
(k1 and k2) in both phases (Fig. 5 and Table 2). 512
513
514
[image:25.612.61.557.380.639.2]515
Fig. 6 Schematic representation for the differences of starch digestion processes of native and alkali-516
treated RMS and G50 517
519
However, when starch granules were treated by a stronger alkali solution (0.5% concentration), the 520
reductions in starch molecular packing on multiple scales became more serious, contributing to the 521
emergence of starch fractions with an intermediate digestion rate (k1 > k2 > k3, see Fig. 5 and Table 2). 522
For RMS, the treatment-induced structural changes were further facilitated by the pores and the flaws in 523
A-type polymorphs. Thus, compared to G50, RMS displayed higher k1 and k2 in the first two phases 524
respectively, as more prominently-weakened packing of RMS caused greater susceptibility of starch 525
molecules to the enzyme. 526
4. Conclusion
527
In summary, native starches (RMS and G50) showed a dual-phase digestion behavior. Alkali 528
treatment partially disorganized the crystallites and semi-crystalline lamellae, and reduced the packing 529
compactness of starch amorphous materials (amorphous lamellae and amorphous growth rings). 530
Consequently, partial starch was transformed into materials with a higher hydrolysis rate. The effect of 531
alkali on starch were evidently enhanced by stronger alkali treatment (using an increased alkali 532
concentration), resulting in the replacement of the dual-phase digestion by a triple-phase pattern, due to 533
the emergence of a starch matrix with an intermediate hydrolysis rate. Furthermore, the multi-scale 534
structural difference derived from the different amylose content determined the resistibility of starch to 535
alkali treatment, eventually altering the digestion behavior. In particular, the pores and crystallite weak-536
points increased the susceptibility of starch granules to alkali treatment, resulting from an enhanced 537
diffusion of alkali, which led to more prominent reduction of the packing of starch hierarchical structure 538
(even the rupture of starch granules). This more apparently increased the digestion rate for RMS than for 539
G50 under the same alkali treatment condition. 540
Therefore, from a hierarchical structural view, this work enables a comprehensive understanding of 541
alkaline effects on the enzymatic digestion rate of starches with different amylose contents, which is of 542
using alkali treatment. Again, since the main influences of alkali is to induce structural disorganizations 544
for starch on different length scales, the results from present work are also valuable for design of starch-545
based food products with tailored digestion behavior, using other physicochemical treatments (plasma 546
treatment, heat-moisture treatment, etc.) that tend to disorganize the hierarchical structure of starch 547
products. 548
549
Abbreviations used:
550
RMS, regular maize starch; G50, Gelose 50 starch 551
552
Acknowledgments
553
The authors from SCUT, China would like to acknowledge research funds from National Natural 554
Science Foundation of China (Nos. 31130042, 31571789) and Science and Technology Planning Project 555
of Guangdong Province, China (Nos. B090600054, B010404002). The research is also supported by the 556
Guangdong Innovative and Entrepreneurial Research Team Program (No. 2013C085). This research was 557
partly undertaken on the SAXS/WAXS beamline at the Australian Synchrotron, Victoria, Australia. D. 558
Qiao also would like to thank the China Scholarship Council (CSC) for providing research funding for 559
his visiting studies at Monash University as part of her PhD work. 560
561
562
References
563
Aravind, N., Sissons, M., & Fellows, C. (2011). Can variation in durum wheat pasta protein and starch 564
composition affect in vitro starch hydrolysis? Food Chemistry, 124(3), 816-821. 565
Blazek, J., & Gilbert, E. P. (2010). Effect of Enzymatic Hydrolysis on Native Starch Granule Structure. 566
Butterworth, P. J., Warren, F. J., Grassby, T., Patel, H., & Ellis, P. R. (2012). Analysis of starch 568
amylolysis using plots for first-order kinetics. Carbohydrate Polymers, 87(3), 2189-2197. 569
Cai, J., Yang, Y., Man, J., Huang, J., Wang, Z., Zhang, C., Gu, M., Liu, Q., & Wei, C. (2014). Structural 570
and functional properties of alkali-treated high-amylose rice starch. Food Chemistry, 145, 245-571
253. 572
Cameron, R. E., & Donald, A. M. (1992). A small-angle X-ray scattering study of the annealing and 573
gelatinization of starch. Polymer, 33(12), 2628-2635. 574
Cameron, R. E., & Donald, A. M. (1993a). A Small-Angle X-Ray-Scattering Study of Starch 575
Gelatinization in Excess and Limiting Water. Journal of Polymer Science Part B-Polymer 576
Physics, 31(9), 1197-1203. 577
Cameron, R. E., & Donald, A. M. (1993b). A Small-Angle X-Ray-Scattering Study of the Absorption of 578
Water into the Starch Granule. Carbohydrate Research, 244(2), 225-236. 579
Campus-Baypoli, O. N., Rosas-Burgos, E. C., Torres-Chavez, P. I., Ramírez-Wong, B., & Serna-580
Saldivar, S. O. (1999). Physiochemical changes of starch during maize tortilla production. 581
Starch-Starke, 51(5), 173-176. 582
Cardoso, M. B., Putaux, J.-L., Samios, D., & da Silveira, N. P. (2007). Influence of alkali concentration 583
on the deproteinization and/or gelatinization of rice starch. Carbohydrate Polymers, 70(2), 160-584
165. 585
Chen, P., Yu, L., Simon, G., Petinakis, E., Dean, K., & Chen, L. (2009). Morphologies and 586
microstructures of cornstarches with different amylose-amylopectin ratios studied by confocal 587
laser scanning microscope. Journal of Cereal Science, 50(2), 241-247. 588
Cooke, D., & Gidley, M. J. (1992). Loss of crystalline and molecular order during starch gelatinisation: 589
origin of the enthalpic transition. Carbohydrate Research, 227, 103-112. 590
Correia, P. R., & Beirão-da-Costa, M. L. (2012). Starch isolation from chestnut and acorn flours through 591
Dhital, S., Butardo, V. M., Jobling, S. A., & Gidley, M. J. (2015). Rice starch granule amylolysis– 593
Differentiating effects of particle size, morphology, thermal properties and crystalline polymorph. 594
Carbohydrate Polymers, 115, 305-316. 595
Edwards, C. H., Warren, F. J., Milligan, P. J., Butterworth, P. J., & Ellis, P. R. (2014). A novel method 596
for classifying starch digestion by modelling the amylolysis of plant foods using first-order 597
enzyme kinetic principles. Food & function, 5(11), 2751-2758. 598
Englyst, H. N., Kingman, S., & Cummings, J. (1992). Classification and measurement of nutritionally 599
important starch fractions. European journal of clinical nutrition, 46, S33-50. 600
Gallant, D., Bouchet, B., Buléon, A., & Pérez, S. (1992). Physical characteristics of starch granules and 601
susceptibility to enzymatic degradation. European Journal of Clinical Nutrition, 46, S3-16. 602
Goñi, I., Garcia-Alonso, A., & Saura-Calixto, F. (1997). A starch hydrolysis procedure to estimate 603
glycemic index. Nutrition Research, 17(3), 427-437. 604
Han, J.-A., & Lim, S.-T. (2004). Structural changes in corn starches during alkaline dissolution by 605
vortexing. Carbohydrate Polymers, 55(2), 193-199. 606
Han, J. Y., & Tyler, R. T. (2003). Characterization of pea starches in the presence of alkali and borax. 607
Starch‐Stärke, 55(10), 457-463. 608
Han, X. Z., & Hamaker, B. R. (2002). Partial Leaching of Granule‐Associated Proteins from Rice 609
Starch during Alkaline Extraction and Subsequent Gelatinization. Starch‐Stärke, 54(10), 454-610
460. 611
Hizukuri, S. (1985). Relationship between the distribution of the chain length of amylopectin and the 612
crystalline structure of starch granules. Carbohydrate Research, 141(2), 295-306. 613
Hoover, R. (2010). The impact of heat-moisture treatment on molecular structures and properties of 614
starches isolated from different botanical sources. Critical Reviews in Food Science and 615
Jane, J.-l., Wong, K.-s., & McPherson, A. E. (1997). Branch-structure difference in starches of A-and B-617
type X-ray patterns revealed by their Naegeli dextrins. Carbohydrate Research, 300(3), 219-227. 618
Jiang, Q., Gao, W., Li, X., Man, S., Shi, Y., Yang, Y., Huang, L., & Liu, C. (2014). Comparative 619
susceptibilities to alkali-treatment of A-, B-and C-type starches of Dioscorea zingiberensis, 620
Dioscorea persimilis and Dioscorea opposita. Food Hydrocolloids, 39, 286-294. 621
Karim, A., Nadiha, M., Chen, F., Phuah, Y., Chui, Y., & Fazilah, A. (2008). Pasting and retrogradation 622
properties of alkali-treated sago (Metroxylon sagu) starch. Food Hydrocolloids, 22(6), 1044-623
1053. 624
Kim, H.-S., & Huber, K. C. (2010). Physicochemical properties and amylopectin fine structures of A-625
and B-type granules of waxy and normal soft wheat starch. Journal of Cereal Science, 51(3), 626
256-264. 627
Lai, L., Karim, A. A., Norziah, M., & Seow, C. (2002). Effects of Na2CO3 and NaOH on DSC thermal 628
profiles of selected native cereal starches. Food Chemistry, 78(3), 355-362. 629
Liu, H., Yu, L., Xie, F., & Chen, L. (2006). Gelatinization of cornstarch with different 630
amylose/amylopectin content. Carbohydrate Polymers, 65(3), 357-363. 631
Lopez-Rubio, A., Htoon, A., & Gilbert, E. P. (2007). Influence of extrusion and digestion on the 632
nanostructure of high-amylose maize starch. Biomacromolecules, 8(5), 1564-1572. 633
Manners, D. J. (1989). Recent developments in our understanding of amylopectin structure. 634
Carbohydrate Polymers, 11(2), 87-112. 635
McDougall, G. J., Shpiro, F., Dobson, P., Smith, P., Blake, A., & Stewart, D. (2005). Different 636
polyphenolic components of soft fruits inhibit α-amylase and α-glucosidase. Journal of 637
Agricultural and Food Chemistry, 53(7), 2760-2766. 638
Nadiha, M. N., Fazilah, A., Bhat, R., & Karim, A. A. (2010). Comparative susceptibilities of sago, 639
potato and corn starches to alkali treatment. Food Chemistry, 121(4), 1053-1059. 640
Nor Nadiha, M. Z., Fazilah, A., Bhat, R., & Karim, A. A. (2010). Comparative susceptibilities of sago, 641
Nwosu, F., Morris, J., Lund, V. A., Stewart, D., Ross, H. A., & McDougall, G. J. (2011). Anti-643
proliferative and potential anti-diabetic effects of phenolic-rich extracts from edible marine algae. 644
Food Chemistry, 126(3), 1006-1012. 645
Paredes-Lópezb, O., & Bello-Péreza, L. A. (2007). Physicochemical and morphological characteristics 646
of nixtamalized maize starch. Starch/Stärke, 59, 277-283. 647
Payan, F., Haser, R., Pierrot, M., Frey, M., Astier, J., Abadie, B., Duée, B., & Buisson, G. (1980). The 648
three-dimensional structure of α-amylase from porcine pancreas at 5 Å resolution–The active-site 649
location. Acta Crystallographica Section B: Structural Crystallography and Crystal Chemistry, 650
36(2), 416-421. 651
Perez, S., & Bertoft, E. (2010). The molecular structures of starch components and their contribution to 652
the architecture of starch granules: A comprehensive review. Starch-Starke, 62(8), 389-420. 653
Pikus, S. (2005). Small-angle x-ray scattering (SAXS) studies of the structure of starch and starch 654
products. Fibres & Textiles in Eastern Europe, 13(5), 82-86. 655
Poulsen, B. R., Ruiter, G., Visser, J., & Iversen, J. J. L. (2003). Determination of first order rate 656
constants by natural logarithm of the slope plot exemplified by analysis of Aspergillus niger in 657
batch culture. Biotechnology Letters, 25(7), 565-571. 658
Praznik, W., Buksa, K., Ziobro, R., Gambuś, H., & Nowotna, A. (2012). The effect of long‐term alkali 659
treatment on the molecular characteristics of native and extruded starches at 35° C. Starch‐ 660
Stärke, 64(11), 890-897. 661
Russell, P. L. (1987). Gelatinisation of starches of different amylose/amylopectin content. A study by 662
differential scanning calorimetry. Journal of Cereal Science, 6(2), 133-145. 663
Shiau, S.-Y., & Yeh, A.-I. (2001). Effects of alkali and acid on dough rheological properties and 664
Shrestha, A. K., Blazek, J., Flanagan, B. M., Dhital, S., Larroque, O., Morell, M. K., Gilbert, E. P., & 666
Gidley, M. J. (2012). Molecular, mesoscopic and microscopic structure evolution during amylase 667
digestion of maize starch granules. Carbohydrate Polymers, 90(1), 23-33. 668
Tan, I., Flanagan, B. M., Halley, P. J., Whittaker, A. K., & Gidley, M. J. (2007). A method for 669
estimating the nature and relative proportions of amorphous, single, and double-helical 670
components in starch granules by C-13 CP/MAS NMR. Biomacromolecules, 8(3), 885-891. 671
Thys, R. C., Westfahl Jr, H., Noreña, C. P., Marczak, L. D., Silveira, N. P., & Cardoso, M. B. (2008). 672
Effect of the alkaline treatment on the ultrastructure of C-type starch granules. 673
Biomacromolecules, 9(7), 1894-1901. 674
Wang, B., Li, D., Wang, L.-j., Liu, Y.-h., & Adhikari, B. (2012). Effect of high-pressure 675
homogenization on microstructure and rheological properties of alkali-treated high-amylose 676
maize starch. Journal of Food Engineering, 113(1), 61-68. 677
Wang, S., & Copeland, L. (2012). Effect of alkali treatment on structure and function of pea starch 678
granules. Food Chemistry, 135(3), 1635-1642. 679
Wang, S., Luo, H., Zhang, J., Zhang, Y., He, Z., & Wang, S. (2014). Alkali-induced changes in 680
functional properties and in vitro digestibility of wheat starch: The role of surface proteins and 681
lipids. Journal of Agricultural and Food Chemistry, 62(16), 3636-3643. 682
Zhang, B., Chen, L., Xie, F., Li, X., Truss, R. W., Halley, P. J., Shamshina, J. L., Rogers, R. D., & 683
McNally, T. (2015). Understanding the structural disorganization of starch in water-ionic liquid 684
solutions. Physical Chemistry Chemical Physics, 17, 13860-13871. 685
Zhang, B. J., Li, X. X., Liu, J., Xie, F. W., & Chen, L. (2013). Supramolecular structure of A- and B-686
type granules of wheat starch. Food Hydrocolloids, 31(1), 68-73. 687
Zhang, B. J., Zhao, Y., Li, X. X., Li, L., Xie, F. W., & Chen, L. (2014a). Supramolecular structural 688
changes of waxy and high-amylose cornstarches heated in abundant water. Food Hydrocolloids, 689
Zhang, B. J., Zhao, Y., Li, X. X., Zhang, P. F., Li, L., Xie, F. W., & Chen, L. (2014b). Effects of 691
amylose and phosphate monoester on aggregation structures of heat-moisture treated potato 692
starches. Carbohydrate Polymers, 103, 228-233. 693
Zhang, G., Ao, Z., & Hamaker, B. R. (2006). Slow digestion property of native cereal starches. 694
Biomacromolecules, 7(11), 3252-3258. 695
Zou, W., Sissons, M., Gidley, M. J., Gilbert, R. G., & Warren, F. J. (2015). Combined techniques for 696
characterising pasta structure reveals how the gluten network slows enzymic digestion rate. Food 697
Chemistry, 188, 559-568. 698
Figure captions
700
Fig.1 SAXS patterns for native and alkali-treated RMS and G50. 701
Fig. 2 XRD patterns for native and alkali-treated RMS and G50. 702
Fig. 3 DSC thermograms for native and alkali-treated RMS and G50. 703
Fig. 4 Typical digestion curves, LOS plots and fit curves for native RMS and G50. ○, Experiment data;
704
× and □, LOS plot data in first and second phases, respectively; , linear fit curve for LOS plot data; 705
and , fit curve based on the slope and intercept values of the linear fit curve for LOS plot in 706
first and second phases, respectively. 707
Fig. 5 Typical digestion curves, LOS plots and fit curves for alkali-treated RMS and G50. ○, Experiment 708
data; ×, □ and ☆, LOS plot data in first, second and third phases, respectively; , linear fit curve for 709
LOS plot data; , or, , fit curve based on the slope and intercept values of the linear fit curve 710
for LOS plot in first, second and third phases, respectively. 711
Fig. 6 Schematic representation for the differences of starch digestion processes of native and alkali-712
treated RMS and G50. 713