Abstract— This paper presents the evaluation of research performance or efficiency of a national R&D program (the 21st Century Frontier R&D Program), invested by the Korean government. Performance evaluation of the R&D program is important for continuous improvement of the program. The super efficiency model was used to get the overall rank of sub projects, supported financially by the R&D program with multiple input and output factors of research activity. The efficiency values and rank are analyzed in relation to some environmental factors of sub projects.
Index Terms—DEA, R&D performance, super efficiency
I. INTRODUCTION
Recently, public organizations such as governments as well as private organizations are under pressure to evaluate the performance of any programs with which they are involved or perform. A large R&D program invested by a government is also required to be evaluated in terms of performance or efficiency. Performance evaluation of R&D projects is important for continuous improvement of the R&D programs. The projects supported by the 21st Century Frontier R&D Program of the Korean government also require some form of performance evaluation to determine their efficiency. We show, in this paper, how a data envelopment analysis (DEA) technique can be used to evaluate the performance of these projects with multiple input and output factors.
The DEA methodology can help bring together a number of performance dimensions, providing a relative performance evaluation of these projects. As will be described in more detail later, DEA uses multiple ‗input‘ and ‗output‘ factors in the performance evaluation. These multiple factors allow the evaluation of projects on multiple dimensions, simultaneously. The results of the DEA methodology are relative efficiency measures [1]. DEA has typically been applied to non-profit organizations or to study branch performance, although latterly it has been applied much more widely, for instance, financial ratio, and software productivity estimation
Within this context, measurement and explanation of
Manuscript received December 8, 2009. This work was supported by Basic Science Research Program through the National Research Foundation of Korea (NRF) grant funded by the Korea government (MEST) (2009-0077362).
BH Jeong, YS Zhang and SM Yang are with Chonbuk National University, Jeonju, 561-756, KOREA (phone: +82-63-270-2329; fax: +82-63-270-2333; e-mail: jeong@ jbnu.ac.kr).
C. Kwon is with the University at Buffalo, SUNY, Buffalo, NY 14260, USA (e-mail: [email protected])
academic R&D efficiency has been considered with econometric and nonparametric methods; see the recent review by Adams and Griliches [2] or specific studies [3]-[8]. Of course, economists have had a long interest in this issue as witnessed by a lengthy literature that considers the efficiency of academic research in economics [9]. More recently, R&D efficiency has been analyzed across private firms [10], and across countries [11], [12]. These papers have employed a variety of methods including simple indicators, parametric specifications of production, value, or other dual functions with symmetric and asymmetric errors, and non-parametric methods such as Data Envelopment Analysis.
The results of basic DEA models, such as CCR and BCC, classify decision making units (DMU) into two sets of those that are efficient and constitute a Pareto frontier and of those that are inefficient [1]. These models don‘t give any idea to compare performances of the efficient DMUs. There have been suggested other approaches and modifications to do this, i.e., cross-efficiency ranking method [13], super-efficiency ranking technique [14], ranking with benchmarking measure [15] and other approaches [16]. Evaluation with super-efficiency is more appropriate to the purpose of this paper.
The purpose of this paper is to evaluate the performance of each project and to investigate how the rank of projects is related with other environmental variables. The results of the analysis would be helpful to make a decision about R&D investment of the government. A brief introduction to the 21st Century Frontier R&D Program is given in the next section. Section 3 describes and summarizes the data set to be used in the analysis and gives the research design with the mathematical model for obtaining super-efficiency. The results of the model execution are summarized in section 4. Section 4 is also devoted to the results of some statistical tests and the discussion about the test results
II. THE 21ST
CENTRY R&DPROGRAM
The 21st Century Frontier R&D Program is a long-term national R&D program of Korea, for selective and intensive development of strategic technologies to enhance national scientific competitiveness to the level of advanced countries by 2010. The objective of the program is to develop the national economy through improving national competitiveness, public welfare, quality of life to the level of advanced countries and creating new industries through the development of future technologies [17]. Projects were selected by two main selection criteria to achieve the objective of the program. One is the technology to develop high-tech products within ten years that can contribute to the
Evaluating the Research Performance of a R&D
Program: an Application of DEA
improvement of national competitiveness. The other is a technology that has a principle researcher who can fully utilize the R&D experience and capabilities and can manage a large-scale, long-term project.
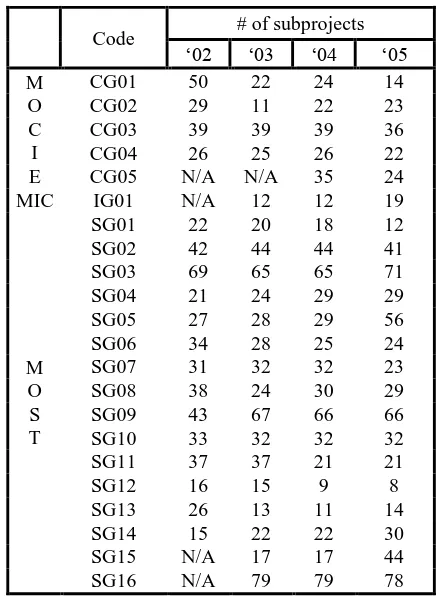
[image:2.595.321.526.336.660.2]Currently, 24 project centers are being supported by this program since two project centers were launched in 1999. The committee of the program has launched three centers in 2000, five centers in 2001, nine centers in 2002, four centers in 2003 and finally 1 center in 2004. These 24 project centers have been launched by funding of three ministries in the Korean government, that is, 18 centers by The Ministry of Science and Technology (MOST), 5 centers by The Ministry of Commerce, Industry & Energy (MOCIE) and 1 center by The Ministry of Information & Communication (MIC). Each center is granted about 9 million US dollar per year by the government and its running period is no more than ten years from its start. Each center is operated and managed under the responsibility of a director who is nominated by the government. That is, the director of each center organizes centers, selects subprojects, forms research teams, and allocate fund to subprojects by its own evaluation system under the responsibility of the director. Thus, the director and each center itself are responsible for the performance of each center and subprojects.
Table 1. The number of subprojects of each project center in the data set
Code # of subprojects ‗02 ‗03 ‗04 ‗05 M
O C I E
CG01 50 22 24 14
CG02 29 11 22 23
CG03 39 39 39 36
CG04 26 25 26 22
CG05 N/A N/A 35 24
MIC IG01 N/A 12 12 19
M O S T
SG01 22 20 18 12
SG02 42 44 44 41
SG03 69 65 65 71
SG04 21 24 29 29
SG05 27 28 29 56
SG06 34 28 25 24
SG07 31 32 32 23
SG08 38 24 30 29
SG09 43 67 66 66
SG10 33 32 32 32
SG11 37 37 21 21
SG12 16 15 9 8
SG13 26 13 11 14
SG14 15 22 22 30
SG15 N/A 17 17 44
SG16 N/A 79 79 78
The data about input factors and output factors of two centers among these 24 centers was not available for the analysis of this study. Thus, the data set is constituted in the input and output factors that are related with the performance of 22 centers. Table 1 summarizes the number of subprojects in each project center available in the data set which was used in DEA analysis of this paper. The number of subprojects supported by these 22 centers is totally 2,670 subprojects. 652
subprojects among them had or have been supported for one year and 315 subprojects for two years, 390 subprojects for three years, and 51 subprojects for 4 years.
[image:2.595.58.278.381.680.2]III. DATASETANDDESIGNOFTHERESEARCH The data set includes input and output factors which are related with the performance of the subprojects. The input variables are R&D investment (million Korean won), the number of involved researchers classified by academic degree such as Ph.D., MSc, and BSc. The output variables include the number of journal papers published, the number of patent, amount of royalty income (million Korean won), and human resource development. The number of papers was counted in the number of papers published in SCI indexed journal and non SCI indexed journal separately. The number of patents was also gathered separately in the number of applied patents and registered patents. The human resource development was counted by the number of earned Ph.D, MSc, and BSc degrees who were trained or educated in the process of these subprojects.
Table 2. The number of projects for supported duration Center
Supported duration(yrs)
Total
1 2 3 4
CG01 38 2 16 5 61
CG02 36 12 7 1 56
CG03 5 58 0 8 71
CG04 19 1 22 3 45
CG05 39 10 0 0 49
IG01 17 10 2 0 29
SG01 21 9 11 0 41
SG02 40 3 35 5 83
SG03 66 4 54 8 132
SG04 14 33 1 5 53
SG05 53 6 21 3 83
SG06 8 34 5 5 52
SG07 21 0 30 2 53
SG08 43 11 16 2 72
SG09 34 2 56 9 101
SG10 29 0 28 4 61
SG11 0 50 0 4 54
SG12 7 17 1 1 26
SG13 25 2 5 5 37
SG14 30 7 15 0 52
SG15 35 10 7 0 52
SG16 0 4 76 0 80
Total 580 285 408 70 1343
of the long term effect of the research. This could be a limitation of this study. Thus, we considered a subproject supported during multiple years to be a DMU. For example, there is a subproject which was supported for three years. R&D investment of this DMU is a summation of investment amount for three years. Value of other input variables and output variables can be obtained by summation of values of respective input and output variables. Ambiguity problem of time lag of research output can be resolved by doing this. Table 2 shows the number of subprojects for periods supported financially by each 21st frontier research center. That is, 42 DMUs of center CG01 are supported for 1 year, 3 DMUs for 2 years, 16 MDUs for three years, and 3 DMUs for 4 years. Thus, 64 DMUs of center CG01 are involved in the analysis of this study. Totally 1408 DMUs of 22 centers were analyzed in this study.
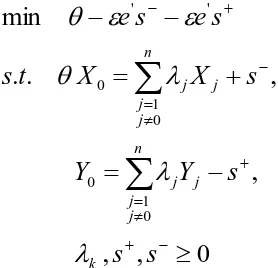
A DEA model was used to evaluate the performance of these 1408 DMUs. DEA models for a given DMU use ratios based on the amount of output factors per given set of input factors. Most basic DEA models, such as CCR model and BCC model, don‘t have any means to rank efficient DMUs because all efficient DMUs have same value of one. Thus, we can‘t compare the performance of efficient subprojects using these basic DEA models. This paper utilized a modified DEA model which Andersen & Peterson [14] suggested to obtain super-efficiency measure for ranking efficient DMUs. This super-efficiency model was utilized to find the rank of projects supported by the 21st Century Frontier R&D Program. Let us denote Yj={yij} to an output vector in which yij denotes the ith output value of subproject j. Xj={xqj} is an input vector in which xqj is the qth input values of subproject j.
λj denotes the intensity of the jth DMU and θ is the super-efficiency of the 0th unit. Then, the super-efficiency model for the DMU 0 is as follows.
0
,
,
,
,
.
.
min
0 1 0 0 1 0 ' '
s
s
s
Y
Y
s
X
X
t
s
s
e
s
e
k j n j j j j n j j j
where s- is slack and s+ is surplus vectors and ε is a non-Archimedian infinitesimal.
The Super-efficiency measures of 1408 DMUs would be obtained using the above model. 1408 DMUs can be ranked by these super-efficiency measures. The next analysis using the results of the super-efficiency model is devoted to investigate how much the performance of subprojects is related with environmental parameters.
There are some environmental variables in the data set. We are interested in how much efficiency or performance of research is related with these environmental variables. The type of organization which performed each subproject can be
[image:3.595.299.555.347.407.2]thought as one of the environmental variables. The types of organization include university (UNIV), government funded research institute (GFRI), large industry (LIND) and small and medium size industry (SMIND). It is expected that there is difference in the performance of research by organization type which performed subprojects. Another environmental variable is the location of the organization which performed each subproject. Technological power seems to be concentrated to Capitol area including Seoul and Kyungki Province because many good universities and population are concentrated in this area. Daejeon area has the largest research complex which consists of many government funded research institutes and industrial research institutes. Other provinces can be treated as provincial regions with same social and research environment. We are also interested in how much difference in the efficiency of subprojects located in different regional area. Table 3 shows the distribution of DMUs on the environmental variables. One-way ANOVA, which is a parametric test, and Kruskal-Wallis test, which is a nonparametric test, was performed to investigate whether environmental variables affect the rank or super-efficiency of subprojects or not.
Table 3. Distribution of DMUs on Environmental Variable Org.
Type
GFRI UNIV LIND SMIND etc.
410 704 65 112 52
Region Seoul Kyungki Daejeon Other prov.
511 175 343 314
IV. ANALYSISOFRESULTS
The above super-efficiency models for the paper are implemented in a commercial optimization modeling language, GAMS, and also solved by a commercial optimization solver, CPLEX LP solver. The model has to be run for each DMU. To automate these processes and deal with large set of data, we used MATLAB and its interface with GAMS devised by Ferris [18].
Ratio of efficient DMUs
0.00 0.10 0.20 0.30 0.40 0.50 0.60 0.70 0.80 0.90 1.00 C G 0 1 C G 0 2 C G 0 3 C G 0 4 C G 0 5 IG 0 1 S G 0 1 S G 0 2 S G 0 3 S G 0 4 S G 0 5 S G 0 6 S G 0 7 S G 0 8 S G 0 9 S G 1 0 S G 1 1 S G 1 2 S G 1 3 S G 1 4 S G 1 5 S G 1 6
Run for whole centers Run within each center
Figure 1. Ratio of the number of efficient DMUs in each center
[image:3.595.99.238.485.619.2] [image:3.595.314.542.534.675.2]DMUs to the total number of DMUs in each center. We can see that centers, such as SG09, CG01, and SG01, include larger number of efficient DMUs relatively than other centers while all DMUs of centers, such as IG01, SG04, SG05, SG12, and SG14, are inefficient. Next, the super-efficiency model was utilized to get super-efficiency of each DMU within each center. That is, DMUs in each center were executed by the model separately. These results can give the information about the performance of subprojects in each center to the director of the center. The ratio of the number of efficient DMUs to the total number of DMUs in each center is shown in Figure 1.
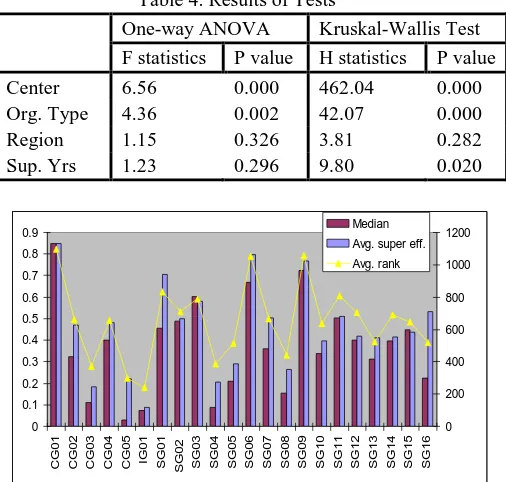
[image:4.595.314.553.167.295.2] [image:4.595.43.296.316.557.2]The super-efficiency measures of DMUs relative to whole set of DMUs were used to perform statistical tests for each environmental variable. We performed two kinds of tests for the analysis. One is one-way ANOVA test as a parametric test and the other is Kruskal-Wallis test as a nonparametric test. These tests were performed using MINITAB. The results of two tests were obtained a little bit different from each other. Table 4 summarizes the results of the tests.
Table 4. Results of Tests
One-way ANOVA Kruskal-Wallis Test F statistics P value H statistics P value
Center 6.56 0.000 462.04 0.000
Org. Type 4.36 0.002 42.07 0.000
Region 1.15 0.326 3.81 0.282
Sup. Yrs 1.23 0.296 9.80 0.020
0 0.1 0.2 0.3 0.4 0.5 0.6 0.7 0.8 0.9
C
G
0
1
C
G
0
2
C
G
0
3
C
G
0
4
C
G
0
5
IG
0
1
S
G
0
1
S
G
0
2
S
G
0
3
S
G
0
4
S
G
0
5
S
G
0
6
S
G
0
7
S
G
0
8
S
G
0
9
S
G
1
0
S
G
1
1
S
G
1
2
S
G
1
3
S
G
1
4
S
G
1
5
S
G
1
6
0 200 400 600 800 1000 1200 Median
Avg. super eff. Avg. rank
Figure 2. Summary of super-efficiency and rank of DMUs in each center
A. Performance of DMUs in Centers.
1408 DMUs are included in 22 centers. We are interested in whether there is any difference in the performance or efficiency of each center. Table 4 shows we can reject the null hypothesis that mean efficiencies (median efficiencies) of all centers are same in one-way ANOVA (Kruskal-Wallis test). Thus, we can conclude that mean efficiency and median efficiency of at least one research center are different from those of others. Figure 2 shows mean (median) efficiency of DMUs in each center which is a test statistic of one-way ANOVA (Kruskal-Wallis test). Average ranks of DMUs in each center are also shown in the figure. The figure suggests the fact that centers such as CG01, SG06, and SG09, got a
relatively higher performance than other centers. Confidence intervals for mean efficiency of each center are shown in Figure 3. From these confidence intervals, it can be concluded that Smart UAV Development Center (CG01), Sustainable Water Resources Research Center (SG06), and Plant Diversity Research Center (SG09) obtained higher performance than other centers except centers CG02, CG04, and SG01.
Figure 3. 95% confidence intervals for mean efficiency of each center.
0 0.1 0.2 0.3 0.4 0.5 0.6
GFRI LIND SMIND UNIV etc
[image:4.595.307.546.343.500.2]0 100 200 300 400 500 600 700 800 Median Avg. super eff. Avg. rank
Figure 4. Summary of super-efficiency of DMUs according to the type of research organization
Figure 5. 95% confidence intervals for mean efficiency of DMUs in each organization type.
B. The type of research organization and performance
[image:4.595.316.543.542.603.2]performed by an research organization in each type of research organization. As we can see in Figure 4, median and average efficiency of GFRI are lower than those of LIND, SMIND, and UNIV. Especially, There is a significant difference in mean efficiencies of UNIV and GFRI at 95% significant level as shown in Figure 5. Thus, we can conclude that subprojects performed by UNIV got higher performance than those performed by GFRI.
C. Regional area and performance
We are also interested in whether there is any difference in the performance measures of regional areas in which an organization performed a subproject is located. Table 4 shows we cannot reject the null hypothesis that mean (median) efficiencies of all regions are same at 95% significance level in one-way ANOVA (Kruskal-Wallis test). These are unexpected results in the light of the special phenomenon that human and economic resources are abnormally concentrated in metropolitan areas. In fact, high level universities and industries are also concentrated in metropolitan area such as seoul and Kyungki area. There is a large national research complex with abundant research facilities and manpower. For this reason, we expected that subprojects performed by research organizations in Seoul, Kyungki and Daejeon area could give higher performance than other areas. However, the results of the analysis turned out quite different what we have expected.
0 0.1 0.2 0.3 0.4 0.5 0.6
1yr 2yrs 3yrs 4yrs
600 620 640 660 680 700 720 740
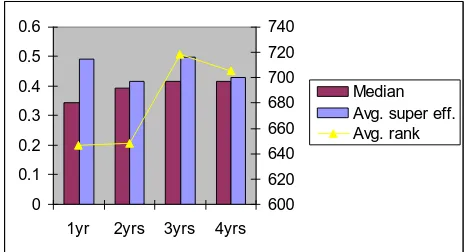
[image:5.595.58.290.395.521.2]Median Avg. super eff. Avg. rank
Figure 6. Summary of super-efficiency of DMUs according to the number of years supported financially
D. The number of supported years and performance
We also performed one-way test and Kruskal-Wallis test to investigate the relation with the number of supported years and performance of subprojects. These two tests gave different results as shown in Table 4. In one-way ANOVA, the null hypothesis can‘t be rejected at 95% significance level. On the contrary, the null hypothesis of Kruskal-Wallis test can be rejected at highly significant level. These conflict results can be explained visually by the fact that the average rank of efficiency is relatively higher at 3 years and 4 years subprojects. Figure 6 shows that mean efficiencies of subprojects supported for 1 year and 3 years are higher than those of subprojects supported for 2 and 4 years even though the difference is not significant at 95% level. On the other hand, subprojects supported for 3 years and 4 years are shown to get significantly higher rank of efficiency than those
supported for 1 year and 2 years. V. CONCLUSION
In this paper, we evaluated the research performance of 1408 subprojects in 22 research centers which were supported by 21st frontier program of the Korean government. Super-efficiency model [14] was used to get overall ranking of research performance and to investigate how the rank of projects is related with other environmental variables. We got some meaningful results about research performance in relation to environmental factors, such as regional area, research organizational types, etc. However, the lag effect of research output was not considered in this paper because of short period of available data set. This matter will be studied next using longer term data set.
REFERENCES
[1] A. W. Charnes, W.W. Cooper & E. Rhodes, ―Measuring efficiency of
decision-making units,‖ Euro. J. Opl. Res. Vol.2, 1978, pp. 429-444
[2] J. D Adams & Z. Griliches,. Research Productivity in a System of
Universities. In: Encaoua, D. (Ed.),The Economics and Econometrics of
Innovation, Kluwer Academic Publishers, Boston. 2000 [3] T. Ahn, A. Charnes, & W. W. Cooper, ―Some statistical and DEA
evaluations of relative efficiencies of public and private institutions of
higher learning,‖ Socio-Economic Planning Sciences, Vol. 22, 1998, pp.
259–269.
[4] N. K. Avkiran, ―Investigating technical and scale efficiencies of Australian universities through data envelopment analysis,‖
Socio-Economic Planning Sciences, Vol. 35, 200157–80.
[5] Y.J. Feng, H. Lu and K. Bi ―An AHP/DEA method for measurement of
the efficiency of R&D management activities in universities,‖ Intl.
Trans. in Op. Res. Vol. 11, 2004, pp. 181–191
[6] P. Korhonen, R. Tainio & J. Wallenius. ―Value efficiency analysis of academic research,‖ European Journal of Operational Research, Vol. 130, 2001, pp 121–132.
[7] L. Cherchye & P. vanden Abeele, ―On research efficiency, a microanalysis of Dutch university research in economics and
businessmanagement,‖ Research Policy, Vol. 34, 2001, pp. 495–516.
[8] T. Groot &, T. Garcıa-Valderrama, ―Research quality and efficiency : An analysis of assessments and management issues in Dutch economics and
business research programs,‖ Research Policy, Vol. 35, 2006, pp.
1362–1376
[9] J.G Thursby, ―What do we say about ourselves and what does it mean?
Yet another look at economics departments research,‖ Journal of
Economic Literature, Vol. 38, 2006, pp. 383–404.
[10] A. Zhang, Y. Zhang, & R. Zhao, ―A study on the R&D efficiency and
productivity of Chinese firms,‖ Journal of Comparative Economics, Vol.
31, 2003, pp. 444–464
[11] M. G. Kocher, M. Luptacik, & M. Sutter, ―Measuring productivity of research in economics. A cross-country study using DEA,‖
Socio-Economic Planning Sciences, Vol. 40, 2006, pp 314-332 [12] E.C. Wang & W. Huang, ―Relative efficiency of R&D activities: A
cross-country study accounting for environmental factors in the DEA
approach,‖ Research Policy, Vol. 36, 2007, pp. 260–273
[13] J. R. Doyle and R. Green, "Efficiency and cross-efficiency in data
envelopment analysis:Derivatives, meanings, and uses," Journal of the
Operational Research Society, vol. 39, 1994, pp. 563-576,.
[14] P. Andersen & N.C. Petersen, ―A Procedure for Ranking Efficient Units
in Data Envelopment analysis,‖ Mgmt. Sci., Vol. 39, No. 10, 1993, pp.
1261-1264
[15] A. M. Torgersen, F. R. Forsund, and S. A. C. Kittelsen, "Slack-adjusted
efficiency measures and ranking of efficient units," The Journal of
Productivity Analysis, vol. 7, pp. 379-398, 1996.
[16] Z. Sinuany-Stern, A. Mehrez, and Y. Hadad, "An AHP/DEA
methodology for ranking decision making units," International
Transactions in Operations Research, vol. 7, 2000, pp. 109-124
[17] The 21st Century Frontier R&D Program, Ministry of Science &
Technology, 2002
[18] M. C. Ferris. MATLAB and GAMS, ―Interfacing optimization and
visualization software,‖ Mathematical Programming Technical Report