Abstract — This study compares the robustness of reorder point and Kanban replenishment strategies in a capacitated supply chain. An index is developed to quantify robustness in situations where inventory and delivery performance measures interact. The transit time variability, transporter release interval and setup time variability are examined as environmental factors under which robustness of the strategies are compared. An optimum-seeking simulation approach is used to conduct experiments. Optimal trade-off curve are used to visually compare the robustness of the strategies. Furthermore, the area under the curves is calculated and a robustness index is computed to quantitatively compare the strategies.
Index Terms — Reorder point, Kanban, Optimal trade-off curve, Robustness, Simulation.
I. INTRODUCTION
In recent years companies have made efforts to improve their service levels while keeping inventory low. Replenishment strategies have been compared in various studies to determine which is best under given environmental conditions. There are number of studies where replenishment strategies, such as MRP, ROP, Kanban and CONWIP, are compared on the basis of some performance measure [1]-[5]. However, insufficient attention has been given to testing the robustness of these replenishment strategies, where robustness is defined as the capability to deal with changing environmental conditions [4]. Studies related to robustness measurement are found in quite different fields, such as process control systems [6], scheduling [7, 8, 9], tactical plans for supply chain networks [10] and environmental policies [11]. However, there is a lack of studies where the robustness of replenishment strategies have been tested and compared.
The robustness issue was raised during a panel discussion on simulation-optimization at the 2000 Winter Simulation Conference. All speakers agreed that robustness is of great Manuscript received Feburary 28, 2010. Drs. Enns and Rogers wish to thank NSERC for Discovery Grant funding to support the research reported. Additionally, Mr. Grewal wishes to thank the Killam Trusts for scholarship funding.
Chandandeep S. Grewal is a Ph.D. student in the Department of Mechanical and Manufacturing Engineering, University of Calgary, Calgary, AB T2N 1N4 Canada (phone: 403-220-3631; fax: 403-282-8406; e-mail: csgrewal@ ucalgary.ca).
Silvanus T. Enns is an Associate Professor in the Department of Mechanical and Manufacturing Engineering, University of Calgary, Calgary, AB T2N 1N4 Canada (e-mail: enns@ ucalgary.ca).
Paul Rogers is an Associate Professor in the Department of Mechanical and Manufacturing Engineering, University of Calgary, Calgary, AB T2N 1N4 Canada (e-mail: rogers@ ucalgary.ca).
importance since an optimal solution for a given scenario may not be relevant if the environment changes [12]. This observation provided the motivation to conduct the current research, involving a study of reorder point and Kanban replenishment strategy robustness. These two replenishment strategies are among those commonly used in capacity-constrained environments.
Both are pull-based, meaning that downstream demand initiates replenishment. Reorder point strategies are usually continuous review, where replenishment decisions are made based on the current inventory position and the reorder point. The current inventory position, including backorders, is monitored continuously. When the position falls to less than or equal to the reorder point, a new order is triggered. Kanban strategies monitor only the inventory in the container being currently emptied. Orders are triggered when a Kanban container becomes empty, whereupon a Kanban card is used to initiate replenishment from an upstream supply location. The maximum inventory in a Kanban system is restricted by the container size and the number of Kanban cards, or containers, in circulation.
It may be possible that one strategy is better in terms of performance when run optimally but is not as robust with respect to changes in the environment. The objective of this study is to test and compare the robustness of Kanban and reorder point strategies using the optimal trade-off curve approach, which considers both the inventory held in the system and customer delivery performance. This study is intended to address the following questions: (a) How does the optimal trade-off curve shift, which indicates the robustness, as the environmental factors change? (b) How can the robustness of a replenishment strategy be quantified when there are two interacting performance measures to simultaneously consider?
The remainder of this paper is organized as follows. Section II presents a step-by-step procedure to measure the robustness of a replenishment strategy. Section III describes a capacitated supply chain scenario used in simulation experiments to study robustness. This is followed by a description of experiments performed in Section IV. Experimental results and a discussion are presented in Section V. Finally, conclusions are summarized in Section VI.
II. ROBUSTNESS MEASUREMENT PROCEDURE In this section the robustness measurement approach is described. This study uses optimal trade-off curves to observe the robustness of the reorder point and Kanban replenishment strategies.
Robustness-based Comparison of Reorder Point
and Kanban Replenishment Strategies
Step 1:
Define and select the factors and performance measures under which robustness is to be measured. In this study, the transit time variability, transporter release interval and setup time variability are considered as environmental factors. Total inventory and the customer service level are taken as the performance measures. Total Inventory (TIj) is a time
persistent quantity for strategy j, equal to the sum of work-in-process inventory (WIP) and finished goods inventory (FG). It can be represented by the following:
1 , , 1
where ts and te mark the start and end of the simulation data
collection period and ‘i’ is the index for the product type. The second performance measure considered is the customer delivery service level, βi,j, which is defined as
follows:
, ,
, ,
2
where , represents the number of satisfied customers,
assumed to be those getting the product immediately, and
, represents the number of customers experiencing
backorders. Step 2:
Compute the performance of each replenishment strategy with the decision variables (e.g. reorder points or kanban cards and order quantities) at optimal settings. In this study a discrete-event simulation model has been developed in which both the reorder point and Kanban replenishment strategies are implemented. Optimum-seeking simulation is used to determine optimal decision variable settings, given various stochastic inputs. The following optimization, in conjunction with simulation, is used to find the optimal decision variables and generate an optimal performance trade-off curve.
Minimize TIj (x, y)
Subject to:
βi,j (x,y) ≥ βp for i = 1, 2...n
where βpis the target service level and x, y are the decision
variable vectors for each replenishment strategy. The optimal trade-off curve, for a given replenishment environment, is then plotted as a function of different service levels.
Step 3:
Compute the performance measures at perturbed values of the transit time variability, transporter release interval and setup time variability. Then plot the trade-curves for each of these factors at the perturbed values. These trade-off curves provide a visual representation of robustness and a comparison of the alternative replenishment strategies. The closer the trade-off curves are to the optimal trade-off curve,
[image:2.595.310.546.67.259.2]the higher is the robustness. One difficult issue is how to
Figure 1 Illustration of robustness measurement
measure the robustness given there are two performance measures to consider. In this research, the areas under the curves based on the perturbed environment are measured along with those under the optimal tradeoff curve. Figure 1 illustrates the measurement of the area to quantify the robustness. The approach is an extension to that used by Suwanruji and Enns [3] to measure and compare the performance of replenishment strategies. The advantage of this approach is that a single measure (i.e. area) can be used for analysis as opposed to two interacting performance measures. It also facilitates statistical analysis.
Step 4:
Once the area under each curve has been calculated, a measure of robustness needs to be computed. In this research a robustness index based on area computations is being proposed. The higher the value of robustness index, the greater will be the robustness. The absolute ratio of the area under the optimal trade-off curve to the difference between the optimal and perturbed trade-off curve areas is given as:
,
, , 3
where , represents the area under the optimal trade-off curve, , is the area under the trade-off curve after an environmental factor has been perturbed and j is index for the replenishment strategy. However this ratio needs to be scaled to get a suitable index since if the difference is very small the ratio will be very high, or vice versa. Therefore taking the base-10 logarithm is suggested.
,
, , 4
If , , , , the value
of this equation will be in negative. Therefore, 1 is added to
T
ot
a
l I
n
ve
nt
or
y
Service Level
Optimal trade-off curve
Area difference under optimal Trade-off curve and trade- off curve ‘A’
make the lower bound of this equation zero. Hence, the robustness index (RI) becomes the following.
1 ,
, , 5
It is assumed that perturbation always has some effect and
that , , 0. The upper value of
this index is usually less than 10 even if the difference in areas under the optimal and perturbed trade-off curves is extremely small.
Step5:
Compare the replenishment strategies on the basis of the robustness index. The best strategy in terms of robustness is the one with the higher robustness index. Naturally, the mean performance, as given by a comparison of the areas under the optimal trade-off curves for different strategies, must also be considered in determining the best replenishment strategy.
III. EXPERIMENTAL SCENARIO
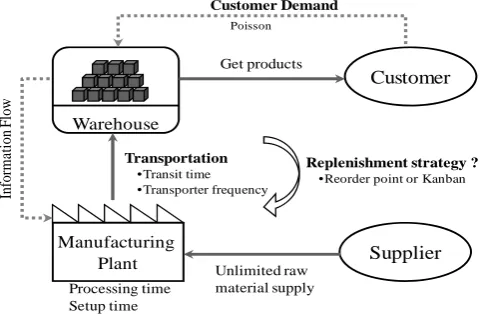
The experimental supply chain used in this research, shown in Fig. 2, consisted of customer demand, a finished goods warehouse, a manufacturing plant, a transport system and a replenishment order system. It was assumed that this supply chain involved two types of products. These products were not interchangeable with respect to customer demand but did have the same processing requirement characteristics, making it simpler to concentrate on the behaviour under focus in this study. Unlimited raw materials for the manufacturing process were assumed to be immediately available from the supplier.
The customer demand for each product type was assumed to be Poisson, which means the interarrival time between customers followed a negative exponential distribution. The mean demand rate for both product types was set to 20 per time unit, with the time units assumed to be hours. Each customer was assumed to require only one unit of either product type 1 or 2. If warehouse finished goods inventory of the required product type was in stock, the customer demand was filled immediately. Otherwise the demand was backordered and filled immediately once inventory became available. There were assumed to be no lost sales.
If the Kanban strategy is being used, the decision variables are considered to be the Kanban container size (i.e. quantity of parts held) and the number of Kanbans cards for each product type. In this research a single-card system is assumed and the Kanban cards are considered to be equivalent to containers with respect to the replenishment logic. Once a Kanban container at the warehouse is empty it is free to re-circulate back to the manufacturing plant, thus initiating a replenishment order. However, it is assumed that a transporter is required. Transporters leave from the warehouse at fixed intervals of 4 hours. The transporters may carry one or multiple Kanban orders back to the manufacturing plant. The travel time is assumed to follow a triangular distribution with parameters (4, 8, 12) hours.
If the reorder point strategy is used, the decision variables
are the reorder point and reorder quantity for each product type. The inventory position is continuously reviewed and once the reorder point for either product is reached, an order to the manufacturer is initiated. In order to keep comparisons unbiased with respect to the order time back to the manufacturer, a delay approximately equal to the Kanban order delay was implemented. This delay was assumed equal to the mean Kanban transportation time of 8 hours plus an adjustment drawn from a uniform distribution with parameters (0, 4) hours. This latter adjustment was added to compensate for the average delay Kanban orders experience at the warehouse waiting for a transporter.
Once orders are received at the manufacturer they are processed in first-come-first-served (FCFS) priority. The manufacturer was considered to have only one processing stage. A setup was required between each order (or batch), regardless of the sequence of the product types being produced. This setup time was assumed to follow a Gamma distribution with a mean of 0.25 hours and standard deviation of 0.125 hours. Each unit in the order had a deterministic processing time of 0.015 hours. These values were the same for both product types. The total batch processing time was the setup time plus the processing time per unit times the lot size (LS). This lot size was assumed to be equal to the order quantity.
Once an order was completed at the manufacturer it had to wait for a transporter to ship it to the warehouse. Transporters were released from the manufacturer at fixed intervals of 4 hours and could carry one or multiple lot-size orders of any product type. The downstream travel time distribution was again triangular with parameters (4, 8, 12) hours. Once the orders were received at the warehouse, they were added to finished goods inventory.
IV. SIMULATION EXPERIMENTS
[image:3.595.305.546.78.235.2]A discrete-event simulation model for the capacitated supply chain shown in Fig. 2 was developed using Arena® 12.00 [13]. This model facilitates doing experiments with either Kanban or reorder point replenishment. In this study, the robustness under three factors was of interest; namely the transit time variability, transporter release interval and setup time variability. These factors were changed one by one as shown in Table I. Transit time variability was
Figure 2 A capacitated supply chain scenario
Customer
Warehouse
Customer Demand
Manufacturing
Plant Supplier
Get products
Processing time Setup time
Unlimited raw material supply
Replenishment strategy ? •Reorder point or Kanban Poisson
Transportation •Transit time •Transporter frequency
In
fo
rm
at
io
n F
lo
controlled by changing the parameter Δ, where the triangular transit time distribution is given by Average transit time ×
Triangular (1-Δ, 1, 1+Δ). For the base case Δ was set to 0.5, resulting in a triangular distribution specified by (4, 8, 12) hours.
Transportation release interval refers to the interval between the releases of transporters to pick the filled containers or the lots from manufacturing station. For the base case, transporters are released at 4 hour intervals. Setup time follows a Gamma distribution and variability is defined by coefficient of variation (CV) of the gamma distribution. It is assumed 0.5 for a base case scenario.
In the first stage, optimum-seeking simulation experiments were performed to get the near optimal solution for the base case, or reference environment. These experiments were run at different service level values (75%, 80%, 85%, 90%, 95% and 99%). Arena® and OptQuest®, a heuristic-based optimization package, were used together to find the optimal replenishment decision variables at each target service level. The variables optimized for the Kanban strategy were the Kanban container size and the number of containers. Similarly, optimal lot sizes and order points were determined for the reorder point strategy. Optimality was based on minimizing the total inventory (TI) subject to achieving the service level constraint (βp). The optimal
trade-off curves for each strategy were then plotted.
In the second stage, simulation alone was used to conduct the experiments at the perturbed values of the given factors. The factors were increased or decreased one by one and simulation experiments were conducted. Performance measures were determined using the same decision variables found at the target service level in the base case. Trade-off curves were then generated for the increased and decreased values of the perturbed environmental factors.
The warm up period for each simulation run was 1500 hours. It was confirmed that this was sufficient for the system to reach steady-state conditions. Data was collected over 100,000 hours for every run. Five replications were run at each target service level. Common random numbers (CRN) were used as a variance reduction technique.
V. RESULTS AND DISCUSSION
In this section, the simulation results and comparison of the reorder point and Kanban strategies on the basis of robustness is presented. Figures 3 to 8 are the trade-off curves between total inventory and the service level for each factor. The values at each service level are the average of five replications. In Figures 3 to 8, the middle curve denotes the curve at the optimal decision variable settings for each strategy. The upper and lower trade-off curves are at the increased and decreased environmental factors levels respectively. The following subsections discuss the results for each factor.
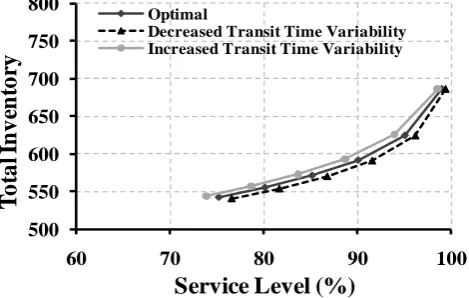
A. Robustness under Transit Time variability
Figures 3 and 4 show the behavior of both strategies with increased and decreased transit time variability. The behavior looks similar for both strategies and little can be concluded visually. Therefore the area under the trade-off curves was calculated to compute the robustness in quantitative terms. A summary of the areas, calculated between service levels of 81% and 98%, is given in the Appendix. The robustness indices, along with 95% confidence level half widths, are shown in Table II. It was found that with both increased and decreased transit time variability the robustness index of the Kanban strategy is higher than that of the reorder point strategy. Therefore Kanban is the most robust under transit time variability. Another interesting observation is that the difference between robustness levels is highest at lower variability. Therefore, it can be concluded that the relative robustness of the Kanban strategy deteriorates with increased transit time variability.
B. Robustness under Transporter Release interval
[image:4.595.47.288.128.194.2]The transport release interval refers to the time interval between releases of transporters to pick up the processed lots from the manufacturing unit. Trade-off curves shown in Figures 5 and 6 depict the behavior of both strategies as the interval is perturbed. A low release interval refers to transporters being released at smaller time intervals, and vice versa. A close look at Figures 5 and 6 indicates that the curves at increased release intervals for the reorder point strategy are closer to the optimal curve than for the Kanban strategy. This can be better understood by looking at the robustness index for both strategies at increased release intervals. The robustness index is higher for the reorder point strategy at increased release intervals but is higher for the Kanban strategy at decreased release intervals. This means that the more quickly the transporters are released, the higher is the relative robustness of the Kanban strategy.
Figure 3 Trade-off curves with transit time variability in reorder point strategy
500 550 600 650 700 750 800
60 70 80 90 100
To
ta
l I
n
v
en
to
ry
Service Level (%)
OptimalDecreased Transit Time Variability Increased Transit Time Variability Table I Summary of Factors
Factors Base value Change in factor
Transit time variability (Δ) 0.5 ± 20 % Transporter release interval 4 ± 10 %
[image:4.595.311.546.501.650.2]Figure 4 Trade-off curves with transit time variability in Kanban strategy
Figure 5 Trade-off curves with transporter release interval variability in reorder point strategy
Figure 6 Trade-off curves with transporter release interval variability in Kanban strategy
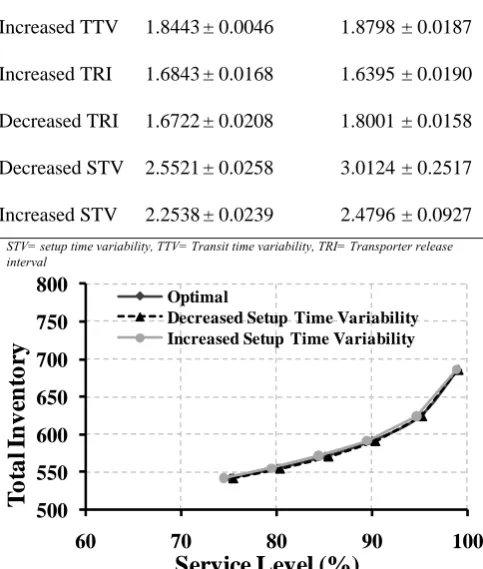
C. Robustness under Setup Time Variability
[image:5.595.307.549.127.412.2]The third factor was the setup time variability. Figures 7 and 8 illustrate the trade-off curves. Trade-off curves for both strategies are very close to the optimal trade-off curve, even though the change in variability was 50% from the base value. This means setup time variability has little impact on the performance of either strategy. The robustness index is also higher than for the other factors. The robustness index with decreased setup time variability for the reorder point and Kanban strategies were 2.5521 and 3.0124, respectively. Similarly, with increased variability, the robustness values were 2.2538 and 2.4796.
Table II Comparison of robustness index
Factor
ROP
Robustness Index
Kanban
Robustness Index Decreased TTV 1.8184 ± 0.0055 1.9111 ± 0.0083 Increased TTV 1.8443 ± 0.0046 1.8798 ± 0.0187 Increased TRI 1.6843 ± 0.0168 1.6395 ± 0.0190 Decreased TRI 1.6722 ± 0.0208 1.8001 ± 0.0158 Decreased STV 2.5521 ± 0.0258 3.0124 ± 0.2517 Increased STV 2.2538 ± 0.0239 2.4796 ± 0.0927
[image:5.595.51.291.240.393.2]STV= setup time variability, TTV= Transit time variability, TRI= Transporter release interval
Figure 7 Trade-off curves with setup time variability in reorder point strategy
Figure 8 Trade-off curves with setup time variability in Kanban strategy
This indicates that the Kanban strategy is the most robust. However, the difference in robustness values decreases with increased variability. Therefore, similar to transit time variability robustness, relative Kanban robustness performance deteriorates with increased setup time variability.
VI. CONCLUSION
In this paper, the reorder point and Kanban replenishment strategies have been compared on the basis of robustness in a capacitated supply chain environment. Robustness was measured on the basis of the area under performance trade-500
550 600 650 700 750 800
60 70 80 90 100
To
ta
l I
n
v
en
to
ry
Service Level (%)
OptimalDecreased Transit Time Variability Increased Transit Time Variability
500 550 600 650 700 750 800
60 70 80 90 100
T
o
ta
l I
n
ve
nt
or
y
Service Level (%)
Optimal
Decreased Transporter Release Interval Increased Transporter Release Interval
500 550 600 650 700 750 800
60 70 80 90 100
T
o
ta
l I
n
ve
nt
or
y
Service Level (%)
Optimal
Decreased Transporter Release Interval Increased Transporter Release Interval
500 550 600 650 700 750 800
60 70 80 90 100
To
ta
l I
n
v
en
to
ry
Service Level (%)
OptimalDecreased Setup Time Variability Increased Setup Time Variability
500 550 600 650 700 750 800
60 70 80 90 100
T
o
ta
l I
n
ve
nt
or
y
Service Level (%)
Optimal [image:5.595.53.292.434.583.2] [image:5.595.310.551.451.605.2]off curves based on total inventory and customer service levels. A robustness index has been proposed to measure the robustness simultaneously under these two interacting performance measures. Simulation experiments were conducted by varying three factors; namely the transit time variability, transporter release interval and setup time variability.
It was found that the Kanban strategy is consistently more robust than the reorder point strategy under transit time and setup time variability. However the relative robustness of the Kanban strategy deteriorates with increased transit time and setup time variability.
Further, statistical analysis can be carried out to find the significance of robustness differences and interactions between the strategies at the low and high factors settings. As well, further work is required to test the robustness of other replenishment strategies and environmental factors.
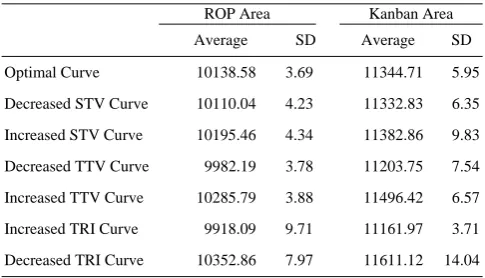
[image:6.595.46.289.303.442.2]APPENDIX
Table 1 Summary of area calculations under trade-off curves ROP Area Kanban Area
Average SD Average SD
Optimal Curve 10138.58 3.69 11344.71 5.95
Decreased STV Curve 10110.04 4.23 11332.83 6.35
Increased STV Curve 10195.46 4.34 11382.86 9.83
Decreased TTV Curve 9982.19 3.78 11203.75 7.54
Increased TTV Curve 10285.79 3.88 11496.42 6.57
Increased TRI Curve 9918.09 9.71 11161.97 3.71
Decreased TRI Curve 10352.86 7.97 11611.12 14.04 SD= Standard deviation
REFERENCES
[1] L.P. Rees, P.Y. Huang and B.W. Taylor, “A comparative analysis of an MRP lot-for-lot system and a kanban system for a multistage production operations”, International Journal of Production Research, vol. 27, no. 8, 1989, pp.1427-1443.
[2] A.M. Bonvik, C.E. Couch and S.B. Gershwin, “A comparison of production-line control mechanisms”, International Journal of Production Research, vol. 35, no. 3, 1997, pp.789 – 804.
[3] P. Suwanruji and S.T. Enns, “Evaluating the effects of capacity constraints and demand patterns on supply chain replenishment strategies”, International Journal of Production Research, vol. 44, no. 21, 2006, pp.4607-4629.
[4] H. Jodlbauer and A. Huber, “Service-level performance of MRP, kanban, CONWIP and DBR due to parameter stability and environmental robustness”, International Journal of Production Research, vol. 46, no. 8, 2008, pp.2179-2195.
[5] C. Grewal, P. Rogers and S.T. Enns, “Performance evaluation of inventory replenishment strategies in a capacitated supply chain under optimal parameter settings,” International Journal of Value Chain Management, to be published.
[6] R. D. Mascio, “An economic measure for comparing dynamic robustness,” Journal of Process Control, vol. 12, 2002, pp 745–751. [7] I. N. Pujawan, “Schedule nervousness in a manufacturing system: a
case study,” Production Planning & Control, vol. 15, no. 5, July 2004, pp.515–524
[8] A. Rossi, “A robustness measure of the configuration of multi-purpose machines”, International Journal of Production Research, vol. 48, no. 4, 2010, pp.1013- 1033.
[9] D. J. Mignon, S. J. Honkomp and G. V. Reklaitis, “A framework for investigating schedule robustness under uncertainty”, Computers and Chemical Engineering, vol. 19, 1995, pp.S615-S620.
[10] P. Genin, S. Lamouri, and A.Thomas, “Multi-facilities tactical planning robustness with experimental design”, Production Planning & Control, vol.19, no. 2, 2008, pp.171-182.
[11] L.K. Jason, H. W. Keith, D. M. Kilgour, “Using environmental indicators to quantify the robustness of policy alternatives to uncertainty”, Ecological Modelling, vol. 130, 2000, pp.79–86 [12] J.P.C. Kleijnen and E. Gauri, “Short-term robustness of production
management systems: A case study”, European Journal of Operational Research, vol.148, 2003, pp.452-465.