Human Attention in Visual Question Answering:
Do Humans and Deep Networks Look at the Same Regions?
Abhishek Das1∗ Harsh Agrawal1∗ C. Lawrence Zitnick2 Devi Parikh1,3 Dhruv Batra1,3 1Virginia Tech 2Facebook AI Research 3Georgia Institute of Technology
{abhshkdz, harsh92, parikh, dbatra}@vt.edu, [email protected]
Abstract
We conduct large-scale studies on ‘human at-tention’ in Visual Question Answering (VQA) to understand where humans choose to look to answer questions about images. We de-sign and test multiple game-inspired novel attention-annotation interfaces that require the subject to sharpen regions of a blurred im-age to answer a question. Thus, we in-troduce the VQA-HAT (Human ATtention) dataset. We evaluate attention maps generated by state-of-the-art VQA models against hu-man attention both qualitatively (via visualiza-tions) and quantitatively (via rank-order cor-relation). Overall, our experiments show that current VQA attention models do not seem to be looking at the same regions as humans.
1 Introduction
It helps to pay attention. Humans have the ability to quickly perceive a scene by selectively attending to parts of the image instead of processing the whole scene in its entirety (Rensink, 2000). Inspired by hu-man attention, a recent trend in computer vision and deep learning is to build computational models of at-tention. Given an input signal, these models learn to attend to parts of it for further processing and have been successfully applied in machine transla-tion (Bahdanau et al., 2015; Firat et al., 2016), ob-ject recognition (Ba et al., 2015; Mnih et al., 2014; Sermanet et al., 2014), image captioning (Xu et al., 2015; Cho et al., 2015) and visual question answer-ing (Yang et al., 2016; Lu et al., 2016; Xu and Saenko, 2015; Xiong et al., 2016).
In this work, we study attention for the task of Vi-sual Question Answering (VQA). Unlike image cap-tioning, where a coarse understanding of an image
[image:1.612.316.537.204.366.2]∗Denotes equal contribution.
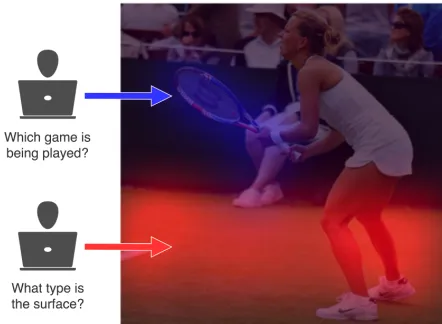
Figure 1: Different human attention regions based on question. (best viewed in color)
is often sufficient for producing generic descriptions (Devlin et al., 2015), visual questions selectively tar-get different areas of an image including background details and underlying context. This suggests that a VQA model may benefit from an explicit or implicit attention mechanism to answer a question correctly. In this work, we are interested in the following ques-tions: 1) Which image regions do humans choose to look at in order to answer questions about images? 2) Do deep VQA models with attention mechanisms attend to the same regions as humans?
We design and conduct studies to collect “human attention maps”. Figure 1 shows human attention maps on the same image for two different ques-tions. When asked ‘What type is the surface?’, hu-mans choose to look at the floor, while attention for ‘Which game is being played?’ is concentrated around the player and racket.
These human attention maps can be used both for evaluating machine-generated attention maps and for explicitly training attention-based models.
(a) (b) (c)
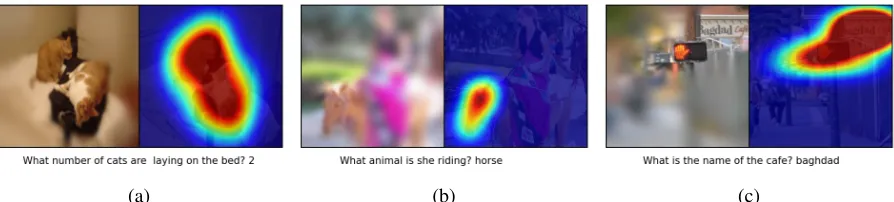
Figure 2: (a-c): Column 1 shows deblurred image, and column 2 shows human attention map.
Contributions. First, we design game-inspired novel interfaces for collecting human attention maps of where humans choose to look to answer ques-tions from the large-scale VQA dataset (Antol et al., 2015); this VQA-HAT (Human ATtention) dataset is publicly available at our project webpage1
Sec-ond, we perform qualitative and quantitative com-parison of the maps generated by state-of-the-art attention-based VQA models (Yang et al., 2016; Lu et al., 2016) and a task-independent saliency base-line (Judd et al., 2009) against our human atten-tion maps through visualizaatten-tions and rank-order cor-relation. We find that machine-generated attention maps from the most accurate VQA model have a mean rank-correlation of 0.26 with human atten-tion maps, which is worse than task-independent saliency maps that have a mean rank-correlation of 0.49. It is well understood that task-independent saliency maps have a ‘center bias’ (Tatler, 2007; Judd et al., 2009). After we control for this center bias, we find that the correlation of task-independent saliency is poor (as expected), while trends for machine-generated VQA-attention maps remain the same, which confirms our key finding that current VQA attention models do not seem to be looking at the same regions as humans.
2 Related Work
Our work draws on recent work in attention-based VQA and human studies in saliency prediction. We work with the free-form and open-ended VQA dataset released by (Antol et al., 2015).
VQA Models. Attention-based models for VQA typically use convolutional neural networks to
high-1http://computing.ece.vt.edu/˜abhshkdz/
vqa-hat
light relevant regions of image given a question. Stacked Attention Networks (SAN) proposed in (Yang et al., 2016) use LSTM encodings of ques-tion words to produce a spatial attenques-tion distribuques-tion over the convolutional layer features of the image. Hierarchical Co-Attention Network (Lu et al., 2016) generates multiple levels of image attention based on words, phrases and complete questions, and is the top entry on the VQA Challenge2as of the time
of this submission. Another interesting approach uses question parsing to compose the neural network from modules, attention being one of the sub-tasks addressed by these modules (Andreas et al., 2016). Note that all these works areunsupervisedattention models, where “attention” is simply an intermedi-ate variable (a spatial distribution) that is produced by the model to optimize downstream loss (VQA cross-entropy). The fact that some (it’s unclear how many) of these spatial distributions end up being interpretable is simply fortuitous. In contrast, we study where humans choose to look to answer vi-sual questions. These human attention maps can be used to evaluate unsupervised maps.
Human Studies. There’s a rich history of work in collecting eye tracking data from human subjects to gain an understanding of image saliency and vi-sual perception (Jiang et al., 2014; Judd et al., 2009; Fei-Fei et al., 2007; Yarbus, 1967). Eye tracking data to study natural visual exploration (Jiang et al., 2014; Judd et al., 2009) is useful but difficult and expensive to collect on a large scale. (Jiang et al., 2015) established mouse tracking as an accu-rate alternative to eye tracking for collecting atten-tion maps. They collected large-scale attenatten-tion an-notations for MS COCO (Lin et al., 2014) on
[image:2.612.84.531.59.160.2]zon Mechanical Turk (AMT). While (Jiang et al., 2015) studies natural exploration and collects task-independent human annotations by asking subjects to freely move the mouse cursor to anywhere they wanted to look on a blurred image, our approach is task-driven. (Jia Deng and Jonathan Krause and Li Fei-Fei, 2013; Deng et al., 2015) leverage crowd-sourcing to help computers select discriminative fea-tures for fine-grained recognition. They introduce a novel gamified setting where the humans can reveal regions with certain penalty which ensures discrim-inative regions with assured quality. Related to this is the work of (von Ahn and Dabbish, 2004) who ex-plore gamification to locate objects in an image. To the best of our knowledge, this is the first work to collect human attention maps for VQA.
Specifically, as described in Section 3, we collect ground truth attention annotations by instructing subjects to sharpen parts of a blurred image that are important for answering the questions accurately. Section 4 covers evaluation of unsupervised atten-tion maps generated by VQA models against our hu-man attention maps.
3 VQA-HAT (Human ATtention) Dataset
We design and test multiple game-inspired novel in-terfaces for conducting large-scale human studies on AMT. Our basic interface design consists of a “de-blurring” exercise for answering visual questions. Specifically, we present subjects with a blurred im-age and a question about the imim-age, and ask subjects to sharpen regions of the image that will help them answer the question correctly, in a smooth, click-and-drag, ‘coloring’ motion with the mouse. The sharpening is gradual: successively scrubbing the same region progressively sharpens it.
We experiment with multiple variants of the data collection interface. Analysis of the interfaces as well as details of the human evaluation studies con-ducted to converge on the final interface used for re-sults in this main document have been included in the supplement. The human evaluation studies con-sisted of showing these attention-sharpened images to humans and asking them to answer the question. Based on these human studies, we pick the “Blurred Image with Answer” interface, where subjects were shown the correct answer in addition to the
ques-tion and blurred image, and asked to deblur as few regions as possible such that someone can answer the question just by looking at the sharpened re-gions. Since the payment structure on AMT encour-age completing tasks as quickly as possible, this im-plicitly incentivizes subjects to deblur as few regions as possible. Our followup human studies on these collected maps show that other subjects are able to answer questions based on these collected maps (de-tails in supplement). Thus, overall we achieve a bal-ance between highlighting too little or too much. Note that the “Blurred Image with Answer” inter-face used to collect attention maps is a verification task as opposed to actual question answering. We show subjects an answer and ask them to sharpen regions that will help them answer the question cor-rectly, as opposed to showing them just the ques-tion and asking them for the answer as well as rel-evant sharpened regions in the image (“Blurred Im-age without Answer” interface). Attention maps col-lected via this verification task “Blurred Image with Answer” are more informative (in terms of human VQA accuracy) than those collected for “Blurred Image without Answer” – 78.7% vs. 75.2%. We collected human attention maps for 58475 train (out of 248349 total) and 1374 val (out of 121512 total) question-image pairs from the VQA dataset. This dataset is publicly available1. Overall, we
con-ducted approximately 20000 Human Intelligence Tasks (HITs) on AMT, among 800 unique workers. Figure 2 shows examples of collected human atten-tion maps.
Figure 3
4 Human Attention Maps vs Unsupervised Attention Models
Now that we have collected these human attention maps, we can ask the following question – do unsu-pervised attention models learn to predict attention maps that are similar to human attention maps? To rephrase, do neural networks look at the same re-gions as humans to answer a visual question?
VQA Attention Models. We evaluate maps gener-ated by the following unsupervised models:
• Stacked Attention Network (SAN) (Yang et al.,
2016) with two attention layers (SAN-2)3. • Hierarchical Co-Attention Network
(HieCoAtt) (Lu et al., 2016) with word-level (HieCoAtt-W), phrase-level (HieCoAtt-P) and question-level (HieCoAtt-Q) attention maps; we evaluate all three maps4.
Comparison Metric: Rank Correlation. We first scale both the machine-generated and human atten-tion maps to 14x14, rank the pixels according to their spatial attention and then compute correlation between these two ranked lists. We choose an order-based metric so as to make the evaluation invariant to absolute spatial probability values which can be made peaky or diffuse by tweaking a ‘temperature’ parameter.
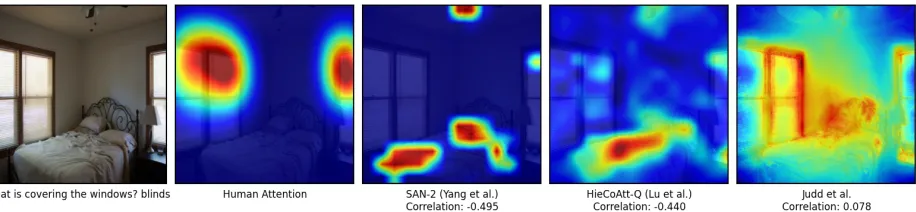
Table 1 shows rank-order correlation averaged over all image-question pairs on the validation set. We compare with random attention maps and task-independent saliency maps generated by a model trained to predict human eye fixation locations where subjects are asked to freely view an image for 3 seconds (Judd et al., 2009). Both SAN-2 and HieCoAtt attention maps are positively corre-lated with human attention maps, but not as strongly as task-independent Judd saliency maps. Our find-ings lead to two take-away messages with signifi-cant potential impact on future research in this ac-tive field. First, current VQA attention models do not seem to be ‘looking’ at the same regions as hu-mans to produce an answer. Second, as attention-based VQA models become more accurate (58.9% SAN→62.1%HieCoAtt), they seem to be (slightly) better correlated with humans in terms of where they
3https://github.com/zcyang/imageqa-san 4https://github.com/jiasenlu/
HieCoAttenVQA
Model Rank-correlation
SAN-2 (Yang et al., 2016) 0.249±0.004 HieCoAtt-W (Lu et al., 2016) 0.246±0.004 HieCoAtt-P (Lu et al., 2016) 0.256±0.004 HieCoAtt-Q (Lu et al., 2016) 0.264±0.004
Random 0.000±0.001
Judd et al. (Judd et al., 2009) 0.497±0.004
[image:4.612.315.536.282.380.2]Human 0.623±0.003
Table 1: Mean rank-correlation coefficients (higher is better); error bars show standard error of means. We can see that both SAN-2 and HieCoAtt attention maps are positively correlated with human attention maps, but not as strongly as task-independent Judd saliency maps.
Model Rank-correlation
SAN-2 (Yang et al., 2016) 0.038±0.011 HieCoAtt-W (Lu et al., 2016) 0.062±0.012 HieCoAtt-P (Lu et al., 2016) 0.048±0.010 HieCoAtt-Q (Lu et al., 2016) 0.114±0.012 Judd et al. (Judd et al., 2009) -0.063±0.009
Table 2: Correlation on the reduced set without cen-ter bias goes down significantly for Judd saliency since they have a strong center bias. Relative trends among SAN-2 & HieCoAtt are similar to those over the whole validation set (reported in Table 1).
cen-Figure 4: Random example of human attention (column 2) v/s machine-generated attention (columns 3-5)
ter bias still exists albeit not as severely as in eye-tracking. A potential source of center bias is the fact that the VQA dataset was human-generated by sub-jects looking at images. Thus, salient obsub-jects in the center of the image are likely to be potential subjects of questions. We compute rank-correlation of a syn-thetically generated central attention map with Judd saliency and human attention maps. Judd saliency maps have a mean rank-correlation of 0.877 and hu-man attention maps have a mean rank-correlation of 0.458 on the validation set.
To eliminate the effect of center bias in this evalua-tion, we removed human attention maps that have positive rank-correlation with the center attention map. We compute rank-correlation of machine-generated attention with human attention on this re-duced set. See Table 2. Mean correlation goes down significantly for Judd saliency maps since they have a strong center bias. Relative trends among SAN-2 & HieCoAtt are similar to those over the whole val-idation set (reported in Table 1). HieCoAtt-Q now has higher correlation with human attention maps than Judd saliency. Thus discounting the center bias, VQA-specific machine attention maps correlate bet-ter with VQA-specific human attention maps than task-independent machine saliency maps.
5 Conclusion & Discussion
We introduce and release the VQA-HAT dataset1.
This dataset can be used to evaluate attention maps generated in an unsupervised manner by attention-based VQA models, or to explicitly train models with attention supervision for VQA. We quantify whether current attention-based VQA models are ‘looking’ at the same regions of the image as humans do to produce an answer.
Necessary vs Sufficient Maps. Are human atten-tion maps ‘necessary’ and/or ‘sufficient’? If regions highlighted by the human attention maps are suffi-cient to answer the question accurately, then so is any region that is a superset. For example, if atten-tion mass is concentrated on a ‘cat’ for ‘What animal is present in the picture?’, then an attention map that assigns weights to any arbitrary-sized region that in-cludes the ‘cat’ is sufficient as well. On the contrary, a necessary and sufficient attention map would be the smallest visual region sufficient for answering the question accurately. It is an ill-posed problem to define a necessary attention map in the space of pix-els; random pixels can be blacked out and chances are that humans would still be able to answer the question given the resulting subset attention map. Our work thus poses an interesting question for fu-ture work – what is the rightsemanticspace in which it is meaningful to talk about necessary and suffi-cient attention maps for humans?
Acknowledgements
[image:5.612.80.538.56.162.2]References
[Andreas et al.2016] Jacob Andreas, Marcus Rohrbach, Trevor Darrell, and Dan Klein. 2016. Learning to com-pose neural networks for question answering. InNAACL HLT. 2
[Antol et al.2015] Stanislaw Antol, Aishwarya Agrawal, Jiasen Lu, Margaret Mitchell, Dhruv Batra, C. Lawrence Zitnick, and Devi Parikh. 2015. VQA: Visual Question Answering. InICCV. 2
[Ba et al.2015] Jimmy Lei Ba, Volodymyr Mnih, and Ko-ray Kavukcuoglu. 2015. Multiple Object Recognition With Visual Attention. InICLR. 1
[Bahdanau et al.2015] Dzmitry Bahdanau, Kyunghyun Cho, and Yoshua Bengio. 2015. Neural Machine Trans-lation by Jointly Learning to Align and Translate. In ICLR. 1
[Cho et al.2015] KyungHyun Cho, Aaron C. Courville, and Yoshua Bengio. 2015. Describing Multimedia Con-tent using AtCon-tention-based Encoder-Decoder Networks. volume abs/1507.01053. 1
[Deng et al.2015] Jia Deng, Jonathan Krause, Michael Stark, and Li Fei-Fei. 2015. Leveraging the Wisdom of the Crowd for Fine-Grained Recognition.PAMI. 3 [Devlin et al.2015] Jacob Devlin, Saurabh Gupta, Ross B.
Girshick, Margaret Mitchell, and C. Lawrence Zitnick. 2015. Exploring nearest neighbor approaches for image captioning. volume abs/1505.04467. 1
[Fei-Fei et al.2007] Li Fei-Fei, Asha Iyer, Christof Koch, and Pietro Perona. 2007. What do we perceive in a glance of a real-world scene? Journal of Vision, 7(1):10. 2
[Firat et al.2016] Orhan Firat, KyungHyun Cho, and Yoshua Bengio. 2016. Multi-way, multilingual neural machine translation with a shared attention mechanism. volume abs/1601.01073. 1
[Jia Deng and Jonathan Krause and Li Fei-Fei2013] Jia Deng and Jonathan Krause and Li Fei-Fei. 2013. Fine-Grained Crowdsourcing for Fine-Fine-Grained Recognition. InCVPR. 3
[Jiang et al.2014] Ming Jiang, Juan Xu, and Qi Zhao. 2014. Saliency in Crowd. InECCV. 2
[Jiang et al.2015] Ming Jiang, Shengsheng Huang, Juany-ong Duan, and Qi Zhao. 2015. Salicon: Saliency in con-text. InCVPR. 2, 3
[Judd et al.2009] Tilke Judd, Krista Ehinger, Fr´edo Du-rand, and Antonio Torralba. 2009. Learning to predict where humans look. InICCV. 2, 4
[Lin et al.2014] Tsung-Yi Lin, Michael Maire, Serge Be-longie, James Hays, Pietro Perona, Deva Ramanan, Piotr Dollr, and C. Lawrence Zitnick. 2014. Microsoft COCO: Common Objects in Context. InECCV. 2
[Lu et al.2016] Jiasen Lu, Jianwei Yang, Dhruv Batra, and Devi Parikh. 2016. Hierarchical Question-Image Co-Attention for Visual Question Answering. InNIPS. 1, 2, 4
[Mnih et al.2014] Volodymyr Mnih, Nicolas Heess, Alex Graves, and Koray Kavukcuoglu. 2014. Recurrent Mod-els of Visual Attention. InNIPS. 1
[Rensink2000] Ronald A. Rensink. 2000. The dynamic representation of scenes. Visual Cognition, 7(1-3):17– 42. 1
[Sermanet et al.2014] Pierre Sermanet, Andrea Frome, and Esteban Real. 2014. Attention for Fine-Grained Cat-egorization. volume abs/1412.7054. 1
[Tatler2007] Benjamin W. Tatler. 2007. The central fixa-tion bias in scene viewing: Selecting an optimal viewing position independently of motor biases and image feature distributions.Journal of Vision, 7(14):4. 2, 4
[von Ahn and Dabbish2004] Luis von Ahn and Laura Dabbish. 2004. Labeling images with a computer game. InCHI. 3
[Xiong et al.2016] Caiming Xiong, Stephen Merity, and Richard Socher. 2016. Dynamic memory networks for visual and textual question answering. InICML. 1 [Xu and Saenko2015] Huijuan Xu and Kate Saenko.
2015. Ask, attend and answer: Exploring question-guided spatial attention for visual question answering. volume abs/1511.05234. 1
[Xu et al.2015] Kelvin Xu, Jimmy Ba, Ryan Kiros, Kyunghyun Cho, Aaron C. Courville, Ruslan Salakhutdi-nov, Richard S. Zemel, and Yoshua Bengio. 2015. Show, Attend and Tell: Neural Image Caption Generation with Visual Attention. InICML. 1
[Yang et al.2016] Zichao Yang, Xiaodong He, Jianfeng Gao, Li Deng, and Alexander J. Smola. 2016. Stacked Attention Networks for Image Question Answering. In CVPR. 1, 2, 4