There’s No Comparison: Reference-less Evaluation Metrics
in Grammatical Error Correction
Courtney Napoles,1Keisuke Sakaguchi,1 and Joel Tetreault2 1Center for Language and Speech Processing, Johns Hopkins University
2Grammarly
{napoles,keisuke}@cs.jhu.edu, [email protected]
Abstract
Current methods for automatically evaluating grammatical error correction (GEC) systems rely on gold-standard references. However, these methods suffer from penalizing gram-matical edits that are correct but not in the gold standard. We show that reference-less grammaticality metrics correlate very strongly with human judgments and are competitive with the leading reference-based evaluation metrics. By interpolating both methods, we achieve state-of-the-art correlation with hu-man judgments. Finally, we show that GEC metrics are much more reliable when they are calculated at the sentence level instead of the corpus level. We have set up a CodaLab site for benchmarking GEC output using a com-mon dataset and different evaluation metrics.
1 Introduction
Grammatical error correction (GEC) has been evalu-ated by comparing the changes made by a system to the corrections made in gold-standard annotations. Following the recent shared tasks in this field (e.g., Ng et al. (2014)), several papers have critiqued GEC metrics and proposed new methods. Existing met-rics depend on gold-standard corrections and there-fore have a notable weakness: systems are penalized for making corrections that do not appear in the ref-erences.1 For example, the following output has low
metric scores even though three appropriate correc-tions were made to the input:
1We refer to the gold-standard corrections asreferences
be-causegold standardsuggests just one accurate correction.
However , people now can contact communicate
with anyonepeopleall over the world who can use computersat any time , and there is no time delay of messages .
These changes (in red) were not seen in the refer-ences and therefore the metrics GLEU and M2 (de-scribed in §2) score this output worse than 75% of 15,000 other generated sentences.
While grammaticality-based, reference-less met-rics have been effective in estimating the quality of machine translation (MT) output, the utility of such metrics has not been investigated previously for GEC. We hypothesize that such methods can over-come this weakness in reference-based GEC met-rics. This paper has four contributions: 1) We de-velop three grammaticality metrics that are com-petitive with current reference-based measures and correlate very strongly with human judgments. 2) We achieve state-of-the-art performance when in-terpolating a leading reference-based metric with a grammaticality metric. 3) We identify an interest-ing result that the mean of sentence-level scores is substantially better for evaluating systems than the system-level score. 4) We release code for two grammaticality metrics and establish an online plat-form for evaluating GEC output.
2 Prior work
To our knowledge, this is the first work to evalu-ate GEC without references. Within MT, this task is called quality estimation. MT output is evalu-ated by its fluency, or adherence to accepted con-ventions of grammaticality and style, andadequacy, which is the input’s meaning conveyed in the output.
Quality estimation targets fluency by estimating the amount of post-editing needed by the output. This has been the topic of recent shared tasks, e.g. Bojar et al. (2015). Specia et al. (2010) evaluated the qual-ity of translations using sentence-level features from the output but not the references, predicting discrete and continuous scores. A strong baseline, QuEst, uses support vector regression trained over 17 fea-tures extracted from the output (Specia et al., 2013). Most closely related to our work, Parton et al. (2011) applied features from Educational Testing Service’s e-raterR (Attali and Burstein, 2006) to evaluate MT output with a ranking SVM, without references, and improved performance by including features derived from MT metrics (BLEU, TERp, and METEOR).
Within the GEC field, recent shared tasks have prompted the development and scrutiny of new met-rics for evaluating GEC systems. The Helping Our Own shared tasks evaluated systems using precision, recall, and F-score against annotated gold-standard corrections (Dale and Kilgarriff, 2011; Dale et al., 2012). The subsequent CoNLL Shared Tasks on GEC (Ng et al., 2013; Ng et al., 2014) were scored with the MaxMatch metric (M2), which captures word- and phrase-level edits by calculating the F-score over an edit lattice (Dahlmeier and Ng, 2012). Felice and Briscoe (2015) identified shortcomings of M2and proposed I-measure to address these issues. I-measure computes the accuracy of a token-level alignment between the original, generated, and gold-standard sentences. These precision- and recall-based metrics measure fluency and adequacy by pe-nalizing inappropriate changes, which alter mean-ing or introduce other errors. Changes consistent with the annotations indicate improved fluency and no change in meaning.
Unlike these metrics, GLEU scores output by pe-nalizing n-grams found in the input and output but not the reference (Napoles et al., 2015). Like BLEU (Papineni et al., 2002), GLEU captures both fluency and adequacy with n-gram overlap. Recent work has shown that GLEU has the strongest correlation with human judgments compared to the GEC metrics de-scribed above (Sakaguchi et al., 2016). These GEC metrics are all defined at the corpus level, mean-ing that the statistics are accumulated over the en-tire output and then used to calculate a single system score.
3 Explicitly evaluating grammaticality
GLEU, I-measure, and M2 are calculated based on comparison to reference corrections. These Reference-Based Metrics (RBMs) credit corrections seen in the references and penalize systems for ig-noring errors and making bad changes (changing a span of text in an ungrammatical way or introduc-ing errors to grammatical text). However, RBMs make two strong assumptions: that the annotations in the references arecorrectand that they are com-plete. We argue that these assumptions are invalid and point to a deficit in current evaluation practices. In GEC, the agreement between raters can be low due to the challenging nature of the task (Bryant and Ng, 2015; Rozovskaya and Roth, 2010; Tetreault and Chodorow, 2008), indicating that annotations may not be correct or complete.
An exhaustive list of all possible corrections would be time-consuming, if not impossible. As a result, RBMs penalize output that has a valid correc-tion that is not present in the references or that ad-dresses an error not corrected in the references. The example in§1 has low GLEU and M2 scores, even though the output addresses two errors (GLEU=0.43 and M2= 0.00, in the bottom half and quartile of 15k system outputs, respectively).
To address these concerns, we propose three met-rics to evaluate the grammaticality of output without comparing to the input or a gold-standard sentence (Grammaticality-Based Metrics, orGBMs). We ex-pect GBMs to score sentences, such as our example in§1, more highly. The first two metrics are scored by counting the errors found by existing grammat-ical error detection tools. The error count score is simply calculated: 1− # tokens# errors. Two different tools are used to count errors: e-raterR’s grammatical error detection modules (ER) and Language Tool (Miłkowski, 2010) (LT). We choose these because, while e-raterR is a large-scale, robust tool that de-tects more errors than Language Tool,2 it is
propri-etary whereas Language Tool is publicly available and open sourced.
al. (2014).3 The LFM score is a ridge regression
over a variety of linguistic features related to gram-maticality, including the number of misspellings, language model scores, OOV counts, and PCFG and link grammar features. It has been shown to effec-tively assess the grammaticality of learner writing. LFM predicts a score for each sentence while ER and LT, like the RBMs, can be calculated with ei-ther sentence- or document-level statistics. To be consistent with LFM, for all metrics in this work we score each sentence individually and report the system score as the mean of the sentence scores. We discuss the effects of modifying metrics from a corpus-level to a sentence-level in§5.
Consistent with our hypothesis, ER and LT score the §1 example in the top quartile of outputs and LFM ranks it in the top half.
3.1 A hybrid metric
The obvious deficit of GBMs is that they do not mea-sure the adequacy of generated sentences, so they could easily be manipulated with grammatical out-put that is unrelated to the inout-put. An ideal GEC metric would measure both the grammaticality of a generated sentence and its meaning compared to the original sentence, and would not necessarily need references. The available data of scored system out-puts are insufficient for developing a new metric due to their limited size, thus we turn to interpolation to develop a sophisticated metric that jointly captures grammaticality and adequacy.
To harness the advantage of RBMs (adequacy) and GBMs (fluency), we build combined metrics, interpolating each RBM with each GBM. For a sen-tence of system output, the interpolated score (SI) of
the GBM score (SG) and RBM score (SR) is
com-puted as follows:
SI= (1−λ)SG+λSR
All values ofSGandSRare in the interval[0,1],
ex-cept for I-measure, which falls between[−1,1], and
the distribution varies for each metric.4 The system
score is the averageSIof all generated sentences.
3Our implementation is slightly modified in that it does not
use features from the PET HPSG parser.
4Mean scores are GLEU0.52
±0.21, M20.21
±0.34, IM
0.10±0.30, ER0.91±0.10, LFM0.50±0.16, LT1.00±0.01.
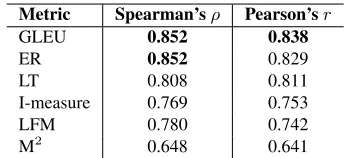
Metric Spearman’sρ Pearson’sr
GLEU 0.852 0.838
ER 0.852 0.829
LT 0.808 0.811
I-measure 0.769 0.753
LFM 0.780 0.742
[image:3.612.339.511.56.135.2]M2 0.648 0.641
Table 1: Correlation between the human and metric rankings.
4 Experiments
To assess the proposed metrics, we apply the RBMs, GBMs, and interpolated metrics to score the out-put of 12 systems participating in the CoNLL-2014 Shared Task on GEC (Ng et al., 2014). Recent works have evaluated RBMs by collecting human rankings of these system outputs and comparing them to the metric rankings (Grundkiewicz et al., 2015; Napoles et al., 2015). In this section, we compare each met-ric’s ranking to the human ranking of Grundkiewicz et al. (2015, Table 3c). We use 20 references for scoring with RBMs: 2 original references, 10 ref-erences collected by Bryant and Ng (2015), and 8 references collected by Sakaguchi et al. (2016). The motivations for using 20 references are twofold: the best GEC evaluation method uses these 20 ref-erences with the GLEU metric (Sakaguchi et al., 2016), and work in machine translation shows that more references are better for evaluation (Finch et al., 2004). Due to the low agreement discussed in§3, having more references can be beneficial for evalu-ating a system when there are multiple viable ways of correcting a sentence. Unlike previous GEC eval-uations, all metrics reported here use themeanof the sentence-level scores for each system.
Results are presented in Table 1. The error-count metrics, ER and LT, have stronger correlation than all RBMs except for GLEU, which is the current state of the art. GLEU has the strongest correlation with the human ranking (ρ= 0.852,r= 0.838), fol-lowed closely by ER, which has slightly lower Pear-son correlation (r = 0.829) but equally as strong
rank correlation, which is arguably more important when comparing different systems. I-measure and LFM have similar strength correlations, and M2 is the lowest performing metric, even though its corre-lation is still strong (ρ= 0.648,r= 0.641).
ranked by Spearman’s rank coefficient (ρ) ranked by Pearson’s correlation coefficient (r)
ER LFM LT ER LFM LT
no intrpl. 0.852 (0) 0.780 (0) 0.808 (0) no intrpl. 0.829 (0) 0.742 (0) 0.811 (0)
GLEU 0.852 (1) 0.885(0.03) 0.874 (0.27) 0.857 (0.04) 0.838 (1) 0.867(0.27) 0.845 (0.84) 0.867 (0.09)
I-m. 0.769 (1) 0.874 (0.19) 0.863 (0.37) 0.852 (0.01) 0.753 (1) 0.837 (0.02) 0.791 (0.22) 0.828 (0.01)
[image:4.612.74.541.57.128.2]M2 0.648 (1) 0.868 (0.01) 0.852 (0.05) 0.808 (0.00) 0.641 (1) 0.829 (0.00) 0.754 (0.04) 0.811 (0.00)
Table 2: Oracle correlations between interpolated metrics and the human rankings. Theλvalue for each metric is in parentheses.
GLEU Intrpl.
rank rank Output sentence
1 2 Genectic testing is a personal decision , with the knowledge that there is a possi-blitythat one could be a carrier or not . 2 3 Genectic testing is a personal decision ,
thekowledgethat there is apossiblitythat one could be a carrier or not .
[image:4.612.73.297.160.284.2]3 1 Genetic testing is a personal decision , with the knowledge that there is a possi-bility that one could be a carrier or not .
Table 3: An example of system outputs ranked by GLEU and GLEU interpolated with ER. Words in italics are misspelled.
[0,1] to find the oracle value. Table 2 shows the correlations between the human judgments and the oracle interpolated metrics. Correlations of interpo-lated metrics are the upper bound and the correla-tions of uninterpolated metrics (in the first column and first row) are the lower bound. Interpolating GLEU and IM with GBMs has stronger correlation than any uninterpolated metric (i.e. λ = 0 or 1), and the oracle interpolation of ER and GLEU mani-fests the strongest correlation with the human rank-ing (ρ = 0.885, r = 0.867).5 M2 has the weakest
correlation of all uninterpolated metrics and, when combined with GBMs, three of the interpolated met-rics have λ = 0, meaning the interpolated score is
equivalent to the GBM and M2does not contribute. Table 3 presents an example of how interpolation can help evaluation. The top two sentences ranked by GLEU have misspellings that were not corrected in the NUCLE references. Interpolating with a GBM rightly ranks the misspelled output below the cor-rected output.
Since these experiments use a large number of references (20), we determine how different refer-ence sizes affect the interpolated metrics by
system-5To verify that these metrics cannot be gamed, we
interpo-lated GBMs with RBMs scored against randomized references, and got scores 15% lower than un-gamed scores, on average.
0 5 10 15 20
Number of References
0.80 0.82 0.84 0.86 0.88
Sp
ea
rm
an
's
ρ
ER GLEU GLEU+ER
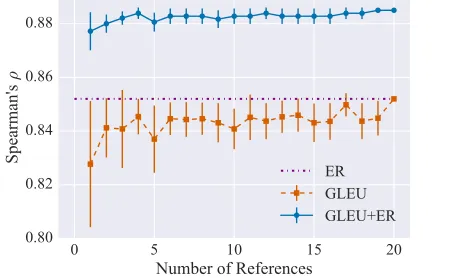
Figure 1: The mean correlation of oracle interpolated GLEU and ER scores across different reference sizes, compared to the uninterpolated metrics. Bars indicate a 95% confidence interval.
atically increasing the number of references from 1 to 20 and randomly choosingnreferences to use as
a gold standard when calculating the RBM scores, repeating 10 times for each valuen(Figure 1). The
correlation is nearly as strong with 3 and 20 refer-ences (ρ = 0.884v. 0.885), and interpolating with just 1 reference is nearly as good (0.878) and im-proves over any uninterpolated metric.
We acknowledge that using GBMs is in effect us-ing GEC systems to score other GEC systems. In-terestingly, we find that even if the GBMs are im-perfect, they still boost performance of the RBMs. GBMs have been trained to recognize errors in dif-ferent contexts and, conversely, can identify cor-rect grammatical constructions in diverse contexts, where the RBMs only recognize corrections made that appear in the gold standards, which are limited. Therefore GBMs can make a nice complement to shortcomings that RBMs may have.
5 Sentence-level evaluation
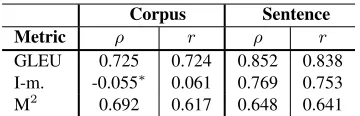
[image:4.612.318.545.161.300.2]Corpus Sentence
Metric ρ r ρ r
[image:5.612.95.275.56.114.2]GLEU 0.725 0.724 0.852 0.838 I-m. -0.055∗ 0.061 0.769 0.753 M2 0.692 0.617 0.648 0.641
Table 4: Correlation with human ranking when using corpus-and sentence-level metrics. ∗indicates a significant difference from the corresponding sentence-level correlation (p <0.05).7
mean sentence-level score (Table 4).6 Most
no-tably, I-measure does not correlate at all as a corpus-level metric but has a very strong correlation at the sentence-level (specifically,ρimproves from -0.055
to 0.769). This could be because corpus-level statis-tics equally distribute counts of correct annotations over all sentences, even those where the output ne-glects to make any necessary corrections. Sentence-level statistics would not average the correct counts over all sentences in this same way. As a result, a corpus-level statistic may over-estimate the qual-ity of system output. Deeper investigation into this phenomenon is needed to understand why the mean sentence-level scores do better.
6 Summary
We have identified a shortcoming of reference-based metrics: they penalize changes made that do not ap-pear in the references, even if those changes are ac-ceptable. To address this problem, we developed metrics to explicitly measure grammaticality with-out relying on reference corrections and showed that the error-count metrics are competitive with the best reference-based metric. Furthermore, by interpolat-ing RBMs with GBMs, the system rankinterpolat-ing has even stronger correlation with the human ranking. The ER metric, which was derived from counts of er-rors detected using e-raterR, is nearly as good as the state-of-the-art RBM (GLEU) and the interpo-lation of these metrics has the strongest reported correlation with the human ranking (ρ = 0.885,
r = 0.867). However, since e-raterR is not widely
available to researchers, we also tested a metric us-ing Language Tool, which does nearly as well when interpolated with GLEU (ρ= 0.857,r = 0.867).
6The correlations in Table 4 differ from what was reported in
Grundkiewicz et al. (2015) and Napoles et al. (2015) due to the references and sentence-level computation used in this work.
7Significance is found by applying a two-tailed t-test to the
Z-scores attained using Fisher’s z-transformation.
Two important points should be noted: First, due to the small sample size (12 system outputs), none of the rankings significantly differ from one another except for the corpus-level I-measure. Secondly, GLEU and the other RBMs already have strong to very strong correlation with the human judgments, which makes it difficult for any combination of met-rics to perform substantially higher. The best unin-terpolated and inunin-terpolated metrics use an extremely large number of references (20), however Figure 1 shows that interpolating GLEU using just one ref-erence has stronger correlation than any uninterpo-lated metric. This supports the use of interpolation to improve GEC evaluation in any setting.
This work is the first exploration into applying fluency-based metrics to GEC evaluation. We be-lieve that, for future work, fluency measures could be further improved with other methods, such as us-ing existus-ing GEC systems to detecterrors, or even using an ensemble of systems to improve coverage (indeed, ensembles have been useful in the GEC task itself (Susanto et al., 2014)). There is also recent work from the MT community, such as the use of confidence bounds (Graham and Liu, 2016) or un-certainty measurement (Beck et al., 2016), which could be adopted by the GEC community.
Finally, in the course of our experiments, we de-termined that metrics calculated on the sentence-level is more reliable for evaluating GEC output, and we suggest that the GEC community adopt this mod-ification to better assess systems.
To facilitate GEC evaluation, we have set up an online platform8for benchmarking system output on
the same set of sentences evaluated using different metrics and made the code for calculating LT and LFM available.9
Acknowledgments
We would like to thank Matt Post, Martin Chodorow, and the three anonymous reviews for their comments and feedback. We also thank Educational Testing Service for providing e-raterR output. This material is based upon work partially supported by the NSF GRF under Grant No. 1232825.
8https://competitions.codalab.org/
competitions/12731
9https://github.com/cnap/
References
Yigal Attali and Jill Burstein. 2006. Automated essay scoring with e-raterR v. 2. The Journal of Technology, Learning and Assessment, 4(3).
Daniel Beck, Lucia Specia, and Trevor Cohn. 2016. Exploring prediction uncertainty in machine transla-tion quality estimatransla-tion. In Proceedings of The 20th SIGNLL Conference on Computational Natural Lan-guage Learning, pages 208–218, Berlin, Germany, August. Association for Computational Linguistics. Ondˇrej Bojar, Christian Buck, Chris Callison-Burch,
Christian Federmann, Barry Haddow, Philipp Koehn, Christof Monz, Matt Post, Radu Soricut, and Lucia Specia. 2013. Findings of the 2013 Workshop on Statistical Machine Translation. InProceedings of the Eighth Workshop on Statistical Machine Translation, pages 1–44, Sofia, Bulgaria, August. Association for Computational Linguistics.
Ondˇrej Bojar, Christian Buck, Christian Federmann, Barry Haddow, Philipp Koehn, Johannes Leveling, Christof Monz, Pavel Pecina, Matt Post, Herve Saint-Amand, Radu Soricut, Lucia Specia, and Aleˇs Tam-chyna. 2014. Findings of the 2014 Workshop on Sta-tistical Machine Translation. In Proceedings of the Ninth Workshop on Statistical Machine Translation, pages 12–58, Baltimore, Maryland, USA, June. As-sociation for Computational Linguistics.
Ondˇrej Bojar, Rajen Chatterjee, Christian Federmann, Barry Haddow, Matthias Huck, Chris Hokamp, Philipp Koehn, Varvara Logacheva, Christof Monz, Matteo Negri, Matt Post, Carolina Scarton, Lucia Specia, and Marco Turchi. 2015. Findings of the 2015 Workshop on Statistical Machine Translation. InProceedings of the Tenth Workshop on Statistical Machine Transla-tion, pages 1–46, Lisbon, Portugal, September. Asso-ciation for Computational Linguistics.
Christopher Bryant and Hwee Tou Ng. 2015. How far are we from fully automatic high quality grammatical error correction? InProceedings of the 53rd Annual Meeting of the Association for Computational Linguis-tics and the 7th International Joint Conference on Nat-ural Language Processing (Volume 1: Long Papers), pages 697–707, Beijing, China, July. Association for Computational Linguistics.
Chris Callison-Burch, Philipp Koehn, Christof Monz, Matt Post, Radu Soricut, and Lucia Specia. 2012. Findings of the 2012 Workshop on Statistical Machine Translation. In Proceedings of the Seventh Work-shop on Statistical Machine Translation, pages 10– 51, Montr´eal, Canada, June. Association for Compu-tational Linguistics.
Daniel Dahlmeier and Hwee Tou Ng. 2012. Better evaluation for grammatical error correction. In
Pro-ceedings of the 2012 Conference of the North Ameri-can Chapter of the Association for Computational Lin-guistics: Human Language Technologies, pages 568– 572, Montr´eal, Canada, June. Association for Compu-tational Linguistics.
Robert Dale and Adam Kilgarriff. 2011. Helping our own: The HOO 2011 pilot shared task. InProceedings of the Generation Challenges Session at the 13th Eu-ropean Workshop on Natural Language Generation, pages 242–249, Nancy, France, September. Associa-tion for ComputaAssocia-tional Linguistics.
Robert Dale, Ilya Anisimoff, and George Narroway. 2012. HOO 2012: A report on the preposition and determiner error correction shared task. In Proceed-ings of the Seventh Workshop on Building Educational Applications Using NLP, pages 54–62, Montr´eal, Canada, June. Association for Computational Linguis-tics.
Mariano Felice and Ted Briscoe. 2015. Towards a standard evaluation method for grammatical error de-tection and correction. In Proceedings of the 2015 Conference of the North American Chapter of the As-sociation for Computational Linguistics, pages 578– 587, Denver, Colorado, June. Association for Compu-tational Linguistics.
Andrew M. Finch, Yasuhiro Akiba, and Eiichiro Sumita. 2004. How does automatic machine translation eval-uation correlate with human scoring as the number of reference translations increases? In Proceedings of the Fourth International Conference on Language Resources and Evaluation, LREC 2004, May 26-28, 2004, Lisbon, Portugal.
Yvette Graham and Qun Liu. 2016. Achieving accurate conclusions in evaluation of automatic machine trans-lation metrics. InProceedings of the 2016 Conference of the North American Chapter of the Association for Computational Linguistics: Human Language Tech-nologies, pages 1–10, San Diego, California, June. As-sociation for Computational Linguistics.
Roman Grundkiewicz, Marcin Junczys-Dowmunt, and Edward Gillian. 2015. Human evaluation of gram-matical error correction systems. In Proceedings of the 2015 Conference on Empirical Methods in Natural Language Processing, pages 461–470, Lisbon, Portu-gal, September. Association for Computational Lin-guistics.
Marcin Miłkowski. 2010. Developing an open-source, rule-based proofreading tool. Software: Practice and Experience, 40(7):543–566.
Courtney Napoles, Keisuke Sakaguchi, Matt Post, and Joel Tetreault. 2015. Ground truth for grammatical error correction metrics. In Proceedings of the 53rd Annual Meeting of the Association for Computational Linguistics and the 7th International Joint Conference on Natural Language Processing (Volume 2: Short Pa-pers), pages 588–593, Beijing, China, July. Associa-tion for ComputaAssocia-tional Linguistics.
Hwee Tou Ng, Siew Mei Wu, Yuanbin Wu, Christian Hadiwinoto, and Joel Tetreault. 2013. The CoNLL-2013 Shared Task on grammatical error correction. In
Proceedings of the Seventeenth Conference on Com-putational Natural Language Learning: Shared Task, pages 1–12, Sofia, Bulgaria, August. Association for Computational Linguistics.
Hwee Tou Ng, Siew Mei Wu, Ted Briscoe, Christian Hadiwinoto, Raymond Hendy Susanto, and Christo-pher Bryant. 2014. The CoNLL-2014 Shared Task on grammatical error correction. In Proceedings of the Eighteenth Conference on Computational Natural Language Learning: Shared Task, pages 1–14, Balti-more, Maryland, June. Association for Computational Linguistics.
Kishore Papineni, Salim Roukos, Todd Ward, and Wei-Jing Zhu. 2002. BLEU: a method for automatic eval-uation of machine translation. InProceedings of 40th Annual Meeting of the Association for Computational Linguistics, pages 311–318, Philadelphia, Pennsylva-nia, USA, July. Association for Computational Lin-guistics.
Kristen Parton, Joel Tetreault, Nitin Madnani, and Mar-tin Chodorow. 2011. E-raMar-ting machine translation. In Proceedings of the Sixth Workshop on Statistical Machine Translation, pages 108–115. Association for Computational Linguistics.
Alla Rozovskaya and Dan Roth. 2010. Annotating ESL errors: Challenges and rewards. InProceedings of the NAACL HLT 2010 Fifth Workshop on Innovative Use of NLP for Building Educational Applications, pages 28–36, Los Angeles, California, June. Association for Computational Linguistics.
Keisuke Sakaguchi, Courtney Napoles, Matt Post, and Joel Tetreault. 2016. Reassessing the goals of gram-matical error correction: Fluency instead of grammat-icality. Transactions of the Association for Computa-tional Linguistics, 4:169–182.
Lucia Specia, Dhwaj Raj, and Marco Turchi. 2010. Ma-chine translation evaluation versus quality estimation.
Machine translation, 24(1):39–50.
Lucia Specia, Kashif Shah, Jose G.C. de Souza, and Trevor Cohn. 2013. QuEst – a translation quality
esti-mation framework. InProceedings of the 51st Annual Meeting of the Association for Computational Linguis-tics: System Demonstrations, pages 79–84, Sofia, Bul-garia, August. Association for Computational Linguis-tics.
Raymond Hendy Susanto, Peter Phandi, and Hwee Tou Ng. 2014. System combination for grammatical er-ror correction. InProceedings of the 2014 Conference on Empirical Methods in Natural Language Process-ing (EMNLP), pages 951–962, Doha, Qatar, October. Association for Computational Linguistics.