Circulating levels of Dickkopf-1, Osteoprotegerin and
sclerostin are higher in old compared with young men and
women and positively associated with whole-body bone
mineral density in older adults
COULSON, J, BAGLEY, L, BARNOUIN, Y, BRADBURN, S, BUTLER-BROWNE, G, GAPEYEVA, H, HOGREL, J-Y, MADEN-WILKINSON, Tom <http://orcid.org/0000-0002-6191-045X>, MAIER, A B, MESKERS, C, MURGATROYD, C, NARICI, M, PAASUKE, M, SASSANO, L, SIPILA, S, SHANTI, A L, STENROTH, L, JONES, D A and MCPHEE, J S
Available from Sheffield Hallam University Research Archive (SHURA) at:
http://shura.shu.ac.uk/16149/
This document is the author deposited version. You are advised to consult the publisher's version if you wish to cite from it.
Published version
COULSON, J, BAGLEY, L, BARNOUIN, Y, BRADBURN, S, BUTLER-BROWNE, G, GAPEYEVA, H, HOGREL, J-Y, MADEN-WILKINSON, Tom, MAIER, A B, MESKERS, C, MURGATROYD, C, NARICI, M, PAASUKE, M, SASSANO, L, SIPILA, S, SHANTI, A L, STENROTH, L, JONES, D A and MCPHEE, J S (2017). Circulating levels of Dickkopf-1, Osteoprotegerin and sclerostin are higher in old compared with young men and women and positively associated with whole-body bone mineral density in older adults. Osteoporosis International, 28 (9), 2683-2689.
Copyright and re-use policy
Circulating levels of Dickkopf-1, Osteoprotegerin and sclerostin are higher in
1
old compared with young men and women and positively associated with
2
whole-body bone mineral density in older adults
3
Jessica Coulson1; Liam Bagley1; Yoann Barnouin1,2; Steven Bradburn1; Gillian Butler-Browne3;
4
Helena Gapeyeva4; Jean-Yves Hogrel3; Thomas Maden-Wilkinson5; Andrea B. Maier6,7; Carel
5
Meskers8; Chris Murgatroyd1; Marco Narici9; Mati Pääsuke4; Lorraine Sassano10; Sarianna
6
Sipilä11; Nasser AL-Shanti1 ; Lauri Stenroth11,12, David A Jones1 and Jamie S McPhee1*
7
Affiliations
8
1
School of Healthcare Science, Manchester Metropolitan University, UK
9
2
Baylor College of Medicine, Houston, Texas, USA
10
3
Institut de Myologie, GH Pitié-Salpêtrière, Paris, France
11
4
Institute of Sport Sciences and Physiotherapy, University of Tartu, Tartu, Estonia
12
5
School of Physical Activity and Health, Sheffield Hallam University, Sheffield, UK
13
6
Department of Human Movement Sciences, MOVE Research Institute, Vrij University,
14
Amsterdam, The Netherlands
15
7
Department of Medicine and Aged Care, The Royal Melbourne Hospital, University of
16
Melbourne, Melbourne, Australia
17
8VU University Medical Center, Rehabilitation Medicine, Amsterdam, The Netherlands
18
9Graduate Entry Medicine and Health, University of Nottingham, Nottingham, UK
19
10
Unilever Discover, Colworth Park, Sharnbrook, Bedford, UK
20
11Gerontology Research Center, Department of Health Sciences, University of Jyväskylä,
21
Finland
22
12 Department of Applied Physics, University of Eastern Finland, Kuopio, Finland.
23
24
*Corresponding author. Dr Jamie S McPhee, School of Healthcare Science, Manchester
25
Metropolitan University, John Dalton Building, Chester Street, Manchester, M15GD. UK.
26
J.s.mcphee@mmu.ac.uk.
1
Key words: Myoage, osteoporosis, sclerostin, DKK1, osteoprotegerin.
2
Authors declare no conflicts of interest.
3
4
Summary
5
Bone mineral density declines with increasing older age. We examined the levels of
6
circulating factors known to regulate bone metabolism in healthy young and older adults.
7
The circulating levels of dickkopf-1, osteocalcin, osteoprotegerin and sclerostin were
8
positively associated with WBMD in older adults, despite the average WBMD being lower
9
and circulating dickkopf-1, osteoprotegerin and sclerostin being higher in old than young.
10
Abstract
1
Purpose: To investigate the relationship between whole-body bone mineral density
2
(WBMD) and levels of circulating factors with known roles in bone remodelling during
3
‘healthy’ ageing.
4
Methods: WBMD and fasting plasma concentrations of dickkopf-1, fibroblast growth
factor-5
23, osteocalcin, osteoprotegerin, osteopontin and sclerostin were measured in 272 older
6
subjects (69 to 81 years; 52% female) and 171 younger subjects (18-30 years; 53% female).
7
Results: WBMD was lower in old than young. Circulating osteocalcin was lower in old
8
compared with young, while dickkopf-1, osteoprotegerin and sclerostin were higher in old
9
compared with young. These circulating factors were each positively associated with
10
WBMD in the older adults and the relationships remained after adjustment for covariates
(r-11
values ranging from 0.174 to 0.254, all p<0.01). In multivariate regression, the body mass
12
index, circulating sclerostin and whole-body lean mass together accounted for 13.8% of the
13
variation with WBMD in the older adults. In young adults, dickkopf-1 and body mass index
14
together accounted for 7.7% of variation in WBMD.
15
Conclusion: Circulating levels of dickkopf-1, osteocalcin, osteoprotegerin and sclerostin are
16
positively associated with WBMD in community-dwelling older adults, despite the average
17
WBMD being lower and circulating dickkopf-1, osteoprotegerin and sclerostin being higher
18
in old than young.
19
20
Introduction
1
Progressive loss of bone mineral density (BMD) in older age leads to osteoporosis as the
2
balance of bone remodelling favours resorption of mineralised extracellular matrix over
3
formation. This common change is characterized by ‘micro-architectural’ deterioration of
4
bone tissue and increases the risk of fracture [1]. Circulating factors influencing bone
5
development have been implicated in the age-related changes to BMD. This includes
6
regulatory factors released from osteoblasts and osteocytes involved in bone formation and
7
from osteoclasts with bone resorption, which can enter the circulation where their
8
concentrations may be related to BMD in older age.
9
Some of the candidate circulating factors possibly related to BMD include osteoprotegerin
10
(OPG), which is expressed by osteocytes and osteoblasts and can reduce production of
11
osteoclasts by binding receptor activator of nuclear factor kappa-B ligand (RANKL) [2].
12
Osteocalcin (OC) is a major non-collagen protein of the bone matrix secreted by osteoblasts
13
for bone formation, but released from the matrix during bone resorption [3].Dickkopf-1
14
(DKK1) [4] and sclerostin, released primarily by osteocytes [5], negatively regulate bone
15
formation and have emerged as therapeutic targets to tackle osteoporosis [6]. Fibroblast
16
growth factor 23 (FGF23) is produced by a variety of cell types, including osteoblasts and
17
osteocytes, and released into the circulation where it acts on the kidney to increase
18
excretion of phosphate and reduce production of 1-25 OH Vitamin D [7]. Osteopontin (OPN)
19
is an extracellular matrix protein released by osteoblasts, osteocytes and osteoclasts to
20
facilitate bone resorption [8].
21
It remains unclear how the combination of these circulating markers of bone turnover are
22
related to BMD in older age. Therefore, the purpose of this study was to compare plasma
23
concentrations of these markers between recreationally active, community dwelling older
24
adults and a reference group of young adults, and to examine the association of these with
25
whole-body bone mineral density (WBMD). It was hypothesised that older adults would
26
have higher circulating levels of factors related to bone resorption compared with young,
27
and higher circulating markers of bone resorption were expected to be associated with
28
lower BMD in old age.
29
Materials and Methods
1
Study Design
2
The cross-sectional European multi-centre MYOAGE cohort consists of relatively healthy
3
older men and women (aged 69 to 81 years) and young adults (aged 18-30 years) [9]. The
4
study was approved by ethics committees at each institute and written informed consent
5
was obtained from all participants. Participants were recruited by advertisement in
6
newspapers, the University of the Third Age and Association of Emerti. All measurements
7
were performed according to standard operating procedures that had been unified at the
8
study centres and data collection was ceased through December-March and July-August.
9
Volunteers were excluded if: dependent living, unable to walk a distance of 250 m, presence
10
of morbidity (such as neurologic disorders, metabolic diseases, rheumatic diseases, heart
11
failure, severe chronic obstructive pulmonary disease and hemocoagulative syndromes),
12
immobilization for one week during the last three months and orthopaedic surgery during
13
the last two years or still causing pain or functional limitations. The inclusion and exclusion
14
criteria were designed to ensure the selection of relatively healthy participants and to
15
minimize the confounding effect of comorbidity on sarcopenia [9] and we recorded the use
16
of bisphosphonates, calcium and vitamin D supplements. The present study included 443
17
participants (Leiden, The Netherlands (young; n=35, old; n=75); Jyvaskyla, Finland (young;
18
n=34, old; n=65); Tartu, Estonia (young; n=39, old; n=60), Paris, France (young; n=35, old;
19
n=30) and Manchester, UK (young; n=28, old; n=42)) with complete BMD and bloods results.
20
21
Dual-energy X-ray absorptiometry
22
A whole body scan was performed using DXA while the participants lay supine, as previously
23
reported [9] (The Netherlands: Hologic QDR 4500, version 12.4, Hologic Inc., Bedford, MA,
24
USA; Finland: Lunar Prodigy, version en-Core 9.30; Estonia: Lunar Prodigy Advanced, version
25
en-Core 10.51.006; France: Lunar Prodigy, version encore 12.30; United Kingdom: Lunar
26
Prodigy Advance, version enCore 10.50.086). A trained technician completed the daily
27
equipment calibration and the DXA scans according to local and manufacturers’ quality
28
control procedures. Participants wore a light cotton garment to reduce effects of clothing
29
absorption on the scanning results. The whole-body lean mass, fat mass and the WBMD
30
were recorded after manual adjustment of the regions of interest carried out offline.
1
Blood sample analysis
2
Blood samples were collected from a vein in the forearm into vacutainer EDTA tubes in the
3
morning when participants were in a fasted state. Samples remained at room temperature
4
for 15-30 min and were then centrifuged for 15 min at 2,000 *g at 4◦ C. The plasma was
5
collected and stored at -80◦C until analysis. Plasma concentrations of the selected analytes
6
were determined in the research laboratory in Manchester, UK, using multiplex
7
immunoassays (Millipore, Billerica, MA, USA). The manufacturer instructions were followed
8
and the magnetic bead panels quantified DKK1, OPG, OC, OPN, sclerostin and FGF23 using a
9
96-well plate after an overnight incubation. The sensitivity of each analyte was 1.4 (DKK1),
10
1.9 (OPG), 68.5 (OC), 37.7 (OPN), 31.1 (sclerostin) and 9.2 (FGF23) pg/mL. Samples were
11
processed using a Luminex 200 Bioanalyser and protein concentrations were estimated
12
using the xPONENT software (Luminex, v.3.1.871).
13
14
Statistical analysis
15
Participant descriptive characteristics (Table 1) were normally distributed and are presented
16
as mean ± standard error of the mean (SEM). Comparisons between age and gender were
17
assessed using multivariate ANOVA. Relationships between body stature, BMI, total body
18
lean mass and supplement use (independent variables) with WBMD (dependent variable)
19
were assessed using bivariate Pearson’s product moment correlation. Data for circulating
20
factors were not normally distributed and are presented as median (25th/75th) centiles. The
21
results were log-transformed and z-scores calculated by expressing each log-transformed
22
value as a standard deviation from the mean of the gender-matched young. Z-scores of
23
WBMD, lean mass and BMI were also calculated for use in subsequent correlation and
24
regression analysis. Spearman’s rho partial correlations were performed to assess
25
relationships between the z-score WBMD with z-scores of circulating factors using two
26
models. The first model included adjustment for country of testing to account for any
27
systematic differences. The second accounted for the positive correlations we observed
28
between WBMD and BMI in men and women (r-values ranging from 0.210 – 0.387) and
29
WBMD and lean mass for men (r-values in men ranging from 0.268 – 0.357, and women
30
0.085 – 0.099) as well as health status and use of bisphosphonates, calcium or vitamin D
supplements. Thus, the second model included adjustments for: country of testing, z-score
1
of lean mass, z-score of BMI, self-reported health and supplement use. A stepwise multiple
2
linear regression using the self-reported health and supplement use as well as z-scores for
3
BMI, lean mass and circulating factors was then used to evaluate which combination of the
4
independent variables was associated with z-score WBMD (dependent variable) in older
5
adults and in young adults. Data was analysed using SPSS for Windows (v.21; IBM, USA) and
6
significance accepted as p<0.05.
7
8
Results
9
Based on z-scores relative to gender-matched young, 26% of the older participants had
10
WBMD values between -1.5 to -2.49 below the mean for young and 10.6% were ≥ -2.5
11
below the mean of young. There was a significant age-by-gender interaction for WBMD
z-12
scores (p<0.0005).
13
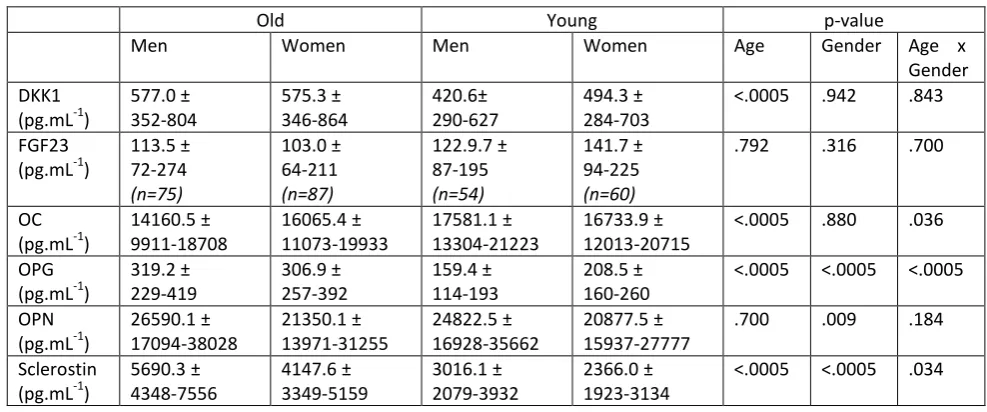
Table 2 shows concentrations of the circulating factors. Compared with young, older
14
participants had higher concentrations of DKK1, OPG and sclerostin. Concentrations of OC
15
were significantly lower in old compared with young. OPN and FGF23 did not differ
16
significantly between young and older participants although this was after removal of 37%
17
of FGF23 samples [similar proportions of young and old] that fell below the level of assay
18
detection. Compared with men, women had higher circulating concentrations of OPG, but
19
lower OPN and sclerostin. There were no significant differences between men and women
20
for DKK1, FGF23 and OC. Age x gender interactions were found for OC, OPG and sclerostin
21
(all p<0.05): the difference between young and old in OC, OPG and sclerostin was greater for
22
men than it was for women.
23
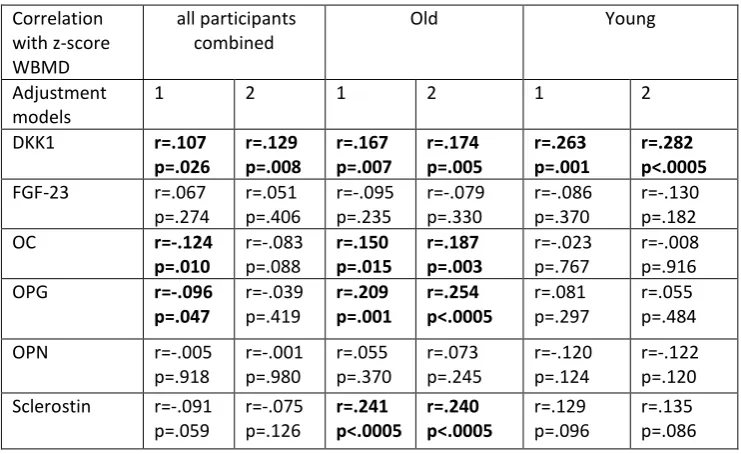
Table 3 shows the associations between circulating bone regulatory factors and WBMD.
24
When using z-scores of all variables and including all participants, while adjusting for
25
country, WBMD was positively associated with DKK1. This association remained significant
26
after additionally adjusting for lean mass, BMI, self-reported health and supplement use. In
27
older participants only, DKK1, OC, OPG and sclerostin were positively associated with
28
WBMD after adjusting for country. This remained the case when additionally adjusting for
29
lean mass, BMI, self-reported health and supplement use. In younger participants only,
DKK1 was positively associated with WBMD after adjusting for country as well as when
1
additionally adjusting for lean mass, BMI, self-reported health and supplement use.
2
Stepwise multiple linear regression was performed including z-score WBMD as the
3
dependent variable and independent variables included: self-reported health, supplement
4
use and z-scores of the variables BMI and lean mass, as well as the z-scores derived from
5
log-transformed data for DKK1, FGF23, OC, OPG, OPN and sclerostin. Results in the young
6
showed DKK1 accounted for 5.1% of the variation in WBMD (adjusted r2=0.051, p=0.010),
7
while DKK1 and BMI accounted for 7.7% of the variation in WBMD (adjusted r2=0.077,
8
p=0.005). In the old, BMI alone accounted for 8.9% of the variation in WBMD (adjusted
9
r2=0.089, p<0.0005); BMI and sclerostin together accounted for 12.0% of the variation in
10
WBMD (adjusted r2=0.120, p<0.0005), while BMI, sclerostin and whole body lean mass
11
accounted for 13.8% of the variation in WBMD (adjusted r2=0.138, p<0.0005).
12
13
14
Discussion
15
The results of this study showed that circulating factors DKK1, OPG and sclerostin were each
16
higher in old compared with young, but positively associated with WBMD in older adults.
17
Circulating OC was lower in old compared with young and positively associated with WBMD.
18
In multivariate regression, BMI, circulating sclerostin and whole-body lean mass together
19
accounted for 13.8% of the variation with WBMD in the older adults. In young, DKK1 and
20
BMI together accounted for 7.7% of variation in WBMD.
21
Circulating factors associated with whole-body BMD
22
Five out of the six circulating factors differed in concentration between old and young (Table
23
2). Of those, DKK1, OC, OPG and sclerostin were identified from both partial correlation
24
models as associated with WBMD in older participants (Table 3).
25
Sclerostin and DKK1 are released primarily by osteocytes and inhibit bone formation by
26
blocking the osteoblast Wnt/β-canenin signalling pathway [4, 10], with sclerostin and DKK1
27
alsostimulating bone resorption through RANKL [11]. Down-regulation of sclerostin [6] and
28
DKK1 [4, 6] is associated with markedly increased bone formation. For these reasons, an
inverse association between circulating sclerostin and DKK1 with WBMD would be expected,
1
but is not entirely what was observed. In line with expectations, our results revealed, on
2
average, a 1.8 fold higher circulating sclerostin and approximately 1.2-fold higher DKK1 in
3
old compared with young, which is consistent with an inverse association between
4
sclerostin and BMD in older age [12] and with results from a small sample of 36 patients
5
showing an inverse association between DKK1 and lumbar and femur BMD [13]. However,
6
contrary to expectations, the circulating levels of sclerostin and DKK1 were positively
7
associated with WBMD in the older participants (Table 3). Similar positive associations
8
between circulating sclerostin with BMD and bone micro-architecture in old age has been
9
previously reported [14-17].
10
Similar to the findings for sclerostin and DKK1, a paradoxical relationship existed for OPG
11
and WBMD in older adults: we found higher circulating OPG in old compared with young
12
(Table 2), but circulating OPG was positively associated with WBMD (Table 3). OPG released
13
by osteocytes and osteoblasts promotes bone formation. It has been shown to protect
14
against generalised bone resorption by blocking TNFα in models of chronic inflammation
15
[18] and is considered to be a decoy receptor for RANKL to reduce osteoclast-driven bone
16
resorption [19]. There are conflicting reports about the direction of association between
17
circulating OPG and BMD. A study of postmenopausal women of mean age 62 years [20],
18
and a study of middle aged men [21] reported inverse relationships between BMD and OPG,
19
while others reported no relationship [22, 23]. Conversely, and in line with the results of the
20
present work, when adults in their eighth and ninth decades of life were included in the
21
sample population the relationship between OPG and BMD was positive [24, 25]. These
22
conflicting results cannot be explained by the differences between studies in skeletal site
23
examined. Conflicting results may be related to the differences in the age range of the study
24
samples and possible gender differences. Our results for OPG and sclerostin showed
25
significant age x gender interactions indicating that the differences between young and
26
older men were greater than those between young and older women (Table 2). It is already
27
known that sex hormones can regulate bone turnover and may interact with these
28
circulating factors [26].
29
It is not clear why circulating sclerostin, DKK1 and OPG were positively associated with
30
WBMD in older age, despite the conflicting overall trend for higher circulating levels and
lower WBMD in the old. One possibility is that the older, but healthy mature osteocytes
1
generally release higher absolute levels of sclerostin, DKK1 and OPG into the circulation [27]
2
[28]. For example, a positive correlation was found for circulating sclerostin with trabecular
3
density, number and thickness in older men [14, 27], suggesting the more advanced
4
trabecular resorption in osteoporotic bone leaves fewer mature osteocytes and thus, lower
5
sclerostin release than healthy older bone. However, analysis of bone biopsies showed
6
similar sclerostin mRNA levels in young and old despite higher circulating sclerostin levels in
7
the old [12] which indicates that the age-related differences in circulating sclerostin may not
8
be due to increased osteocyte sclerostin gene expression, although this does not necessarily
9
equal protein production [29].
10
Lower circulating OC was found in old compared with young (Table 2) and, consistent with
11
this, circulating OC levels were positively correlated with WBMD in the old (Table 3). OC
12
released by osteoblasts plays a role in bone formation, so the positive correlation with
13
WBMD may be expected. However, others suggest that higher circulating OC indicates
14
greater rates of bone resorption because fragments or whole OC protein is released into the
15
circulation during bone resorption [3]. A previous study of young and middle-aged women
16
suggested that circulating levels peaked soon after menopause and dropped thereafter,
17
although levels were higher in those with osteoporosis than those without [30].
18
Interestingly, our results also showed a positive association between DKK1 and WBMD in
19
the young adults from univariate and multivariate analyses. This association may be a
20
reflection of the numbers of mature osteocytes or related to total bone mass, but more
21
work is needed to confirm. One previous study of children and adolescents did not find any
22
association between circulating DKK1 and BMD, but the young included in that study of
23
youths were in stages of rapid developmental growth, which could present different results
24
from the steady- state of young adults [31].
25
26
Strengths and limitations
27
The MYOAGE study included young and older participants relatively free from
lifestyle-28
related comorbidities for their age and the results are therefore indicative of age-related
29
effects. Nevertheless, the associations identified in this cross-sectional study cannot be
30
interpreted as causal relationships despite the clear roles for the selected circulating
markers in bone remodelling. The results for FGF23 showed no significant age- or
gender-1
differences, nor correlations with WBMD, but a large proportion of the results were below
2
the level of assay sensitivity, so firm conclusions cannot be drawn for this analyte. We have
3
measured the circulating levels of markers, which may be influenced by release from
non-4
bone cells, so it is not possible to determine the originating cell type. It is possible that
5
altered renal function can affect the levels of the circulating factors, but markers of renal
6
function was not included in the present study due to limitation of plasma sample quantity.
7
A phantom was not used to calibrate the DXA scanners across sites and we did not adjust
8
the results to derive “standardised” DXA values, as others have done for hip and femur sites
9
[32]. Instead, all study centres followed the local quality control procedures, including use of
10
phantoms and daily calibration and the results were adjusted for country of testing to
11
account for possible systematic differences.
12
Future studies should determine the reasons for the positive relationship between
13
circulating sclerostin, DKK1 and OPG with BMD in older adults, despite the old having on
14
average higher circulating levels of these factors and lower WBMD.
15
Conclusion
16
Sclerostin, DKK1, OPG and OC were each positively associated with WBMD in older adults,
17
despite the average WBMD being lower and circulating DKK1, OPG and sclerostin being
18
higher in old than young. Multiple linear regression identified BMI, circulating sclerostin and
19
whole-body lean mass as explaining approximately 14% of all variation on WBMD amongst
20
older adults.
21
22
Acknowledgments
23
This project was supported by funding from European Union FP7 (“MYOAGE”: #223576) and
24
Medical Research Council (MR/K025252/1).
25
TABLES
1
[image:13.595.58.451.136.430.2]2
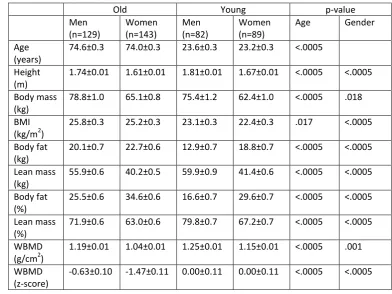
Table 1. Participant descriptive characteristics.
3
Old Young p-value
Men (n=129)
Women (n=143)
Men (n=82)
Women (n=89)
Age Gender
Age (years)
74.6±0.3 74.0±0.3 23.6±0.3 23.2±0.3 <.0005
Height (m)
1.74±0.01 1.61±0.01 1.81±0.01 1.67±0.01 <.0005 <.0005
Body mass (kg)
78.8±1.0 65.1±0.8 75.4±1.2 62.4±1.0 <.0005 .018
BMI (kg/m2)
25.8±0.3 25.2±0.3 23.1±0.3 22.4±0.3 .017 <.0005
Body fat (kg)
20.1±0.7 22.7±0.6 12.9±0.7 18.8±0.7 <.0005 <.0005
Lean mass (kg)
55.9±0.6 40.2±0.5 59.9±0.9 41.4±0.6 <.0005 <.0005
Body fat (%)
25.5±0.6 34.6±0.6 16.6±0.7 29.6±0.7 <.0005 <.0005
Lean mass (%)
71.9±0.6 63.0±0.6 79.8±0.7 67.2±0.7 <.0005 <.0005
WBMD (g/cm2)
1.19±0.01 1.04±0.01 1.25±0.01 1.15±0.01 <.0005 .001
WBMD (z-score)
-0.63±0.10 -1.47±0.11 0.00±0.11 0.00±0.11 <.0005 <.0005
4
Values are mean ± SEM. WBMD: whole-body bone mineral density. 5
Table 2. Circulating markers of bone remodelling in old and young, men and women.
1
Old Young p-value
Men Women Men Women Age Gender Age x
Gender DKK1
(pg.mL-1)
577.0 ± 352-804
575.3 ± 346-864
420.6± 290-627
494.3 ± 284-703
<.0005 .942 .843
FGF23 (pg.mL-1)
113.5 ± 72-274
(n=75)
103.0 ± 64-211
(n=87)
122.9.7 ± 87-195
(n=54)
141.7 ± 94-225
(n=60)
.792 .316 .700
OC (pg.mL-1)
14160.5 ± 9911-18708
16065.4 ± 11073-19933
17581.1 ± 13304-21223
16733.9 ± 12013-20715
<.0005 .880 .036
OPG (pg.mL-1)
319.2 ± 229-419
306.9 ± 257-392
159.4 ± 114-193
208.5 ± 160-260
<.0005 <.0005 <.0005
OPN (pg.mL-1)
26590.1 ± 17094-38028
21350.1 ± 13971-31255
24822.5 ± 16928-35662
20877.5 ± 15937-27777
.700 .009 .184
Sclerostin (pg.mL-1)
5690.3 ± 4348-7556
4147.6 ± 3349-5159
3016.1 ± 2079-3932
2366.0 ± 1923-3134
<.0005 <.0005 .034
2
Values are median ± 25th – 75th percentiles. For FGF23, the n is less than those given in Table 1 due to some 3
samples having values that were below the level of detection. The n for all other analytes is the same as shown 4
in Table 1. 5
6
Table 3. Associations between circulating bone regulatory factors and whole body bone mineral density. 1 Correlation with z-score WBMD all participants combined
Old Young
Adjustment models
1 2 1 2 1 2
DKK1 r=.107
p=.026 r=.129 p=.008 r=.167 p=.007 r=.174 p=.005 r=.263 p=.001 r=.282 p<.0005
FGF-23 r=.067
p=.274 r=.051 p=.406 r=-.095 p=.235 r=-.079 p=.330 r=-.086 p=.370 r=-.130 p=.182
OC r=-.124
p=.010 r=-.083 p=.088 r=.150 p=.015 r=.187 p=.003 r=-.023 p=.767 r=-.008 p=.916 OPG r=-.096
p=.047 r=-.039 p=.419 r=.209 p=.001 r=.254 p<.0005 r=.081 p=.297 r=.055 p=.484
OPN r=-.005
p=.918 r=-.001 p=.980 r=.055 p=.370 r=.073 p=.245 r=-.120 p=.124 r=-.122 p=.120 Sclerostin r=-.091
p=.059 r=-.075 p=.126 r=.241 p<.0005 r=.240 p<.0005 r=.129 p=.096 r=.135 p=.086 2
Data are shown as spearman’s rho. The circulating bone regulatory factors were log-transformed and their z-3
scores calculated. The p value indicates the level of significance after statistical analysis. Results were adjusted 4
for 1) country; 2) country, z-score lean mass, z-score BMI, self-reported health and supplement use. Significant 5
relationships are highlighted using bold text. 6
7
References
1
1. Genant, H.K., et al., Interim report and recommendations of the World Health Organization
2
Task-Force for Osteoporosis. Osteoporos Int, 1999. 10(4): p. 259-64. 3
2. Hofbauer, L.C., et al., Estrogen stimulates gene expression and protein production of
4
osteoprotegerin in human osteoblastic cells. Endocrinology, 1999. 140(9): p. 4367-70.
5
3. Ferron, M., et al., Insulin signaling in osteoblasts integrates bone remodeling and energy
6
metabolism. Cell, 2010. 142(2): p. 296-308. 7
4. Kamiya, N., The role of BMPs in bone anabolism and their potential targets SOST and DKK1.
8
Curr Mol Pharmacol, 2012. 5(2): p. 153-63. 9
5. Gaudio, A., et al., Increased sclerostin serum levels associated with bone formation and
10
resorption markers in patients with immobilization-induced bone loss. J Clin Endocrinol
11
Metab, 2010. 95(5): p. 2248-53. 12
6. Ke, H.Z., et al., Sclerostin and Dickkopf-1 as therapeutic targets in bone diseases. Endocr Rev, 13
2012. 33(5): p. 747-83. 14
7. Takei, Y., T. Minamizaki, and Y. Yoshiko, Functional diversity of fibroblast growth factors in
15
bone formation. Int J Endocrinol, 2015. 2015: p. 729352. 16
8. Standal, T., M. Borset, and A. Sundan, Role of osteopontin in adhesion, migration, cell
17
survival and bone remodeling. Exp Oncol, 2004. 26(3): p. 179-84. 18
9. McPhee, J.S., et al., Physiological and functional evaluation of healthy young and older men
19
and women: design of the European MyoAge study. Biogerontology, 2013. 14(3): p. 325-37.
20
10. Monroe, D.G., et al., Update on Wnt signaling in bone cell biology and bone disease. Gene, 21
2012. 492(1): p. 1-18. 22
11. Brunetti, G., et al., Impaired bone remodeling in children with osteogenesis imperfecta
23
treated and untreated with bisphosphonates: the role of DKK1, RANKL, and TNF-alpha.
24
Osteoporos Int, 2016. 27(7): p. 2355-65. 25
12. Roforth, M.M., et al., Effects of age on bone mRNA levels of sclerostin and other genes
26
relevant to bone metabolism in humans. Bone, 2014. 59: p. 1-6.
27
13. Butler, J.S., et al., The role of Dkk1 in bone mass regulation: correlating serum Dkk1
28
expression with bone mineral density. J Orthop Res, 2011. 29(3): p. 414-8. 29
14. Szulc, P., et al., Correlates of bone microarchitectural parameters and serum sclerostin levels
30
in men: the STRAMBO study. J Bone Miner Res, 2013. 28(8): p. 1760-70.
31
15. Garnero, P., et al., Association of serum sclerostin with bone mineral density, bone turnover,
32
steroid and parathyroid hormones, and fracture risk in postmenopausal women: the OFELY
33
study. Osteoporos Int, 2013. 24(2): p. 489-94. 34
16. Polyzos, S.A., et al., Serum sclerostin levels positively correlate with lumbar spinal bone
35
mineral density in postmenopausal women--the six-month effect of risedronate and
36
teriparatide. Osteoporos Int, 2012. 23(3): p. 1171-6. 37
17. Thorson, S., et al., Sclerostin and bone strength in women in their 10th decade of life. J Bone 38
Miner Res, 2013. 28(9): p. 2008-16. 39
18. Schett, G., et al., Osteoprotegerin protects against generalized bone loss in tumor necrosis
40
factor-transgenic mice. Arthritis Rheum, 2003. 48(7): p. 2042-51. 41
19. Weitzmann, M.N., The Role of Inflammatory Cytokines, the RANKL/OPG Axis, and the
42
Immunoskeletal Interface in Physiological Bone Turnover and Osteoporosis. Scientifica
43
(Cairo), 2013. 2013: p. 125705. 44
20. Jabbar, S., et al., Osteoprotegerin, RANKL and bone turnover in postmenopausal
45
osteoporosis. J Clin Pathol, 2011. 64(4): p. 354-7. 46
21. Oh, K.W., et al., Circulating osteoprotegerin and receptor activator of NF-kappaB ligand
47
system are associated with bone metabolism in middle-aged males. Clin Endocrinol (Oxf),
48
22. Rogers, A., et al., Circulating estradiol and osteoprotegerin as determinants of bone turnover
1
and bone density in postmenopausal women. J Clin Endocrinol Metab, 2002. 87(10): p.
4470-2
5. 3
23. Liu, J.M., et al., Relationships between the changes of serum levels of OPG and RANKL with
4
age, menopause, bone biochemical markers and bone mineral density in Chinese women
5
aged 20-75. Calcif Tissue Int, 2005. 76(1): p. 1-6. 6
24. Samelson, E.J., et al., Increased plasma osteoprotegerin concentrations are associated with
7
indices of bone strength of the hip. J Clin Endocrinol Metab, 2008. 93(5): p. 1789-95. 8
25. Stern, A., et al., The sex-specific association of serum osteoprotegerin and receptor activator
9
of nuclear factor kappaB legend with bone mineral density in older adults: the Rancho
10
Bernardo study. Eur J Endocrinol, 2007. 156(5): p. 555-62. 11
26. Modder, U.I., et al., Regulation of circulating sclerostin levels by sex steroids in women and in
12
men. J Bone Miner Res, 2011. 26(1): p. 27-34. 13
27. Modder, U.I., et al., Relation of age, gender, and bone mass to circulating sclerostin levels in
14
women and men. J Bone Miner Res, 2011. 26(2): p. 373-9.
15
28. Mazziotti, G., et al., Increased serum osteoprotegerin values in long-lived subjects: different
16
effects of inflammation and bone metabolism. Eur J Endocrinol, 2006. 154(3): p. 373-7.
17
29. Moester, M.J., et al., Sclerostin: current knowledge and future perspectives. Calcif Tissue Int, 18
2010. 87(2): p. 99-107. 19
30. Atalay, S., et al., Diagnostic utility of osteocalcin, undercarboxylated osteocalcin, and alkaline
20
phosphatase for osteoporosis in premenopausal and postmenopausal women. Ann Lab Med,
21
2012. 32(1): p. 23-30. 22
31. Mora, S., et al., Sclerostin and DKK-1: two important regulators of bone metabolism in
HIV-23
infected youths. Endocrine, 2015. 49(3): p. 783-90. 24
32. Fan, B., et al., Does standardized BMD still remove differences between Hologic and GE-Lunar
25
state-of-the-art DXA systems? Osteoporos Int, 2010. 21(7): p. 1227-36.
26
27
28
29