Methods for developing 3D visualizations of archaeological
data: a case study of the Early Bronze Age Helike Corridor
House
KORMANN, Mariza, KATSOPOULOU, Dora, KATSAROU, Stella and LOCK, Gary
Available from Sheffield Hallam University Research Archive (SHURA) at:
http://shura.shu.ac.uk/16641/
This document is the author deposited version. You are advised to consult the publisher's version if you wish to cite from it.
Published version
KORMANN, Mariza, KATSOPOULOU, Dora, KATSAROU, Stella and LOCK, Gary (2017). Methods for developing 3D visualizations of archaeological data: a case study of the Early Bronze Age Helike Corridor House. STAR: Science & Technology of Archaeological Research, 3 (2), 478-489.
Copyright and re-use policy
Methods for Developing 3D Visualizations of Archaeological Data:
A Case Study of the Early Bronze Age Helike Corridor House
Mariza Kormann1, Dora Katsonopoulou2, Stella Katsarou3, and Gary Lock4 1Communication and Computing Research Centre,
Sheffield Hallam University, Sheffield, UK
2 The Helike Society and The Helike Project, Athens, Greece
3Ephoreia of Palaeoanthropology-Speleology, Ministry of Culture, Athens, Greece 4 The University of Oxford, Oxford, UK
[email protected], eliki@otenet., gr, [email protected], [email protected]
Corresponding author: Mariza Kormann [email protected]
Abstract
The Digital Helike Project aims at the digitization of archaeological data from the Helike Project, Achaia, Greece. This paper advances understanding of Early Bronze Age house building techniques with focus on corridor houses. The Helike Corridor House is a fine example of an architectural style of the Early Helladic period EH II/Early EH III on the Greek mainland and it is used here as a case study. A methodology for 3D reconstruction is described supporting both structural integrity simulations and advanced visualization studies. The paper focuses on three aspects: firstly, it highlights technological innovations in the Bronze Age period by drawing attention to structural integrity studies recently carried out by the research team; secondly, it describes a methodology for building fully geo-referenced 3D models supporting structural integrity studies and visualization on GIS-Geographic Information Systems; and thirdly, it leads to the universal access of data and visualization over the Internet through the selection of appropriate open source, open standards and freely available tools and applications. The methodologies proposed here deepen insights on archaeological data enabling new inferences and knowledge to be gained through the implementation of universally shared low cost applications.
Keywords: Helike Corridor House, Digital Helike Project, visualization, structural integrity, geo-referenced 3D model, open data, open access
1 Introduction
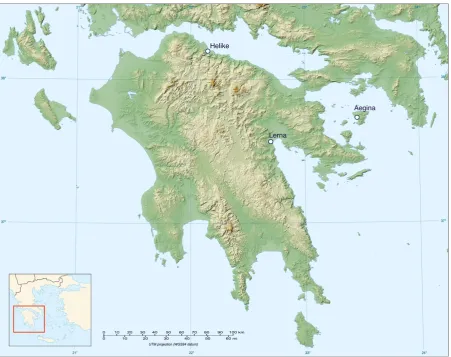
Figure 1: The location of Early Helladic Helike in the Peloponnese.
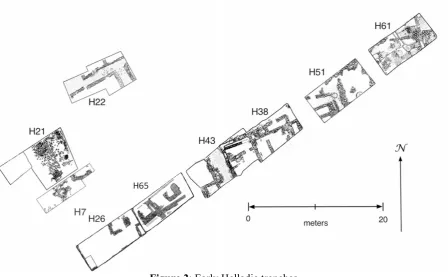
Figure 2: Early Helladic trenches
Within this framework of development, architectural advances both resulted in and corroborated social transformations. This issue becomes intriguing with the study of the Helike Corridor House (HCH) (Katsonopoulou, 2011a), one of the finest examples of this type of architectural style of EH II/early EH III and used here as case study to understand construction design, materials and techniques and their implications within a social context. The innovative building techniques involved the improvement of the adobe structure to accommodate enlarged cooking and storage facilities on the ground floor and the employment of the narrow corridor as a structural element. Structural integrity studies recently carried out by the Helike research team (Kormann et al., 2016a; 2016b) have verified that the corridors on the long sides of the HCH were a crucial architectural feature to support a second floor and a tiled roof. The corridor’s double walls plus the house internal cross walls were shown to be capable of absorbing the heavy roof load. From comparable accounts, this kind of modification reflected an architectural pattern which aimed at monumentality and may have been employed to serve a centralized administrative seat and the rapid advance of EH society towards hierarchical pre-state modes (Shaw 1987; Shaw 1990; Shaw 2007; Peperaki 2004; Pullen 2008; Maran 1998; Maran and Kostoula 2014).
A full 3D model of the HCH was created with a tiled roof based on archaeological evidence from the foundation walls and from related Corridor Houses of the period, including the Weisses Haus in Aegina and The House of the Tiles at Lerna (Shaw 1987; 2007). The model was used to verify the monumental scale of the house, built from adobe brick. Previous research (Kormann et al., 2016a) has shown that an earlier EH II rectilinear ground floor design was modified into a corridor type of building. A long external wall at the back of the house was built 1.5 times wider than the adjoining walls to decrease its susceptibility to buckling as shown in the simulation studies of Kormann et al. (2016a).
typical of Minoan roofs of the period, made with a wooden structure, a layer of reeds, a layer of mud and a thick layer of rammed earth, the walls could not support it and the house would collapse. This observation points to sophisticated construction techniques with regards to the roof of the HCH, made of a wooden structure and a layer of reeds, followed by a thin layer of clay and tiles. The research also supported the argument for specialization of planning and architectural design in the period. This is based on the observation that the Corridor Houses at Helike, Aegina and Lerna are strikingly similar where the Weisses Haus at Aegina is about 1.5 larger than Helike concerning length and width and the House of the Tiles at Lerna is twice as large as Helike.
This paper is organized as follows. Section 2 describes the aims and methodology and Section 3 provides a rationale for the visualizations. Section 4 outlines the results of creating, geo-referencing and displaying the 3D model of the HCH and finally Section 5 presents a discussion and conclusion.
2 Aims, Objectives, and 3D Reconstruction Methodology
The Digital Helike Project (DHP) aims at digitizing and integrating published data from the Helike Project into a geo-referenced database, and at creating compelling visualizations and simulations that are universally accessible from web browsers and from publicly available interfaces such as Google Earth. One of DHP’s main principles is to provide free, universal digital access to all published archaeological data connected to Helike. Apart from tabular data, these will also include digitized terrain models of the relevant sections of the Helike plain, an area of approximately 4 km2, 3D models of pottery, artefacts, houses and other buildings, images, videos, maps and so on. Eventually, representations and visualization of the entire delta at various periods of time will be available. To realize its goals, open source tools and methods are used and developed so that, in the future, researchers will be able to contribute data to the DHP main database.
The aims of this paper are to investigate the architectural plan and house building technology of the HCH from results of structural integrity analyses (Kormann et al., 2016a; 2016b) placing the house in the context of social transformations in the EBA period. This is achieved by giving the archaeologist the ability to develop fully geo-referenced 3D digital assets and on placing archaeological datasets and artefact representations over large landscapes that can be visualized on Google Earth (GE) and web browsers. 3D models can then be analysed not in isolation but in their real 3D scale placed in situ enabling spatial analysis, relationships, and the study of movement among other approaches. The objectives of the research are listed as follows:
1. Identify open source/open access tools and techniques for 3D model creation.
2. Demonstrate techniques for geo-referencing 3D assets through a case study of the HCH.
3. Export the HCH models to support structural integrity studies and interactive display technologies demonstrated through visualization using the GE interface.
will be addressed in the near future. In any case, data and information on Cesium will be handled in the same way as the GE solution described here, which are compatible with the Cesium API.
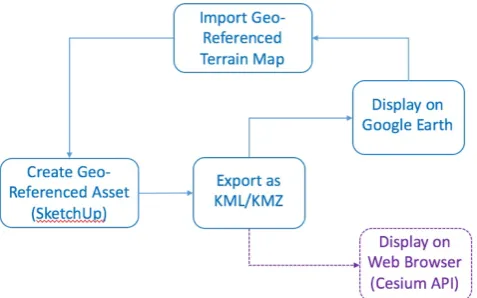
[image:6.595.179.418.268.417.2]The box in Figure 3 ‘Import Geo-Referenced Terrain Map’ refers to importing the terrain into a CAD package that supports geo-referencing. The box ‘Create Geo-Referenced Asset’ refers to the actual 3D drawing of the model, including texture mapping. At this stage, the exact geo-references are obtained possibly by alternative means if the CAD package does not support geo-referencing. The aim here is to define the geo-referencing parameters that allow the creation of an XML file that can be exported as KML format. The box ‘Export as KML/KMZ’ refers to creating the XML structure that is compatible with the KML file format, and its equivalent KMZ compressed version. Once this is achieved, the file is ready to be open by the GE application, which can also be called from inside a web browser using the Cesium API.
Figure 3: Pipeline for creating geo-referenced assets and display either on Google Earth or on a web browser.
Concerning the identification of tools and techniques for 3D model creation, among the most popular open source 3D modelling packages considered here are Blender, MeshLab, and SketchUp. Blender is the most sophisticated 3D computer graphics software which can be used to create animation, visual 3D effects, interactive 3D applications and video gaming. Blender has a steep learning curve as its design favours programmers and engineers (Brandt, 2011) which is perhaps its biggest disadvantage as it requires huge effort and discipline to master its features.
MeshLab is open source software for the development of 3D meshes and data handling. It has been developed from the needs of a 3D scanning pipeline where data are unstructured so it has specialized functions for mesh cleaning, removal and deleting of duplicates and unreferenced vertices, mesh smoothing, painting, repairing and so on (Derysh, 2014). It can import and export to most standard 3D formats and one of its great advantages is the ability to edit meshes in an intuitive way.
does not have the full range of capabilities, neither is it designed to process and interface with large amounts of unstructured data such as MeshLab.
In January 2015 Google announced (Marquardt, 2015) that GE Pro was made freely available with advanced features that help the measurement of 3D buildings, print high-resolution images for presentations or reports, GPS data import, and recording of high definition movies of virtual flights. GE has many easy to use features and detailed geo-referenced imagery helping the display and visualization of geographic data for countless applications. Given that a main requirement of the Digital Helike Project is to create a geo-referenced database of published Helike data, the project has opted to use SketchUp to create 3D models in connection with GE Pro for data visualization. For more complex modelling requirements, there is the option of using SketchUp Pro with Boolean operation features which facilitate model building.
3 Archaeological Data Visualization
In a recent review of Geoinformatic Technologies for landscape archaeology, Sarris (2015) has highlighted methodological issues concerning state-of-the-art digital techniques available to archaeologists. It has been long suggested that virtual environments and data visualization help the archaeologist to explore, comprehend and explain data and information acquired from vastly diverse sources (Lock, 2003). Here we address interactive visualization issues in archaeology through a methodological approach for fully geo-referenced, 3D interactive visualizations focussing on the generation of 3D models, and on placing archaeological datasets and artefact representations over large landscapes visualized on GE and web browsers.
We examine the methodology for creating geo-referenced 3D models using SketchUp by direct manipulation of the imported geographic area and then the addition of textures and the exporting of the final 3D model to KML format for display on GE and web browsers. The described methods enhance digital relationships between archaeologists and data by lowering entry barriers through easy to implement techniques and freely available applications. In turn, universal data access leads to new inferences and knowledge gained from different perspectives.
Visualization is a powerful tool to convey a message or an idea either through images, diagrams, or animations. It translates data from computer formats to human understandable formats using images, graphical models, charts, and other graphs that humans feel comfortable interpreting. Visualization of buildings has been a topic of much research in archaeology and can effectively communicate both abstract and concrete concepts, and can help a wider understanding and appreciation of the subject matter (see the papers in Chapter 8 of Giligny et al., 2015; Hermon, 2007; Hermon, 2012). There is a strong connection between simulation and visualization, as visualization is used to show the results of computations to the user aiding fast and effective interpretation.
advocates a digital experience that embraces creativity, imagination and aesthetic quality. In previous work along these lines, Allen et al. (2004) have developed a sophisticated modelling pipeline for 3D image acquisition, reconstruction and the production of accurate geometric and photorealistic representations of archaeological sites. The method, however, requires a level of resources far superior to those available to the average archaeologist as it relies on proprietary software and expensive advanced data acquisition hardware.
In contrast, our approach to data quality and to interactive visualization interfaces is focused on open source tools thus lowering the entry barrier to archaeologists. The requirements of our proposed method are that it must be able to run everywhere from anywhere. The most appropriate interfaces are thus, provided by web browsers whose applications can be developed entirely based on open standards and protocols.
We propose that all web applications be developed using the HTML5 open standards and JavaScript. HTML5 is the fifth revision of HTML (Hyper Text Mark-up Language) that became the official standard for web browsers from Oct 2014. HTML5 provides support for graphics, audio, video and multimedia elements including 3D model display that does not require external plug-ins to work. Furthermore, HTML5 has a Geolocation API (Application Program Interface) to be used in connection with mapping applications. A full description of HTML standards is provided by the Web Hypertext Application Technology Working Group (WHATWG, 2016).
JavaScript is the most popular scripting language on the Internet (JavaScript, 2016; W3schools, 2016), it is freely available and is installed on the local machine for web browser use. The language has been developed with the specific aim to make web pages more interactive. JavaScript statements are embedded into standard HTML code.
When preparing data for display, accurate geo-referencing is a requirement. We propose a direct manipulation approach, in which a geo-referenced portion of the world is imported into a CAD model as a map on a 2D plane. Any object (3D object or marker) placed on the map would thus be automatically geo-referenced. For these reasons, we propose pairing GE and SketchUp as the tools of choice such that buildings, objects and features are created with accurate geo-references. GE Pro and SketchUp applications are freely available (Haselton, 2015; Marquardt, 2015).
The properties of digital assets such as 3D models and related data are described using the XML-Extensible Mark-up Language. The XML format is simple, understood by both machine and human and can easily be modified or transformed into another format if dictated by future requirements. To load a data object (a graphical object such as models of houses, paths, markers, events, photos, images, and so on) and display on GE, the object is coded into KML or KMZ format, which is a standard format described by XML tags. A KML file can be created with any word processing application by including appropriate XML commands. All data such as images, video, sound, and 3D models will adopt standard file formats such as PNG, MOV, WAV, and COLLADA. This strategy ensures that in the future, visualization assets will be compatible with newer versions of web browsers and the GE interface.
4 Results of 3D Model Creation and Visualization
plain. Referring to the methodological steps depicted in Figure 3, modelling starts with opening SketchUp, setting user preferences such as adjusting background colour, and so on.
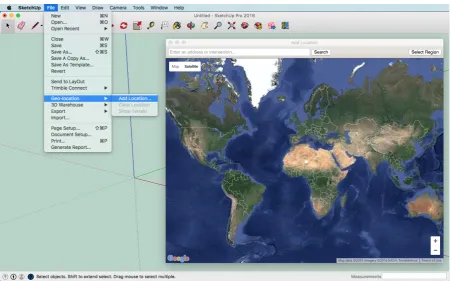
Figure 4: Select a geo-located area on the map
Figure 4 shows the step ‘Import Geo-Referenced Terrain Map’. In SketchUp, choose File/Geo-location/Add location then zoom in on the map using the dialog box until the desired area of the world is in view. Select Grab location and it will be automatically displayed in SketchUp.
Figure 5 depicts the imported geographic location which is then displayed centred on the coordinate system determined within SketchUp. Every pixel of the imported image is geo-referenced, so every feature placed on the image is also geo-referenced. Conversely, if one has the exact geo-coordinates of a trench for instance, this can be exactly placed on the map by identifying which pixel or group of pixels correspond to the given geo-location. Thus, all models created with SketchUp will be fully geo-referenced and terrain features can be used for correct placing of the models on the map. This method of importing a geo-referenced texture map is referred to as direct manipulation as the user is not required to provide any geolocations either by programming nor by entering the values for latitude and longitude. The user can, however, extract the exact latitude and longitude of a feature directly from Google Earth to confirm that the feature is placed exactly on the map in SketchUp. The main advantage is ease of use, as models and features are geo-referenced and oriented as the user places them on the map.
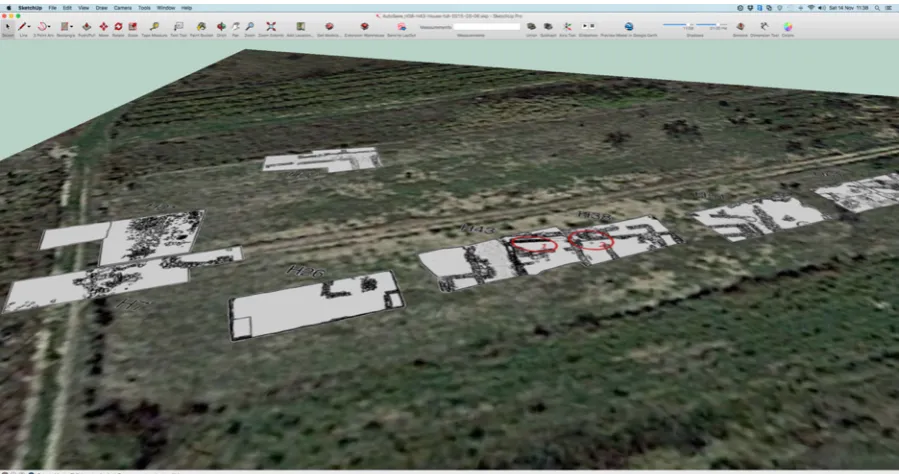
Figure 6: Trench map overlaid on the terrain showing the excavated trenches.
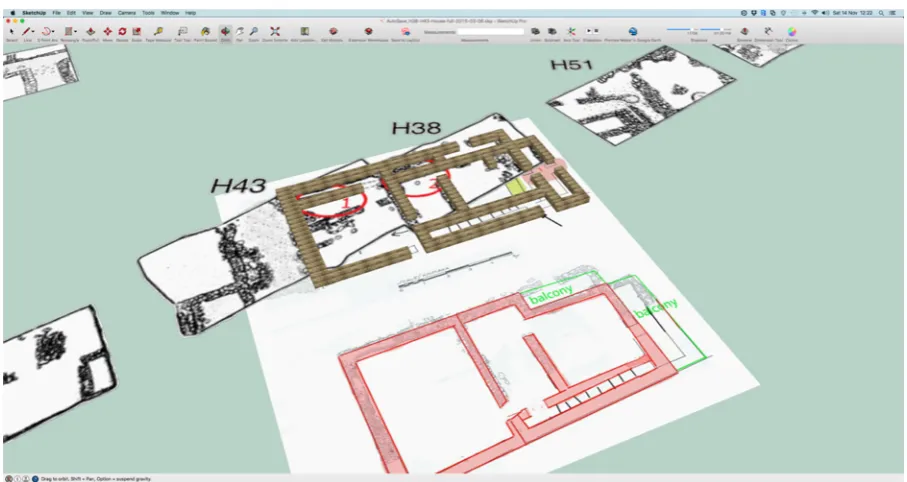
[image:10.595.73.523.264.501.2]Figure 7: Registered scale drawings and foundation modelling.
In Figure 7, the terrain layer is hidden and scaled drawings of the Helike Corridor House plan are registered to the geo-referenced trench features. The HCH spans areas 1 and 2 circled in red in Trenches H43 and H38. The drawings in pink illustrate the first-floor plan. 3D modelling of the house starts by defining the foundation walls in SketchUp by drawing rectangular regions over the plan of the house and then extruding to its 3rd dimension. The complete foundation walls are shown in brown in Figure 7.
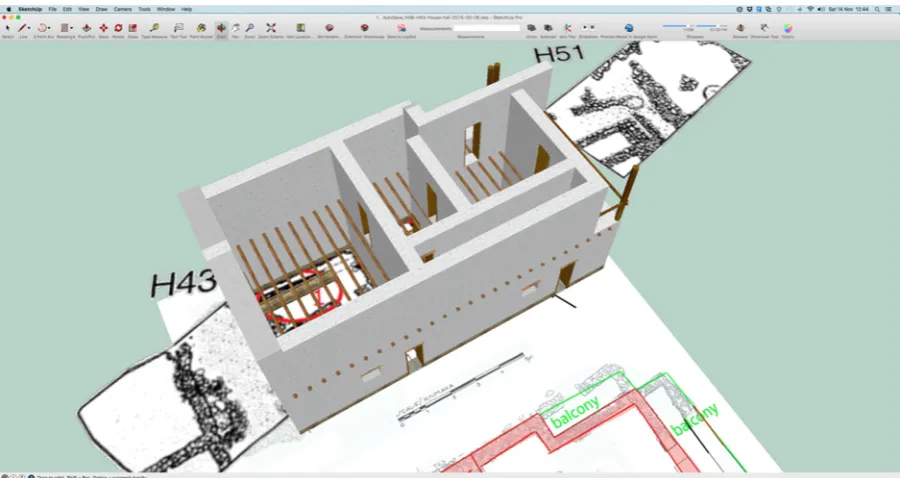
Figure 8: Walls, wooden features to support first floor, doors and balcony are created.
[image:12.595.74.526.432.673.2]In the HCH model the use of wooden reinforcing longitudinal beams were constructed from the local species Olea spp lying beneath the Pinus halepensis floor structure, and in the construction of the steps in the stair structure (Kormann et al., 2016a, 2016b). For added realism, each house component was added texture sourced from the Helike Project and from the Internet. SketchUp provides direct manipulation functions for easy management of texture mapping.
Figure 9: Roof structure and remaining floor features are added to the model.
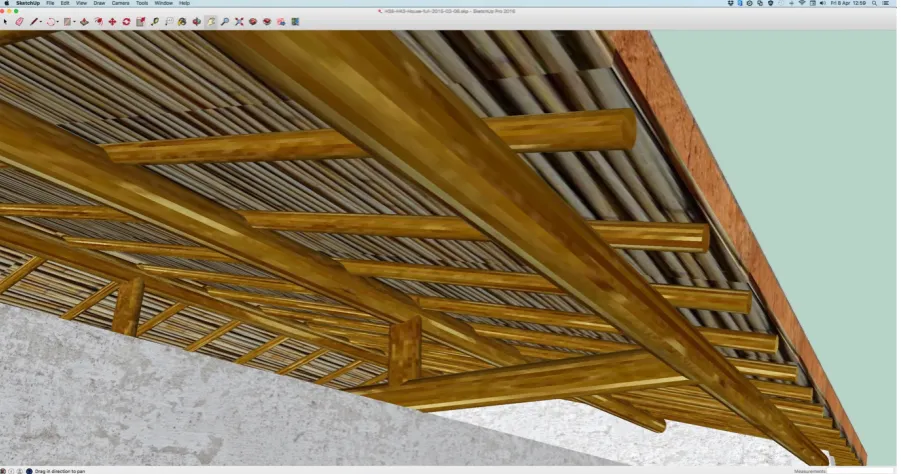
would have had an added topmost layer of tiles. The layer of reeds, clay and tiles were modelled simply as thin rectangular boxes layered on top of the wooden structure. The structure of the roof follows closely from Shaw (1987) while the dimensions of the beams and of rafters were taken from Wiencke’s interpretation of Lerna (Maran and Kostoula, 2014). Note that the longer beams on the roof structure are lying on top of the external walls (and thus, supported by them). Internally, wooden structures support the beams lengthwise. It is not suggested that single beams would span the entire length of the house; they most probably were cut in short sections which is implied in the 3D reconstruction.
[image:13.595.71.525.277.520.2]Figure 10 depicts the model with an external wall removed to show internal details. Note the wooden structures of the first floor, roof and stairs and that the walls are of three different thicknesses. A section of the beams above the stairs are, in fact, inside the external wall that has been removed from the visualization, so access to the upper floor is not impeded. The stone foundations are higher than the ground to protect the adobe bricks from water.
Figure 10: Details of the model
Figure 11: Details of the roof
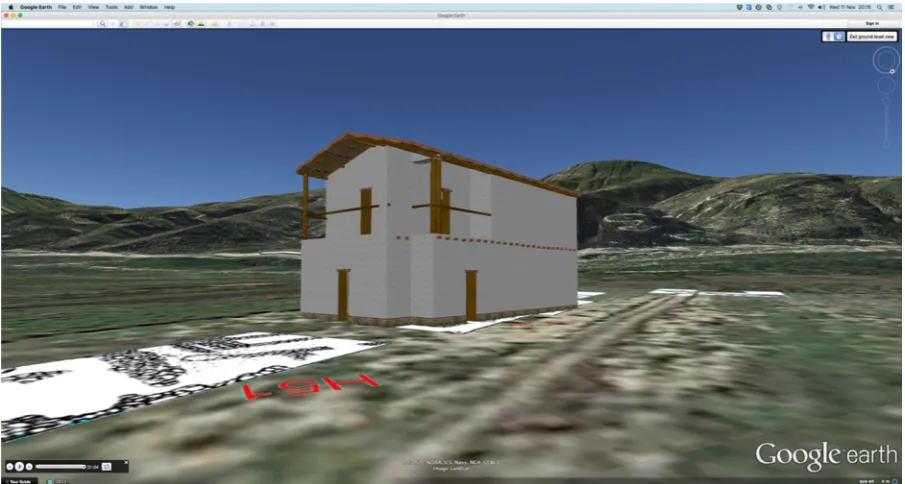
Figure 13: The exported 3D model to KML format is visualized with overlaid trenches on Google Earth.
Figure 13 shows the final visualization of the Helike Corridor House and the overlaid trenches on GE from its KML references.
5 Discussion and Conclusion
This paper has placed strong emphasis on our current efforts regarding visualization in creating digital assets that are universally accessible through web browsers and GIS interfaces such as GE. Technological developments in the EBA concerning house design and building techniques are highlighted through 3D modelling and visualization using the HCH as a case study. Previous research has shown how 3D models can be used to support structural integrity studies (Kormann et al., 2016a; Kormann et al., 2016b) such as the doubling of external walls to form corridors and accommodate stairway access to the upper floor together with internal divisions. These were necessary innovations to ensure the integrity of the house concerning its mechanical properties related to susceptibility to buckling and its ability to support a second floor.
finite element analysis in structural integrity studies (Kormann et al., 2016a; Kormann et al., 2016b) and visualization as described here, perhaps uncovering further interesting similarities and differences.
Overall, the digital reconstructions described in this paper have improved archaeological insights in the EBA of the Greek mainland, and specifically regarding the corridor type architecture, a top debated issue of the period, by drawing inferences on technical specialization and expertise, advanced space demands for administration purposes, plan modification and building materials. Our 3D reconstruction of the newly studied HCH contributes afresh to this debate after a long period of silence since the first conjectural reconstructions of earlier excavated corridor houses were performed by Shaw (1987, 1990, 2007). The presented methodologies enhance the range of insights on the digital relationships with archaeological data enabling new inferences and knowledge by the implementation of universally shared low cost applications. Future planned work of the Digital Helike Project includes the integration of borehole data (Soter et al., 2001; Soter and Katsonopoulou, 1998) retrieved from the EBA settlement and from the interior of the buildings to enhance inferences on house floor construction and contents.
References
3D Engineer. 2016. Google SketchUp Initial Review. [online] http://www.3dengr.com/ google-sketchup-initial-review.html last accessed March 2016.
Allen, P. et al. 2004. ‘Seeing into the Past’: Creating a 3D Modeling Pipeline for Archaeological Visualization. Proceedings of the 2nd International Symposium on 3D Data Processing, Visualization and Transmission (3DPVT’04) IEEE: 751-758. Brandt, C. 2011. Blender Review, TechWorld [online] http://www.techworld.com/review/
graphic-design-and-publishing-software/blender-review-3320178/ last accessed March 2016.
Cesium. 2016. Cesium an Open Source JavaScript Library for 3D Globes and Maps. [online] https://cesiumjs.org/
Derysh, I. 2014. MeshLab Review. 3D Printer [online] http://www.3dprinter.net/meshlab-review last accessed March 2016.
Giligny, F., F. Djindjian, L. Costa, P. Moscati and S. Robert. 2015 (eds). CAA2014. 21st Century Archaeology. Concepts, Methods and Tools. Proceedings of the 42nd annual conference on Computer Applications and Quantitative Methods in Archaeology. Oxford; ArchaeoPress.
Haselton, T. 2015. Google Earth Pro Now Free for Everyone to Donwload. TechnoBuffalo
[online]
http://www.technobuffalo.com/2015/01/31/google-earth-pro-now-free-for-everyone-to-download/ last accessed April 2016.
Helike. 2016. The Helike Project [online] http://www.helike.org/. Last accessed on 22 Mar 2016.
Hermon, S. 2007. 3D Modelling as a Scientific Research Tool in Archaeology. Available from: http://academia.edu/1226903/3D_Modelling_as
_a_Scientific_Research_Tool_in_Archaeology. Accessed January 2017.
http://academia.edu/1227042/Scientific_Method_Chaine_Operatoire_and_Visualizati
on_-_3D_Modelling_as _a_Research_Tool_in_Archaeology. Accessed January 2017.
Isenberg, P., N. Elmqvist, J. Scholtz, D. Cernea, K-L. Ma, H. Hagen. 2011. ‘Collaborative Visualization: Definition, Challenges, and Research Agenda’. Information Visualization 10 (4): 310-326.
JavaScript Source. 2016. Tutorials [online] http://www.javascriptsource.com/tutorials/ last accessed April 2016.
Jeffrey, S. 2015. ‘Challenging Heritage Visualisation: Beauty, Aura and Democratisation’. Open Archaeology 1 (2015): 144-152.
Katsarou, S. 2011. ‘Morphology and Distribution of Pottery at the Early Helladic Settlement of Helike’ in Helike IV- Ancient Helike and Aigialeia Protohelladika: The Southern and Central Greek Mainland. D. Katsonopoulou (ed.) Athens, Greece: 89-125.
Katsonopoulou, D. 1998. ‘First Excavations at Helike: Klonis Field’ in Helike II- Ancient Helike and Aigialeia, D. Katsonopoulou, S. Soter and D. Schilardi (eds.) The Helike Society. Athens: 125-145.
Katsonopoulou, D. 2005. ‘Test Excavations in the Helike Delta in 2000’ in Helike III- Ancient Helike and Aigialeia, Archaeological Sites in Geologically Active Regions, D. Katsonopoulou, S. Soter and I. Koukouvelas (eds.) The Helike Society. Athens: 33-66.
Katsonopoulou, D. 2011a. ‘A proto-urban Early Helladic Settlement Found on the Helike Delta’ in Helike IV- Ancient Helike and Aigileia: The Southern and Central Greek Mainland, D. Katsonopoulou (ed.), 63-88. The Helike Society. Athens.
Katsonopoulou, D. 2011b. ‘The Hellenistic Dye-works at Helike, Achaea, Greece’ in Textiles y tintes en la ciudad Antigua. Purpureae Vestes III, C. Alfaro, J.P. Brun, Ph. Borgard and R. Pierobon Benoit (eds.) University of Valencia and CNRS-EFR. València and Naples: 237-242.
Kormann, M., S. Katsarou, D. Katsonopoulou and G. Lock. 2016a. 'Structural Integrity Modelling of an Early Bronze Age ‘Corridor House’ in Helike of Achaea, NW Peloponnese’ in CAA2015 Proceedings of the 43rd Annual Conference on Computer Applications and Quantitative Methods in Archaeology.: S. Campana, R. Scopigno, G. Carpentiero, and M. Cirillo, (eds.) Oxford: Archaeopress.
Kormann, M., S. Katsarou, D. Katsonopoulou and G. Lock. 2016b. ‘On roof construction and wall strength: non-linear structural integrity analysis of the Early Bronze Age Helike Corridor House’ in: CAA 2016: 44th International Conference on Computer
Applications and Quantitative Methods in Archaeology, Oslo, Norway, 29 March to 2 April 2016. Forthcoming.
Lock, Gary. 2003. Using Computers in Archaeology: Towards Virtual Pasts. London: Routledge.
Maran, J. 1998. ‘Kulturwandel auf dem griechischen Festland und den Kykladen im späten 3. Jahrtausend v. Chr.: Studien zu den kulturellen Verhältnissen in Südosteuropa und dem zentralen sowie östlichen Mittelmeerraum in der späten Kupfer- und frühen Bronzezeit’. Universitätsforschungen zur prähistorischen Archäologie 53 (1-2): Bonn.
Archaeology of the Eastern Mediterranean in Honour of E. Susan Shettatt. Y. Galanakis, T. Wilkinson and J. Bennet (eds.) Oxford: Archaeopress: 141-158.
Marquardt, S. 2015. Google Earth Pro is now free. The Official Blog for Google Maps [online] https://maps.googleblog.com/2015/01/google-earth-pro-is-now-free.html last accessed March 2016.
Palyvou, K. 2005. Akrotiri Thera: An Architecture of Affluence 3,500 Years Old. Philadelphia: INSTAP Academic Press.
Reilly, P. 1989. Data Visualization in Archaeology. IBM Systems Journal 28 (4): 570-579. Peperaki, O. 2004. The House of the Tiles at Lerna: Dimensions of ‘Social Complexity’ in
The Emergence of Civilisation Revisited. J.C. Barret and P. Halstead (eds) Oxford: Oxbow Books: 214-231.
Pullen, D. J., 2008. ‘The Early Bronze Age in Greece’ in C.W. Shelmerdine (ed.), The Cambridge Companion to the Aegean Bronze Age: Cambridge: University Press: 19-46.
Sarris, Apostolos, ed. 2015. Best Practices of Geoinformatic Technologies for Mapping of Archaeolandscapes. Oxford: Archaeopress.
Shaw, J.W. 1987. ‘The Early Helladic II Corridor House: Development and Form’. The American Journal of Archaeology. (91): 59-80.
Shaw, J.W. 1990. ‘The Early Helladic II Corridor House: Problems and Possibilities’ in P. Darcque and R. Treuil (eds), L’Habitat Egéen Préhistorique (BCH Suplementary (19): Paris: École Française de Athènes: 183-194.
Shaw, J.W. 2007. ‘Sequencing the EH II Corridor Houses’. British School at Athens (102). Athens: 137-151.
Soter, S., and D. Katsonopoulou. 1998. ‘The Search for Ancient Helike, 1988–1995:
Geological, Sonar and Bore Hole Studies’ in Helike II- Ancient Helike and Aigialeia, Proceedings of 2nd International Conference on Helike, Aigion. D Katsonopoulou, S Soter and D Schilardi (Eds), Greece: 69-105.
Soter, S., P. Blackwelder, C. Tziavos, D. Katsonopoulou, T. Hood, and C. Alvarez-Zarikian. ‘Environmental Analysis of Cores from the Helike Delta, Gulf of Corinth, Greece’, Journal of Coastal Research 17 (1): 95-106.
Soter, S., and D. Katsonopoulou. 2005. ‘Studies on the Geoarchaeology of the Helike Delta: 1991-2000’ in Helike III- Ancient Helike and Aigialeia. Archaeological Sites in Geologically Active Regions. Dora Katsonopoulou, Steven Soter and Ioannis Koukouvelas (eds) Athens, Greece: 169-182.
Soter, S., and D. Katsonopoulou. 2011. ‘Submergence and Uplift of Settlements in the Area of Helike, Greece, from the Early Bronze Age to Late Antiquity’. Geoarchaeology: An International Journal, 26, (4): 584-610.
W3schools. 2016. JavaScript Tutorial. [online] http://www.w3schools.com/js/ last accessed April 2016.
WHATWG. 2016. HTML Living Standard – Last Updated 1 April 2016. The Web Hypertext Application Technology Working Group, WHATWG, [online]