Workplace Alignment: An evaluation of office worker
flexibility and workplace provision
HAYNES, Barry <http://orcid.org/0000-0003-3740-4159>, SUCKLEY, Louise <http://orcid.org/0000-0003-2577-3731> and NUNNINGTON, Nick
Available from Sheffield Hallam University Research Archive (SHURA) at:
http://shura.shu.ac.uk/24529/
This document is the author deposited version. You are advised to consult the publisher's version if you wish to cite from it.
Published version
HAYNES, Barry, SUCKLEY, Louise and NUNNINGTON, Nick (2019). Workplace Alignment: An evaluation of office worker flexibility and workplace provision. Facilities, 37 (13/14), 1082-1103.
Copyright and re-use policy
See http://shura.shu.ac.uk/information.html
1 Workplace Alignment: An evaluation of office worker flexibility and workplace provision
Abstract
Purpose – The paper aims to explore the relationship between office occupier work activity and workplace provision. It tests the proposition that location-fixed office workers are not as well-supported in the working environment as location-flexible office workers. The research also explores the perceptions of the workplace provision based upon the types of tasks completed at the desk-location, whether this was collaborative or focused.
Design/methodology/approach – The research adopts a cross-sectional approach using an online questionnaire to collect data from several offices in the Middles East. The dataset consists of 405 responses. One-way ANOVA was conducted to understand the relationship between location flexibility and perception of productivity. In addition, a series of T-Test were used to evaluate the relationship between work activities and office environment.
Findings – The results show that those workers who were location-fixed perceived the workplace provision to have a more negative impact on their productivity than those who had a greater level of location-flexibility, particularly with regards to noise levels and interruptions. In terms of types of activities, those that undertook more collaborative tasks valued the facilitation of creativity and interaction from the workplace provision.
Research limitations/implications – The research has limitations as data collection was at one-point in time and therefore lacks the opportunity to undertake longitudinal analysis. However, the research gives greater insights into the alignment of office environments based on flexibility and work activity.
Practical implications – The paper identifies implications for the design and development of office environments by identifying the need for office occupier activity profiles. These profiles can underpin data led design which should promote a tailored choice appropriate work setting that can maximise productivity.
Originality/value – This paper contributes to the research area of workplace alignment. It establishes that optimal workplace alignment requires a better understanding of office occupier needs based on location-flexibility and work activity.
Keywords: productivity, person-environment fit, flexible working, activity-based working
2 Workplace Alignment: An evaluation of office worker flexibility and workplace provision
Introduction
The need to provide office occupiers with more flexibility, with regards to how and where they work, has led to the development of Activity Based Working (ABW). This type of working allows office occupiers to choose the most appropriate office environment to undertake a particular work activity (Appel-Meulenbroek, Groenen, & Janssen, 2011; Skogland, 2017). The ABW concept allows the office occupier the ability to design their own office environment on an hourly, weekly and monthly basis. Adopting this approach means that the office occupier is not restricted by one workspace type but can adapt their working environment to suit their specific work activities (Haynes, Nunnington, & Eccles, 2017). It is proposed that a better alignment between job task and working environment can lead to a positive effect on office workers’ job attitudes and well-being (Wohlers, Hartner-Tiefenthaler, & Hertel, 2017).
Where there are benefits to ABW, it is also worth balancing this by understanding the potential penalties. If the principal driver for the implementation of ABW is cost reduction than the consequences could be greater disruption to workflow and increased dissatisfaction of office users (Parker, 2016).
The challenge facing organisations is obtaining the balance between cost effective workplace provision and the provision of an appropriate number of different types of workplace to facilitate both individual focused work as well as interactive collaborative work (Wohlers et al., 2017). Given that some organisations are typically allocating less desks than people in the office environment then office occupiers will need to be flexible as to where they work and move to the most appropriate location dependent on their work activity. This trend highlights two main challenges which are; establishing the right quality and quantity of space to allow the different work activities (Wohlers & Hertel, 2017), also to understand occupiers switching behaviour when moving from one activity and location to another (Hoendervanger, Been, Van, Mobach, & Albers, 2016).
The aim of this paper is to evaluate the flexibility that office workers have to move around the office environment and choose their preferred working environment for a particular work activity. In addition, office working environments will be evaluated to establish if they support activities such as focused task and collaborative tasks. Therefore, the research questions addressed in this paper are:
1. Do office workers with greater location-flexibility feel the office environment is more supportive of their perceived productivity than those that are location-fixed?
2. Do the office environments provided support the different office worker activities?
Office worker flexibility
3 occupiers in terms of mobility and wider organisational interactions (Haynes et al., 2017). Medium-level mobility office workers have a higher degree of flexibility than the low-level mobility workers, and the increased flexibility means that medium-level mobility workers can work in a range of different types of office space either within the office environment or throughout the office building (Haynes, 2012). The medium-level mobility worker can be classified as the person who leaves their jacket over their chair but are not always at their desk (Greene & Myerson, 2011). High–level mobility worker will spend most of their working day outside the office environment (Haynes, 2012). This type of office worker can be best classified as a worker who visits the office rather than a worker that is constantly in the office (Greene & Myerson, 2011). The high-level mobility workers will tend to adopt a non-territorial work practice when in the office.
One way of ensuring that the workspace provided supports mobile workers is to consider the building typology. This requires consideration to be given to how the building actually works for the organisation. This could lead to a better understanding of building flow which includes movement around the building and through vertical connections made between teams across building floors (Haynes, 2012).
The concepts of flexibility and mobility are central to the concept of ABW. The principle of ABW working is that people move around the office to a specific work environment that supports a work activity (Appel-Meulenbroek et al., 2011). This principle assumes that there are a variety of different work environments to match the number of different work activities, and that office occupiers are willing to switch work location to one that best meets the activity needs (Brunia, Been, & van der Voordt, 2016; Parker, 2016; Wohlers & Hertel, 2017). It could be argued that the office worker that undertakes the widest variety of tasks will need to switch their work location a number of times throughout the working day. This constant need to realign their working environment to their work activity through switching can be potentially disruptive to the office worker (Hoendervanger et al., 2016). Gaining a better understanding of office worker switching behaviour is important as some office workers may be more satisfied with a designated workstation that is multifunctional rather than a range of different activity-based workplaces (Hoendervanger et al., 2016).
An evaluation of some of the potential drawbacks of ABW was undertaken by De Been et al (2015). The research surveyed 2733 respondents and also conducted 57 group interviews with 271 participants. The results of the study indicated that whilst the open work environments encouraged communication, they were seen less favourably with regards to privacy and personal conversations where employees can share their thoughts and feelings freely (Sundstrom, Town, Brown, Forman, & Mcgee, 1982). The findings also suggested that employees felt less social bonding in these environments which is likely to link to the lack of the ability to communicate personally with work colleagues (Brennan, Chugh, & Kline, 2002). In addition, the different types of workspaces were not always available indicating that the right balance of spaces had not been achieved (de Been, Beijer, & den Hollander, 2015)
4 potential productivity penalties rather than move to a more productive working environment that better aligns to their work activities (Skogland, 2017; Wohlers & Hertel, 2017).
In addition to having the flexibility to choose where to work, there is also a requirement to have personal control of the office environment. Samani (2015) undertook an evaluation of the literature to try to identify the significance of personal control within an individual's environmental satisfaction and performance. The review identified a few areas including noise, density, privacy and ambient conditions where office users had reduced satisfaction and performance and an increase in environmental stressors (Samani, 2015). Allowing employees to have some personal control over these specific areas could help lead to increased satisfaction and improve productivity.
To ensure optimal alignment can be achieved, between the working environment and the work activity, consideration needs to be given to the Indoor Environmental Quality (IEQ) (Bodin Danielsson, Bodin, Wulff, & Theorell, 2015; Kim & de Dear, 2013). There does not appear to be a definitive definition of the variables to be included in an IEQ evaluations as some researchers focus only on one variable, whilst others may include a range of variables. Horr et al (2016) undertook an extensive literature review to evaluate 300 research papers which investigated office indoor environment quality and productivity. The review concluded that the physical environment factors affecting IEQ could be clustered around 8 areas which were: indoor air quality, thermal comfort, lighting and daylight, noise and acoustics, office layout, biophilia and views, look and feel and location and amenities (Al Horr et al., 2016). In addition, Heinzerling et al (2013) reviewed literature that aimed to evaluate IEQ assessment models which attempted to link IEQ with the health, productivity and wellbeing of the building’s occupants. Their review concluded that IEQ should include at least 4 main variables which were; acoustics, indoor air quality, lighting and thermal comfort (Heinzerling, Schiavon, Webster, & Arens, 2013). In addition, there is also a need to better understand the additional challenges placed on the IEQ by office workers with different levels of location flexibility.
Office worker activity
In general work activities can be classified into one of two categories which are focused work which requires distraction free working and collaborative work which requires interaction with work colleagues (Haynes, 2008; Heerwagen, Kampschroer, Powell, & Loftness, 2004). Therefore, there is a requirement to provide a range of different work settings that allows office occupier to align their work activity with the working environment (Bodin Danielsson & Bodin, 2008; Haynes et al., 2017; Seddigh, Berntson, Bodin Danielsson, & Westerlund, 2014). This also raises the issue of the balance between interaction to allow collaborative working and privacy to allow distraction free focused work (Haynes, 2008).
5 feelings of frustration and increased levels of stress (Seddigh et al., 2014). Providing office occupiers with increased flexibility to choose different locations for different activities allows them to have an element of control over their requirement for privacy (Ekstrand & Damman, 2016).
Interruptions in an office environment may take many different formats including e-mails, telephone calls, background noises and initiation of a conversation by co-workers (Wajcman & Rose, 2011). Whilst interruptions, if directly connected to their own work, can have a positive impact on worker performance (Mark, Gudith, & Klocke, 2008) they can also be seen as a distraction and can impact on office occupiers’ performance (Haynes, 2008), and ability to focus on the task at hand (Altmann, Trafton, & Hambrick, 2014). In addition, office occupiers can respond differently to interruptions with some office occupiers being more tolerant to interruptions than others (Furnham & Strbac, 2002). To ensure minimum disruption to worker performance there is a requirement to provide the office worker with an element of control (Marquardt, Veitch, & Charles, 2002; Peterson & Beard, 2004).
One of the major factors that can impact on office occupier’s ability to focus and concentrate is office noise (Frontczak et al., 2012). Constant background office noise can impact on people in many ways including physiological effects such as headaches and tiredness (Rasila & Jylhä, 2015). In addition, background noise can also lead to feeling of frustration and increased levels of stress (Seddigh et al., 2014) so there are clearly benefits to providing individual workspaces that support focused concentration by reducing distractions and interruptions (Heerwagen et al., 2004). However, care needs to be taken with generalisation as the impact of noise may not be the same for all people. Extroverts may react differently to introverts and certain levels of sound may enhance creativity (Oseland, 2015).
Whilst interactions and distractions can have a negative impact on office occupiers engaged in work that requires focus and concentration, it is argued that the benefit of an open working environments is that such interactions can lead to knowledge creation and knowledge exchange. However, the challenge is to create balance so that both concentrated focused work and interactive collaborative work can coexist without impacting on each other's performance (Haynes & Price, 2004). As one person’s interaction is another person’s distraction (Haynes & Price, 2004).
Interactions can be either planned or unplanned activities which can occur in either formal meetings or by just bumping into a colleague in the corridor or at the photocopy machine (Fayard & Weeks, 2007; Haynes, 2005). It could be argued that the accidental face-to-face meeting can lead to a chance conversation which could lead to an innovative idea (Appel-Meulenbroek, de Vries, & Weggeman, 2016). Once again there is a need to balance between how office environments work ensuring an effective flow of communication within the office environment, and ensuring an opportunity exists for conversations to occur through serendipity (Peponis et al., 2007).
6 There is a need to establish how the office environment works on a dynamic level by understanding the interactions and flow of information in the office environment. It is therefore possible to strategically position within the office environment informal interaction points such as printers, photocopiers, water-coolers and kitchens to facilitate social interaction which could lead to serendipitous conversations (Fayard & Weeks, 2007; Haynes, 2005). However, care needs to be taken in positioning of these informal interaction points so that they are not positioned in the wrong location, as they can cause both visual and auditory distraction (Fayard & Weeks, 2007). Increasing the number of social interactions can lead to a development in knowledge creation and knowledge transfer leading to accelerated innovation (Oseland, Marmot, Swaffer, & Ceneda, 2011). Using social interactions as a way of increasing knowledge creation can be particularly useful for dynamic firms which need a high degree of organizational agility to respond to the rate of change within their sector (Appel-Meulenbroek et al., 2016; Becker, 2007).
The traditional approach to measuring productivity is usually a ratio of output and input. The definition of input and output of office worker productivity are dependent on the specific work processes (De Been, Van der Voordt, & Haynes, 2016). When it comes to office environments these definitions are more complex as quantifying the output of an office worker is not always possible (Haapkangas et al 2018). Therefore, adopting a self-assessed measure of productivity offers a pragmatic approach whilst also providing the opportunity to obtain the occupiers view point in the data collection process. This is approach has been adopted by other researchers that have evaluated office environments and productivity (De Been & Beijer, 2014; Haapakangas, Hallman, Mathiassen, & Jahncke, 2018; Kim, Candido, Thomas, & de Dear, 2016; Van der Voordt, 2004). However, gaps exist in the current literature relating to the ability to establishing office occupier needs based on profiling their work activity and location flexibility.
Method Procedure
A web-based questionnaire was developed to assess the way that workers used the office environment and the impact that it had on their perceptions of their own productivity. A link to the survey was sent to built environment professionals in the Middle East, using the membership databases of the Royal Institution of Chartered Surveyors and the Middle East Council for Offices. These members then circulated the survey link to the workers in their office place. The survey was made available to respondents from 1 November 2015 to 31 January 2016.
Participants
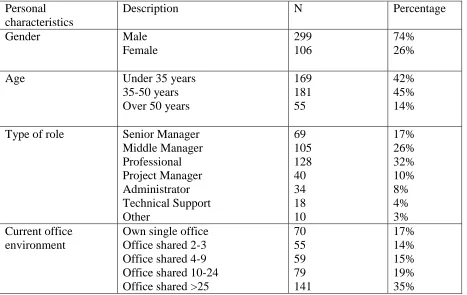
7 third of these in an environment with more than 25 colleagues (35%). This is likely to be an open-plan office environment where workstations are demarcated with low or high partitions. Only 17% of the sample occupied their own single office.
Measures
To measure the location-flexibility of workers, respondents were asked to define the amount of flexibility they had to work where, when and how they wished, with a 5-point Likert scale ranging from Very low to Very high. In answering this question, respondents are likely to take a number of different factors into consideration such as the availability of the range of areas for them to work, as well as the management style or organisational culture that supports such flexibility. In terms of measuring the types of activities that workers completed, respondents were asked to think about the way that they currently work, using an average week, to classify the percentage of time that they worked with colleagues at their desk on collaborative tasks and following this the percentage of time working on their own on focus tasks. Responses to both of these activity-type questions were gathered on a 5-point scale from 0-20% to 81-100%. Again the interpretations of these questions could include having the physical space to undertake this type of work at their desk, whether such tasks are necessary for the role, as well as if one particular type of task is supported more through the organisational culture. As is the nature of social science research, respondents have a range of experiences to draw upon in their interpretation of questions, and it is this experience that enriches the potential explanations of results.
Respondents were also asked to give their perceptions about a range of office Indoor Environmental Quality (IEQ) conditions in terms of how it affected their productivity, and were based upon the Post-Occupancy Evaluation survey developed by Kim and de Dear (2013). Using a 5-point Likert scale from a 'Very negative' to a 'Very positive' impact on their productivity, respondents were asked to rate the effect of a range of office facilities, such as quiet areas, storage space and position relative to colleagues; environmental conditions, such as lighting, temperature and cleanliness; and other office interaction variables such as visual and acoustic privacy, interruptions and work interaction.
The items displayed good reliability with a Cronbach's alpha of 0.934. It is generally accepted that an alpha value of 0.7 and above (Nunnally, 1978) tends to be used in most psychological testing.
Analytical Procedure
8 true of the population or a result of the sampling. Results less than 0.05 are statistically significant at the 95% confidence level (Cohen and Cohen, 2008) and were identified using the Tukey HSD post-hoc test in SPSS.
To address Research Question 2, exploring the nature of work activities and the office environment in which they were undertaken, a series of Independent Samples T-Tests were applied between a number of dummy variables and the evaluative IEQ variables. Dummy variables are artificial variables that represent a nominal variable so that more advanced analysis can be undertaken (Suits, 1984). Dummy variables were developed for the time spent on Collaborative tasks and time spent on Focussed tasks in an average week. In this case the percentage of time spent on these types of tasks were divided into Few Tasks (0-20% and 21-40%) and More Tasks (41 - 60%, 61-80% and 81-100%), with 0 for Few Tasks and 1 for More Tasks. Because a 5-point Likert scale was used it was not possible to divide the scale evenly, so it was instead weighted to reflect the nature of the answer options in that more answer options were included in the grouping for those that completed more of the tasks and fewer answer options were included in the grouping that completed less of the types of tasks. This was considered to have the highest validity. Independent Samples T-Tests were applied to calculate whether any differences uncovered between the means of the two samples using the dummy variables can reflect a true difference in the means of the two populations or whether this is merely a result of the samples (Wonnacott and Wonnacott, 1990).
Results Impact of location flexibility on perceived productivity
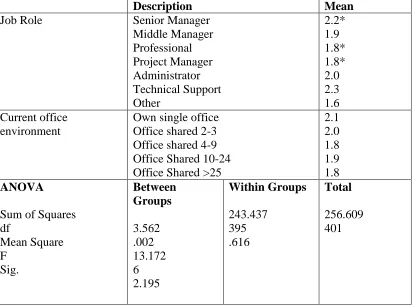
The amount of location-flexibility that workers felt they had to work where, when and how they wished was fairly evenly distributed amongst the 405 participants. 36% were location-fixed; 35% were average-flexibility; and 28% were location-flexible. Using the interval data on the 3- point Likert scale where 1 is Low and 3 is High, the Mean level of location-flexibility was 1.9. Further analysis of this result according to the type of worker and the nature of the current office environment is shown in Table 2. This shows that Technical Support and Senior Managers felt that they had a higher level of location-flexibility (Mean = 2.3 and 2.2) than Professional and Project Managers (Mean = 1.8 and 1.8). Analysis undertaken using a One-way ANOVA and Post Hoc Tests using Tukey's HSD showed that there was a statistically significant difference (p<0.05) between the location-flexibility of the Senior Managers and the Professional/ Project Managers, but not with the Technical Support.
When looking at the type of personal work environment, those occupying a single office felt that they had slightly more location-flexibility about their work than those in other work environments, though this difference was not statistically significant.
9 their workstation (mean =3.19 vs 3.61 and 3.69) and general storage facilities (mean =2.94 vs 3.49 and 3.29) as well as the noise levels in terms of the availability of quiet areas (mean =2.61 vs 3.2 and 3.05), informal meeting spaces (mean =2.86 vs 3.32 and 3.48) and the position of their desk relative to their colleagues (mean =3.27 vs 3.61 and 3.58) and equipment (mean =3.32 vs 3.65 and 3.43).
Many of the IEQ conditions in the office space also had more of a damaging impact on those employees that were location-fixed compared to others that felt that they could choose to work where, when and how they wished. Chart 2 shows that the location-fixed employees felt significantly (p<0.05) that temperature (mean =2.94 vs 3.16 and 3.32), artificial lighting (mean =3.23 vs. 3.54 and 3.56) and ventilation (mean =2.97 vs 3.29 and 3.5) of their workspace were more damaging to their productivity as well as the noise levels from equipment (mean =2.73 vs 3.01 and 3.12) and conversations (mean =2.6 vs 2.89 and 3.01).
Many of the social dynamics of the office environment had a significantly (p<0.05) more harmful impact on those that were location-fixed as well (Chart 3). On the 5-point scale, social interaction (mean =3.42 vs 3.67 and 3.73) and work interaction (mean =3.57 vs 3.75 and 3.84) were rated as having a neutral impact on productivity for those that were location-fixed, but this was significantly lower than those that were location-flexible. Privacy, both visual (mean =2.84 vs 3.22 and 3.37) and acoustic (mean =2.7 vs 3.01 and 3.1), had a much more detrimental impact on the perceived productivity of those that were location-fixed compared to those that were able to work in other locations. Similarly, interruptions (mean =2.29 vs 2.73 and 2.73) and crowding (mean =2.59 vs 2.87 and 3.01) had a significantly negative impact on those that were location-fixed compared to those with the mobility, flexibility and agility to work in a range of locations (average-flexibility and location-flexible).
Impact of the office environment on perceived productivity for different work activities
Focussing specifically on the activities undertaken by the employees at their workstation, respondents were asked to select the percentage of time they spent working with colleagues during an average week on collaborative tasks. 56% of respondents completed Few Collaborative Tasks (0-40%) and 44% completed More Collaborative Tasks (41-100%). In terms of Focussed Tasks undertaken during an average week, 33% of the respondents completed Few Focussed Tasks (0-40%) and 67% (41-100%) completed More Focussed Tasks.
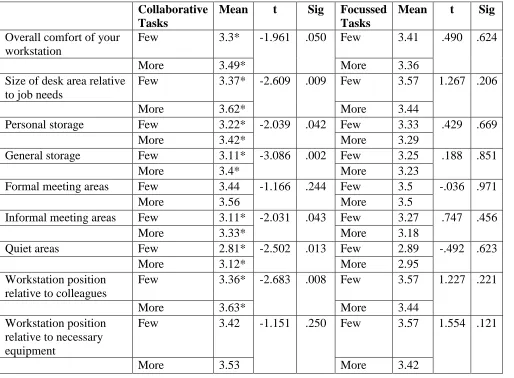
To establish whether the office environment supports different work activities, an Independent Samples T-Test analysis was undertaken to explore the differences in the perceptions of the office environment on productivity according to the nature of activities (collaborative or focussed).
10 at the desk. When the Independent samples T-Test analysis was run on the respondents according to their completion of Focussed tasks, no significant differences were identified, which suggests that these elements of the work environment do not affect the completion of this activity for this particular research sample.
There were also some statistically significant differences (p<0.05) in the views about the IEQ conditions based upon the level of collaborative activities undertaken. Table 4 shows that Indoor Temperature (mean = 2.99 vs. 3.31) and Ability to control immediate working environment (mean = 2.83 vs. 3.2) had a more negative impact on worker's perceived productivity for those undertaking More Collaborative tasks than those undertaking Few Collaborative tasks. This may be the result of the location of the offices in the Middle East where temperatures are higher and there is a greater reliance on air conditioning, so the close proximity of workers when working on collaborative tasks will increase the temperature further, especially if the air-conditioning is not working. There was no statistically significant difference in the impact of noise levels on perceived productivity regardless of whether the employees are completing collaborative tasks with others at the workstation. When analysing this evaluative variable according to the completion of focussed tasks, there were no statistically significant differences which suggests that the environmental conditions have little impact on workers when working alone on such tasks. This is surprising, especially with regard to noise levels, which are needed for concentration.
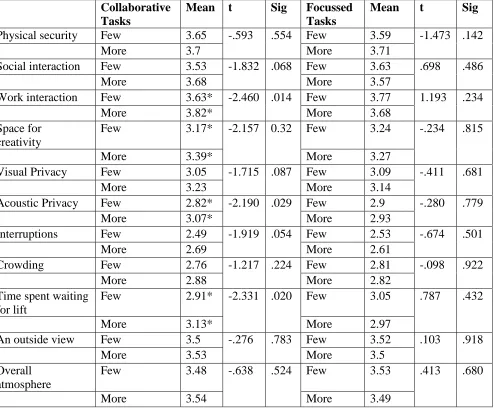
In terms of the social dynamics offered by the office environment, there were also some statistically significant differences (p<0.05) in the perception based upon the activities being undertaken (Table 5). Those undertaking Few Collaborative tasks felt that acoustic privacy (mean = 2.82 vs. 3.07) was slightly more unfavourable to their perceived productivity than those completing More Collaborative tasks. Work interaction was also rated as having an undesirable impact on the perceived productivity of those completing Few Collaborative tasks (mean = 3.63 vs. 3.82) which would suggest that they see this more as a distraction than of value to their work. In contrast there were no statistically significant differences in the social dynamic evaluative variable according to the completion of focussed tasks. The level of acoustic and visual privacy, interruptions and social interaction would have been expected to have more of an impact on those completing focussed tasks in terms of ability to concentrate, however this was not the case for this research sample.
Discussion
Research Question 1: Do office workers with greater location-flexibility feel the office environment is more supportive of their perceived productivity than those that are location-fixed?
An analysis of office workers by job role indicates that senior managers and technical support staff perceive themselves to be the most flexible office workers which supports previous research (Greene & Myerson, 2011; Haynes, 2012). This could be interpreted as the senior managers moving around to potentially interact with their staff and other department colleagues facilitating both team and organisational connectivity (Chadburn, Smith, & Milan, 2017; Haynes, 2012).
11 productivity compared to office workers that had more flexibility (location-flexible). Given that location-fixed office occupiers have little choice but to stay at their desk for the majority of the day means that greater attention needs to be given to the workplace provision for this office type of worker (Morrison & Macky, 2017; Haynes, 2008). Location-fixed office workers identify informal meeting areas and quiet areas as being two particular areas that are having a negative effect on their productivity. This could be interpreted as location-fixed office workers preferring more of this type of space and a desire to switch to these spaces (Appel-Meulenbroek, Groenen, & Janssen, 2011). More informal meeting areas would allow low flexibility workers to interact with their work colleagues in a more relaxed and sociable way (Fayard & Weeks, 2007; Haynes, 2008). This has the potential for serendipitous conversions (Appel-Meulenbroek, de Vries, & Weggeman, 2016; Peponis et al., 2007) and can also provide the opportunity for development of team cohesion (Brennan, Chugh, & Kline, 2002). In addition, quiet areas would allow location-fixed workers with an opportunity to withdraw from their main working environment away from some of the distractions that it brings (Haapakangas, Hongisto, Eerola, & Kuusisto, 2017; Haynes et al., 2017).
The evaluation of the office IEQ conditions also indicates that location-fixed office workers are not as well supported as office workers that are location-flexible. Specifically, the IEQ variables which have the most negative effect were temperature, lighting, ventilation and noise. Office workers that are location-fixed often spend a large part of their day at their desks and are therefore more dependent on the provided IEQ (Bodin Danielsson, Bodin, Wulff, & Theorell, 2015; Kim & de Dear, 2013; Haynes, 2008). In addition, the results indicate that the lack of ability to control their immediate working environment is also impacting on location- fixed office workers (Samani, Rasid, & Sofian, 2015). The impact of noise, from both equipment and people, is affecting location- fixed office worker's perceived productivity in a negative way (Banbury & Berry, 2005; Seddigh, Berntson, Jönsson, Danielson, & Westerlund, 2015). Once again this could be due to the fact that location- fixed office workers cannot remove themselves from a situation and potential of distractions of background noise (Brunia, Been, & van der Voordt, 2016).
12 Whilst there are potential productivity benefits of people working closely together such as team cohesiveness (Brennan et al., 2002), increased interactions (Wohlers & Hertel, 2017), and knowledge exchange (Allen, 1977; Appel-Meulenbroek, 2010; Brennan et al., 2002), these have to be balanced against the productivity penalties such as interruptions (Wajcman & Rose, 2011) and loss of privacy (Bodin Danielsson & Bodin, 2009; Kaarlela-Tuomaala et al., 2009). Combining these results indicates that greater consideration needs to be given to the interactive behaviour of office workers and balancing with optimal workspace provision (Hua, Loftness, Heerwagen, & Powell, 2011).
Research Question 2: Do the office environments provided support the different work activities?
Work activities considered in this research specifically addressed 'collaborative tasks' that require interaction with colleagues at their desks and 'focussed tasks' that required concentration, privacy and being free from distraction (Haynes 2008, Heerwagen, Kampschroer et al. 2004). Time spent on these tasks was assessed across an average week. Across the sample there was a fairly even distribution between those that completed few collaborative tasks at their desk in an average week and those that completed more collaborative tasks and makes for a good analysis of the impact of the office environment across this specific type of work activity. In terms of the focussed tasks, around two-thirds of the sample completed 'more' focussed tasks at their desk during a typical week than 'few' focussed tasks, so the results are somewhat skewed though in terms of face validity it would reflect the type of work undertaken by these office workers.
There were a number of aspects of the office facilities that were found not to support the work activities for those that completed fewer collaborative tasks (e.g. desk size, informal meeting areas and quiet areas). However, all of these facilities had a much more positive impact on the perceived productivity of those that completed more collaborative tasks and suggests that those completing such tasks see the value in the opportunity for interaction that is offered by the office environment and the position relative to colleagues (Allen, Henn 2007). This supports the view of Haynes & Price (2004) who argued that one person’s interaction is another person’s distraction.
This is further supported in the results around the social dynamics offered by the office environment in which those completing more collaborative tasks rated elements such as work interaction and space for creativity, as having more of a positive impact on their productivity than those completing fewer collaborative tasks. Our findings support Fayard & Weeks (2007) and Haynes (2005) studies and indicate the benefits of planned and unplanned interactions in the office environment (Fayard, Weeks 2007, Haynes, 2005).
13 The ability to complete focussed tasks at the desk regardless of the office environment would imply that there is less of a case for moving from your desk for this type of work activity and is in contrast to earlier research (Haynes 2008; Altmann, Trafton et al. 2014; Heerwagen, Kampschroer et al. 2004). Alternatively, it may be the case that these workers are more tolerant to interruptions than others (Furnham, Strbac 2002). The reader must be reminded however, that the result for this type of work activity was not statistically significant.
Limitations and Further Research
The major strength of this study is that it uses a cross-sectional online questionnaire to collect data from a number of offices in different countries in the Middle East. However, adopting such an approach also has several limitations. The data collection is undertaken at one point in time and therefore there is not the opportunity to undertake any longitudinal analysis. In addition, this approach is restricted in establishing causal relationships which would be more the case if an experimental design had been adopted. Therefore, an opportunity exists to undertake further research adopting a three-stage research process research. Stage 1 would be to establish baseline data of perceived productivity within an office environment. Stage 2 would be an intervention which could be the application of ABW. And finally, stage 3 would be a re-evaluation to establish the impact of the intervention.
This study identifies how office environments are not sufficiently aligned to have a positive impact on office worker's perceived productivity based on the activity they undertake. The results indicate a clear need for design to be based on data driven evidence to support an appropriate selection of workstyle taxonomies. We also observe cost driven solutions that do not provide sufficient space to allow high degrees of choice for workers to select a workplace that is suitable for both the task and their work style personality. In some cases, this leads to a ‘musical chairs’ arrangement with frustrations of not being able to find the right setting.
The research is significant as ABW layouts, fuelled by the exponential growth of co-working, are becoming dominant in the workplace. Co-working offers significant scope for further research and evaluation of the connectivity, satisfaction and productivity, innovative design solutions with high volatility of use. This research has confirmed (as in previous studies) the tensions between the benefits of interaction to promote connectivity and the negative impact of interruptions, especially noise, inherent in open and now ABW work settings. The complex dynamics of such environments have their own noise interruption implications which would be a useful area for further study.
14
Using this research and real time data approach should promote environments that recognise individual work style and choices and recognise psychometric tolerances to noise and other environmental factors. In theory, evidence and data led design should promote a tailored choice of appropriate work settings that maximises satisfaction, wellness and in turn productivity because it is meeting the needs of the office workers.
Conclusion
This exploratory research indicates that office workers who spend a large part of their day at their desks perceive their office environment to be having a more negative impact on their productivity than office workers that have the flexibility to work in different parts of the office environment. The office layout results indicate that location -fixed office workers would like more informal meeting areas and more quiet areas. The informal meeting areas would facilitate more social interaction with colleagues, whilst the quiet areas would provide an opportunity for distraction free working. In addition, the negative IEQ results for location-fixed workers, indicates that greater consideration needs to be given to the design, and control, of Indoor Environmental Quality variables. Specifically, noise is one of the variables that location-fixed workers would like to have more control over. The location- fixed office workers reported negatively with regards to the feeling of crowding which can be caused by sitting too close to their colleagues. There is a balance to be struck between respecting and providing individual private space whilst also maintaining team space and collaborative spirit.
The results indicate that the office environment does not support the different work activities. The specific categories of activities investigated were collaborative tasks and focused tasks. The office workers that undertook fewer collaborative tasks reported the need for greater attention to their desk area and also the need for more quiet areas. The office workers that undertook more collaborative tasks report the productivity benefits of having an office environment that facilitates creativity and interaction. However, this study identifies that office occupiers that undertook focused tasks appeared to be more tolerant of interruptions.
Overall, the results indicate a need for greater flexibility with regards to choice of working environment location. Also, there is a need to better align the office environment with the office worker activities. These two needs could potentially be addressed with the application of evidence-based Activity Based Working.
Acknowledgements
Assistance with the data collection, using member databases, and some of the research on which this study is based, was funded and supported by the Royal Institution of Chartered Surveyors (RICS) (Middle East) and Middle East Council for Offices( MECO).
15 Al Horr, Y., Arif, M., Kaushik, A., Mazroei, A., Katafygiotou, M., & Elsarrag, E. (2016).
Occupant productivity and office indoor environment quality: A review of the literature. Building and Environment, 105, 369-389.
doi:http://dx.doi.org/10.1016/j.buildenv.2016.06.001
Allen, T. J., & Henn, G. (2007). The organization and architecture of innovation Routledge.
Altmann, E. M., Trafton, J. G., & Hambrick, D. Z. (2014). Momentary interruptions can derail the train of thought. Journal of Experimental Psychology, 143(1), 215-226.
doi:10.1037/a0030986 [doi]
Appel-Meulenbroek, R., de Vries, B., & Weggeman, M. (2016). Knowledge sharing behavior the role of spatial design in buildings. Environment and Behavior, 0013916516673405.
Appel-Meulenbroek, R., Groenen, P., & Janssen, I. (2011). An end-user's perspective on activity-based office concepts. Journal of Corporate Real Estate, 13(2), 122-135.
Becker, F. (2007). Organizational ecology and knowledge networks. California Management Review, 49(2), 42-61.
Bodin Danielsson, C., & Bodin, L. (2008). Office type in relation to health, well-being, and job satisfaction among employees. Environment and Behavior, 40(5), 636-668.
doi:10.1177/0013916507307459
Bodin Danielsson, C., & Bodin, L. (2009). Difference in satisfaction with office environment among employees in different office types. Journal of Architectural and Planning Research, 26(3), 241-257.
Bodin Danielsson, C., Bodin, L., Wulff, C., & Theorell, T. (2015). The relation between office type and workplace conflict: A gender and noise perspective. Journal of Environmental Psychology, 42(0), 161-171. doi:http://dx.doi.org/10.1016/j.jenvp.2015.04.004
Brennan, A., Chugh, J. S., & Kline, T. (2002). Traditional versus open office design: A longitudinal field study. Environment and Behavior, 34(3), 279-299.
doi:10.1177/0013916502034003001
Brunia, S., Been, I. D., & van der Voordt, T. J. M. (2016). Accommodating new ways of working: Lessons from best practices and worst cases. Journal of Corporate Real Estate, 18(1), 30-47. doi:10.1108/JCRE-10-2015-0028
Chadburn, A., Smith, J., & Milan, J. (2017). Productivity drivers of knowledge workers in the central London office environment. Journal of Corporate Real Estate, 19(2), 66-79. doi:10.1108/JCRE-12-2015-0047
16 de Been, I., Beijer, M., & den Hollander, D. (2015). (2015). How to cope with dilemmas in
activity based work environments: Results from user-centred research. Paper presented at the 14th EuroFM Research Symposium,
Ekstrand, M., & Damman, S. (2016). Front and backstage in the workplace: An explorative case study on activity based working and employee perceptions of control over work-related demands. Journal of Facilities Management, 14(2), 188-202. doi:10.1108/JFM-10-2015-0029
Fayard, A., & Weeks, J. (2007). Photocopiers and water-coolers: The affordances of informal interaction. Organization Studies, 28(5), 605-634. doi:10.1177/0170840606068310
Frontczak, M., Schiavon, S., Goins, J., Arens, E., Zhang, H., & Wargocki, P. (2012).
Quantitative relationships between occupant satisfaction and satisfaction aspects of indoor environmental quality and building design. Indoor Air, 22(2), 119-131. doi:10.1111/j.1600-0668.2011.00745.x
Furnham, A., & Strbac, L. (2002). Music is as distracting as noise: The differential distraction of background music and noise on the cognitive test performance of introverts and extraverts. Ergonomics, 45(3), 203-217. doi:10.1080/00140130210121932
Haapakangas, A., Hallman, D. M., Mathiassen, S. E., & Jahncke, H. (2018). Self-rated
productivity and employee well-being in activity-based offices: The role of environmental perceptions and workspace use. Building and Environment, 145, 115-124
doi:https://doi.org/10.1016/j.buildenv.2018.09.017
Haapakangas, A., Hongisto, V., Eerola, M., & Kuusisto, T. (2017). Distraction distance and perceived disturbance by noise-an analysis of 21 open-plan offices. The Journal of the Acoustical Society of America, 141(1), 127. doi:10.1121/1.4973690 [doi]
Haynes, B. P. (2005). Workplace connectivity: A study of its impact on self-assessed productivity. Unpublished PhD Thesis, Sheffield Hallam University.
Haynes, B. P. (2008). Impact of workplace connectivity on office productivity. Journal of Corporate Real Estate, 10(4), 286-302. doi:10.1108/14630010810925145
Haynes, B. P. (2012). Conversational networks in knowledge offices. In K. Alexander, & I. Price (Eds.), Managing organizational ecologies: Space, management and organization (pp. 201-212) Routledge New York, NY.
Haynes, B. P., Nunnington, N., & Eccles, T. (2017). Corporate real estate asset management: Strategy and implementation (2nd ed.). Oxon and New York: Routledge. doi:ISBN 978-1-13891507-7
17 Heerwagen, J. H., Kampschroer, K., Powell, K. M., & Loftness, V. (2004). Collaborative
knowledge work environments. Building Research & Information, 32(6), 510-528. doi:10.1080/09613210412331313025
Heinzerling, D., Schiavon, S., Webster, T., & Arens, E. (2013). Indoor environmental quality assessment models: A literature review and a proposed weighting and classification scheme. Building and Environment, 70(0), 210-222.
doi:http://dx.doi.org.lcproxy.shu.ac.uk/10.1016/j.buildenv.2013.08.027
Hoendervanger, J. G., Been, I. D., Van, N. W., Mobach, M. P., & Albers, C. J. (2016). Flexibility in use: Switching behaviour and satisfaction in activity-based work
environments. Journal of Corporate Real Estate, 18(1), 48-62. doi:10.1108/JCRE-10-2015-0033
Kim, J., Candido, C., Thomas, L., & de Dear, R. (2016). Desk ownership in the workplace: The effect of non-territorial working on employee workplace satisfaction, perceived productivity and health. Building and Environment, 103, 203-214.
doi:http://dx.doi.org/10.1016/j.buildenv.2016.04.015
Kim, J., & de Dear, R. (2013). Workspace satisfaction: The privacy-communication trade-off in open-plan offices. Journal of Environmental Psychology, 36(0), 18-26.
doi:http://dx.doi.org/10.1016/j.jenvp.2013.06.007
Mark, G., Gudith, D., & Klocke, U. (2008). (2008). The cost of interrupted work: More speed and stress. Paper presented at the Proceedings of the SIGCHI Conference on Human Factors in Computing Systems, 107-110.
Marquardt, C. J., Veitch, J. A., & Charles, K. E. (2002). Environmental satisfaction with open-plan office furniture design and layout Institute for Research in Construction.
Morrison, R. L., & Macky, K. A. (2017). The demands and resources arising from shared office spaces. Applied Ergonomics, 60, 103-115
doi:https://doi-org.lcproxy.shu.ac.uk/10.1016/j.apergo.2016.11.007
Nunnally, J. C. (1978) Psychometric theory (2nd ed.) McGraw-Hill: New York.
Oldham, G. R., & Rotchford, N. L. (1983). Relationships between office characteristics and employee reactions: A study of the physical environment. Administrative Science Quarterly, 28(4), 542-556. doi:10.2307/2393008
Oseland, N; Hodsman, P (2015) Planning for Psychoacoustics: A Psychological Approach to Resolving Office Noise Distraction. Research Report, April 2015. Workplace Unlimited
18 Parker, L. D. (2016). From scientific to activity-based office management: A mirage of change.
Journal of Accounting & Organizational Change, 12(2), 177-202. doi:10.1108/JAOC-01-2015-0007
Peponis, J., Bafna, S., Bajaj, R., Bromberg, J., Congdon, C., Rashid, M., . . . Zimring, C. (2007). Designing space to support knowledge work. Environment and Behavior, 39(6), 815-840. doi:10.1177/0013916506297216
Peterson, T. O., & Beard, J. W. (2004). Workspace technology's impact on individual privacy and team interaction. Team Performance Management, 10(7), 163-172.
doi:10.1108/13527590410569887
Rasila, H., & Jylhä, T. (2015). The many faces of office noise – case contact center. Facilities, 33(7), 454-464. doi:10.1108/F-11-2013-0085
Samani, S. A. (2015). The impact of personal control over office workspace on environmental satisfaction and performance. Journal of Social Sciences and Humanities, 1(3), 163-175.
Seddigh, A., Berntson, E., Bodin Danielsson, C., & Westerlund, H. (2014). Concentration requirements modify the effect of office type on indicators of health and performance. Journal of Environmental Psychology, 38(0), 167-174.
doi:http://dx.doi.org.lcproxy.shu.ac.uk/10.1016/j.jenvp.2014.01.009
Skogland, M. A.,Chatarina. (2017). The mindset of activity-based working. Journal of Facilities Management, 15(1), 62-75. doi:10.1108/JFM-05-2016-0016
Suits, Daniel B. (1984) Dummy Variables: Mechanics V. Interpretation, The Review of
Economics and Statistics, Vol. 66, No. 1 (Feb., 1984), pp. 177-180 DOI: 10.2307/1924713
Sundstrom, E., Town, J. P., Brown, D. W., Forman, A., & Mcgee, C. (1982). Physical enclosure, type of job, and privacy in the office. Environment and Behavior, 14(5), 543-559.
doi:10.1177/0013916582145003
Wajcman, J., & Rose, E. (2011). Constant connectivity: Rethinking interruptions at work. Organization Studies, 32(7), 941-961. doi:10.1177/0170840611410829
Wohlers, C., Hartner-Tiefenthaler, M., & Hertel, G. (2017). The relation between activity-based work environments and office workers’ job attitudes and vitality. Environment and
Behavior, 0013916517738078. doi:10.1177/0013916517738078
Wohlers, C., & Hertel, G. (2017). Choosing where to work at work – towards a theoretical model of benefits and risks of activity-based flexible offices. Ergonomics, 60(4), 467-486.
doi:10.1080/00140139.2016.1188220
19 Table 1. Sample Characteristics
Personal characteristics
Description N Percentage
Gender Male
Female
299 106
74% 26%
Age Under 35 years
35-50 years Over 50 years
169 181 55
42% 45% 14%
Type of role Senior Manager Middle Manager Professional Project Manager Administrator Technical Support Other
69 105 128 40 34 18 10
17% 26% 32% 10% 8% 4% 3% Current office
environment
Own single office Office shared 2-3 Office shared 4-9 Office shared 10-24 Office shared >25
70 55 59 79 141
20 Table 2. ANOVA for level of location-flexibility to work where, when and how you like (Scale from low 1 - 5 high).
* p<0.05 Tukey HSD
Description Mean
Job Role Senior Manager
Middle Manager Professional Project Manager Administrator Technical Support Other
2.2* 1.9 1.8* 1.8* 2.0 2.3 1.6 Current office
environment
Own single office Office shared 2-3 Office shared 4-9 Office Shared 10-24 Office Shared >25
2.1 2.0 1.8 1.9 1.8 ANOVA
Sum of Squares df
Mean Square F
Sig.
Between Groups
3.562 .002 13.172 6 2.195
Within Groups
243.437 395 .616
Total
22 Chart 1 ANOVA for level of location-flexibility and impact of facilities on perceived productivity (Scale from negative impact 1 - 5 positive impact). * p<0.05 Tukey HSD
0.00 0.50 1.00 1.50 2.00 2.50 3.00 3.50 4.00 4.50 5.00 Lo cat ion -f ixe d * Av era ge -f le xib ility Locat ion -f le xib le Lo cat ion -f ixe d * Av era ge -f le xib ility Lo cat ion -f le xib le Lo cat ion -f ixe d * Av era ge -f le xib ility Lo cat ion -f le xib le Lo cat ion -f ixe d * Av era ge -f le xib ility Lo cat ion -f le xib le Locat ion -f ixe d * Av era ge -f le xib ility Lo cat ion -f le xib le Lo cat ion -f ixe d * Av era ge -f le xib ility Lo cat ion -f le xib le Lo cat ion -f ixe d * Av era ge -f le xib ility Lo cat ion -f le xib le Lo cat ion -f ixe d * Aver age -fle xibil ity Lo cat ion -f le xib le Lo cat ion -f ixe d * Av era ge -f le xib ility Lo cat ion -f le xib le Overall comfort of your workstation (F= 14.86, Sig 0)
Size of your desk area relative to
23 Chart 2. ANOVA for level of location-flexibility and impact of environmental conditions on perceived productivity (Scale from negative impact 1 - 5 positive impact). * p<0.05 Tukey HSD
0.00 0.50 1.00 1.50 2.00 2.50 3.00 3.50 4.00 4.50 5.00 Locat ion -f ixe d * Av era ge -f le xib ility Locat ion -f le xib le Lo cat ion -f ixe d * Aver age -fle xibil ity Lo cat ion -f le xib le Lo cat ion -f ixe d * Av era ge -f le xib ility Lo cat ion -f le xib le Lo cat ion -f ixe d * Av era ge -f le xib ility Lo cat ion -f le xib le Lo cat ion -f ixe d * Av era ge -f le xib ility Lo cat ion -f le xib le Lo cat ion -f ixe d * Av era ge -f le xib ility Lo cat ion -f le xib le Lo cat ion -f ixe d * Av era ge -f le xib ility Lo cat ion -f le xib le Lo cat ion -f ixe d * Av era ge -f le xib ility Lo cat ion -f le xib le Indoor temperature (F=6.61, Sig=0.001)
Quality of natural lighting (F=6.899,
Sig=0.001)
Quality of artificial lighting (F=5.548,
Sig=0.004)
Ventilation (F=8.248, Sig=0)
Ability to control immediate
working environment (temp, vent, light)
(F=6.317, Sig=0.002)
Internal noise (equip & phones)
(F=4.459, Sig=0.012)
Internal noise (convs & people
24 Chart 3 ANOVA for level of location-flexibility and impact of social dynamics on perceived productivity (Scale from negative
impact 1 - 5 positive impact). * p<0.05 Tukey HSD
0.00 0.50 1.00 1.50 2.00 2.50 3.00 3.50 4.00 4.50 5.00 Lo cat ion -f ixe d * Av era ge -f le xib ility Lo cat ion -f le xib le Lo cat ion -f ixe d * Aver age -fle xibil ity Lo cat ion -f le xib le Lo cat ion -f ixe d * Av era ge -f le xib ility Lo cat ion -f le xib le Lo cat ion -f ixe d * Av era ge -f le xib ility Lo cat ion -f le xib le Lo cat ion -f ixe d * Av era ge -f le xib ility Lo cat ion -f le xib le Lo cat ion -f ixe d * Av era ge -f le xib ility Lo cat ion -f le xib le Lo cat ion -f ixe d * Av era ge -f le xib ility Lo cat ion -f le xib le Lo cat ion -f ixe d * Av era ge -f le xib ility Lo cat ion -f le xib le Indoor temperature (F=6.61, Sig=0.001) Quality of natural lighting (F=6.899, Sig=0.001) Quality of artificial lighting (F=5.548, Sig=0.004) Ventilation (F=8.248, Sig=0)
Ability to control immediate working environment (temp, vent, light) (F=6.317, Sig=0.002) Internal noise (equip & phones)
(F=4.459, Sig=0.012)
Internal noise (convs & people
25 Table 3. Independent samples T Test for Types of Activities and impact of facilities on perceived productivity (Scale from negative impact 1 - 5 positive impact). * p<0.05
Collaborative Tasks
Mean t Sig Focussed
Tasks
Mean t Sig
Overall comfort of your workstation
Few 3.3* -1.961 .050 Few 3.41 .490 .624
More 3.49* More 3.36
Size of desk area relative to job needs
Few 3.37* -2.609 .009 Few 3.57 1.267 .206
More 3.62* More 3.44
Personal storage Few 3.22* -2.039 .042 Few 3.33 .429 .669
More 3.42* More 3.29
General storage Few 3.11* -3.086 .002 Few 3.25 .188 .851
More 3.4* More 3.23
Formal meeting areas Few 3.44 -1.166 .244 Few 3.5 -.036 .971
More 3.56 More 3.5
Informal meeting areas Few 3.11* -2.031 .043 Few 3.27 .747 .456
More 3.33* More 3.18
Quiet areas Few 2.81* -2.502 .013 Few 2.89 -.492 .623
More 3.12* More 2.95
Workstation position relative to colleagues
Few 3.36* -2.683 .008 Few 3.57 1.227 .221
More 3.63* More 3.44
Workstation position relative to necessary equipment
Few 3.42 -1.151 .250 Few 3.57 1.554 .121
26 Table 4. Independent samples T Test for Types of Activities and impact of environmental conditions on perceived productivity (Scale from negative impact 1 - 5 positive impact). * p<0.05
Collaborative Tasks
Mean t Sig Focussed
Tasks
Mean t Sig
Indoor temperature Few 2.99*
-2.936
.004 Few 3.16 .383 .702
More 3.31* More 3.12
Quality of natural lighting Few 3.47 -.979 .328 Few 3.52 .084 .933
More 3.57 More 3.51
Quality of artificial lighting
Few 3.39 -.924 .356 Few 3.41 -.345 .730
More 3.48 More 3.44
Ventilation Few 3.14
-1.924
.055 Few 3.27 .567 .571
More 3.35 More 3.21
Ability to control immediate working environment (temp, vent, light)
Few 2.83*
-3.072
.002 Few 3.08 1.209 .228
More 3.2* More 2.94
Internal noise (equip & phones)
Few 2.86
-1.693
.091 Few 2.95 .149 .881
More 3.05 More 2.93
Internal noise (convs & people movement)
Few 2.74
-1.660
.098 Few 2.81 -.065 .948
More 2.92 More 2.82
External noise (traffic & people)
Few 3.3 1.032 .303 Few 3.27 .152 .879
More 3.19 More 3.25
Overall office comfort Few 3.35 -1.855
.064 Few 3.46 .442 .659
27 Table 5. Independent samples T Test for Types of Activities and impact of social dynamics on perceived productivity (Scale from negative impact 1 - 5 positive impact). * p<0.05
Collaborative Tasks
Mean t Sig Focussed Tasks
Mean t Sig
Physical security Few 3.65 -.593 .554 Few 3.59 -1.473 .142
More 3.7 More 3.71
Social interaction Few 3.53 -1.832 .068 Few 3.63 .698 .486
More 3.68 More 3.57
Work interaction Few 3.63* -2.460 .014 Few 3.77 1.193 .234
More 3.82* More 3.68
Space for creativity
Few 3.17* -2.157 0.32 Few 3.24 -.234 .815
More 3.39* More 3.27
Visual Privacy Few 3.05 -1.715 .087 Few 3.09 -.411 .681
More 3.23 More 3.14
Acoustic Privacy Few 2.82* -2.190 .029 Few 2.9 -.280 .779
More 3.07* More 2.93
Interruptions Few 2.49 -1.919 .054 Few 2.53 -.674 .501
More 2.69 More 2.61
Crowding Few 2.76 -1.217 .224 Few 2.81 -.098 .922
More 2.88 More 2.82
Time spent waiting for lift
Few 2.91* -2.331 .020 Few 3.05 .787 .432
More 3.13* More 2.97
An outside view Few 3.5 -.276 .783 Few 3.52 .103 .918
More 3.53 More 3.5
Overall atmosphere
Few 3.48 -.638 .524 Few 3.53 .413 .680