Statistically does Peer Assisted Learning make a
difference on Engineering Degree Programme in the UK?
HETL Scotland 2017
NORTCLIFFE, Anne <http://orcid.org/0000-0001-6972-6051>, PARVEEN,
Sajhda and PINK-KEECH, Cathy
Available from Sheffield Hallam University Research Archive (SHURA) at:
http://shura.shu.ac.uk/16813/
This document is the author deposited version. You are advised to consult the
publisher's version if you wish to cite from it.
Published version
NORTCLIFFE, Anne, PARVEEN, Sajhda and PINK-KEECH, Cathy (2019).
Statistically does Peer Assisted Learning make a difference on Engineering Degree
Programme in the UK? HETL Scotland 2017. Journal of applied research in higher
education.
Copyright and re-use policy
See
http://shura.shu.ac.uk/information.html
Statistically, does Peer Assisted Learning make a difference on a UK Engineering
Degree Programme? HETL Scotland 2017
Anne Nortcliffe, Sajhda Parveen and Cathy Pink-Keech
Department of Engineering and Maths, Sheffield Hallam University
Accepted to be published in Journal of Applied Research in Higher Education
Abstract
British Black Minority Ethnic (BME) students are nationally underachieving in comparison to their Ethnic Chinese and White peers; typically there is a 16% graduate attainment gap in the UK (Equality Challenge Unit, 2015). Previous research has suggested that the attainment gap could be explained by BME students’ lack of sense of belonging; disengagement; typically commuting from their family home to University; typically have part-time employment. Peer assisted learning (PAL) has been shown to have a positive impact on addressing and resolving students’ alienation and disengagement. However, a question still remains regarding whether student perceptions hold up to statistical analysis of learning performance when scrutinised in comparison to similar cohorts without PAL interventions.
This paper presents the results of a statistical study for two cohorts of students on engineering courses with a disproportionately high representation of BME students. The research method undertook a statistical analysis of student records for the two cohorts to ascertain whether there are patterns of correlation between PAL, student ethnicity and student parental employment upon student academic performance and placement attainment. Student family employment background has also been shown to influence student engagement and retention on educational studies.
Previous research evaluations of peer assisted learning programmes have focused on quantitative study of students’ surveys and qualitative semi-structured research interviews with students on their student engagement and learning experience. Whereas this paper evaluates the intervention from a quantitative statistical analysis of the student records to evaluate the impact peer assisted learning has on a cohort’s academic performance and placement attainment in comparison to different social categories (classifications). The results are compared against another cohort with a similar student profile who have not used PAL. The analysis of results of the two cohorts indicate that PAL does not significantly impact academic performance; however PAL appears to have a positive impact upon the placement attainment for BME students and students with parents in non-managerial/professional employment.
Keywords
BME Attainment Gap, Peer Assisted Learning, Placement Learning, Social economics of learning
Introduction
typically around 16% (Connor et al., 2004; Richardson, 2015,Berry and Loke, 2011). British Black and Minority Ethnic (BME) students are nationally underachieving in comparison to their ethnic Chinese and White peers. National UK statistics results concur with previous research, and conclude that the difference is 16% between white, and BME students in attaining first and upper second class honours (Equality Challenge Unit, 2015). Consequently, the higher education sector is under pressure to identify and understand the cause of the BME attainment gap, but more importantly how to address the attainment gap and support the attainment of all (complete diverse student body) students.
BME students are in particular at risk of becoming 'outcasts on the inside’ by missing the social and cultural advantages bestowed by a higher education (Redmond, 2006). Non-Caucasian respondents reported the lack of sense of belonging was the primary factor for leaving their engineering course (Marra et al, (2012). According to Singh (2011, 2012) this attainment gap could be explained by BME student disengagement. The notion of student engagement has received much attention within UK higher education sector over the years, particularly in assuring and enhancing academic quality (Quality Assurance Agency 2012). Student integration into University life is critical to student engagement and attainment, yet BME students frequently report being isolated, lonely (Cotton et al, 2016) and experience derisory support (NUS, 2011). BME students that are more likely to commute to University, are less likely to engage in extra curriculum activities (Page et al, 2016), and are more focused on family, part-time employment, religious and solitary activities. These isolation factors have been observed elsewhere in higher education research with other minority student groups; mature and students from low social economic background, (Stuart et al, 2011).
All minority groups reported experiencing dislocation and loss of sense of belonging, (Bowl, 2001). Wilson’s (1997) observations of mature students found the students are often juggling their studies with family and part-time employment commitments, resulting in social student isolation. BME students who have multiple responsibilities in addition to studying; work and family have similar issues (Kimura, 2014). Equally, students from low social economic backgrounds are more likely engaged in part-time employment than extra curriculum activities, (Stuart et al, 2011), reducing the opportunity to bond with their peers. Extra curriculum activities whether course related, student union societies, volunteering and team sports have been shown to enhance student learning, engagement, experience and employability, (Stuart et al, 2009). It should be noted that low social economic family backgrounds are associated with students with non-managerial/professional parents, Goldthorpe (2004). Rumberger (1983) noted that family social economic background influences student retention with families from a higher social economic background encouraging students to complete their studies.
aided student retention and recruitment to engineering (Angelini, 2011). Alumni mentoring programmes have been shown to improve retention and attainment of diverse student groups (Newton and Wells-Glover, 2000). Also, the alumni value the opportunity to ‘give back’ to their alma mater (Sword, 2002). PAL appears to be a suitable approach and has been shown to have a positive effect (Nortcliffe, Keech and Evans, 2014). A summary report of the students’ reflections of the peer learning approach indicates that peer assisted learning had a positive effect upon their personal development (Nortcliffe, and Pink-Keech, 2017). This paper presents statistical evidence to support the impact of PAL.
Peer Learning Approach and Evaluation Methods
To address the BME attainment gap in the engineering department, it was decided by the Faculty Learning, Teaching and Assessment team that PAL (as has been shown to develop student learning) would be piloted in engineering on a course with significant BME attainment gap and significant number of BME students. The peer learning approach that was adopted and implemented adhered to good practice as reported by Kane and Sinka (2009). The PAL programme took an inclusive approach that is all 1st year students had the opportunity to attend timetabled bi-weekly classes with the volunteer 2nd year PAL leaders. The aim of the sessions was to supplement and support the 1st year students course learning on the more challenging aspects of the course (as identified by the PAL leaders) and develop their employability skills. Also, the sessions aimed to facilitate general learning in an informal and supportive environment. PAL sessions took place in generic teaching spaces.
The PAL leaders were volunteers, two of the PAL leaders were non-BME and two were BME students. The benefits of being a PAL leader has been shown to aid their subject learning and employability skills development, iBid. The PAL leaders were trained each year over 2 days at the start of the academic year. Each of their PAL sessions during the academic year were observed and followed with a debriefing session. Also, during these debriefing sessions the PAL leaders received support in planning their next sessions
This paper focuses on a statistical research approach to evaluate the impact of PAL on a cohort of students. Also, to suggest the conclusions that can be drawn from an institution and wider higher education sector perspective in addressing the BME attainment gap. The statistical study has sought to measure and compare the impact PAL had on the course outcomes in comparison to a course with a similar student profile that did not have a PAL innovation implementation.
hypothesis is defined that there is no significant attainment gap between the two-social category attainment means, for p>0.05. The alternative hypothesis is defined for p<0.05, therefore the probability provides reasonable evidence to reject the null hypothesis, and suggest there is an attainment gap between two social categories. The data sets in this paper have two tails and are heteroscedastic; as academic performance for each individual is affected by many known and unknown variables, for example part-time employment, commuting, and/or family commitments, etc.
In addition, Bows and Whisker method has also been applied to the data sets to enable an observational critical analysis of the data to identify commonality in data sets and abnormalities differences between the data sets, i.e. differences in academic performance between the different social categories in each cohort not identifiable in the statistics data.
In agreement with the Institution's Research Policy and Practice all the research data was anonymised, to maintain student confidentiality. The reported data outputs from the research analysis are homogenised to provide an extra layer of anonymization and confidentiality, ensuring no individual student can be identified.
Statistical Results Analysis
The two courses analysed are engineering based. The two courses that have been compared are in the same department, both have roughly similar demographics and both course have been identified as having high BME attainment gaps. Other courses in the same department at the same time had very different student demographics, i.e. very few BME students to provide significant evidence on the BME attainment gap. The study involves one course with a 2014 cohort studying mechanical systems. This cohort did not receive a PAL opportunity. The other course was a 2013 cohort studying a computer, electronic, and electrical engineering where PAL was made available to the students. Each course required the same pre-entry qualification requirements. Typically on both courses the student profile is roughly similar a mix of conventional pre-University qualifications; British A' levels (Maths/Physics, science and other (language, humanities, etc.,), BTEC Engineering, BTEC Applied Science, Preparatory Engineering and Maths HE courses or BTEC ACCESS qualifications for both courses. This study does not analyse student performance per entrance qualifications, as each course accepts numerous different types of qualifications, therefore the validity of any statistical analysis would be questionable as the resultant data sets are insignificant numbers (statistically). The statistical profiles focused in this paper for each course are shown in Table 1-9; note the statistical analysis of gender was not explored, as there were an insignificant number (statistically) of females enrolled on the courses. The status of students’ parent’s occupation was ascertained from the student’s description of their parent’s occupation in their student records oppose to using the student’s self-selection of parental socioeconomic classification data in their student’s records. As the latter was found to be inconsistent that is student’s self-selected socioeconomic classification did not tie with the student’s actual description of their parents’ employment. In addition both courses are sandwich degrees where all students are supported, developed and encouraged to secure a year-long placement/internship opportunity to start at the end of the 2nd year course of study.
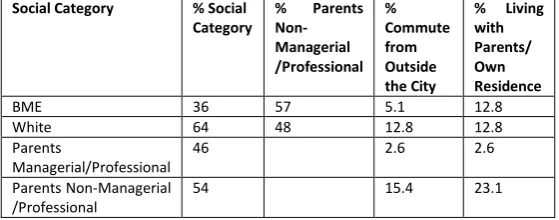
TABLE 1: NON-PAL 2014 COHORT SOCIAL CATEGOIES (37 STUDENTS ENROLLED, (EXCLUDES 2 INTERNATIONAL STUDENTS), 10 STUDENTS BORN OUTSIDE OF THE UK, 2 FEMALE STUDENTS)
Social Category % Social Category
% Parents Non-Managerial /Professional % Commute from Outside the City
% Living with Parents/ Own Residence
BME 36 57 5.1 12.8
White 64 48 12.8 12.8
Parents
Managerial/Professional
46 2.6 2.6
Parents Non-Managerial /Professional
54 15.4 23.1
TABLE 2: NON-PAL 2014 COHORT ENROLMENT STATUS (37 STUDENTS ENROLLED, (EXCLUDES 2 INTERNATIONAL STUDENTS), 10 STUDENTS BORN OUTSIDE OF THE UK, 2 FEMALE STUDENTS)
Social Category No. Non-Engaged & Failed 1st year twice (less 120 credits)
No. Engaged & Failed 1st year once (less 120 credits) (Passed on 2nd attempt)
No. Passed 1st year & with-draw after 1st year
No. Failed 2nd year (less 120 credits)
No. Passed 2nd year & with-draw after 2nd year
BME 0 1 0 2 0
White 4 1 1 1 1
Parents Managerial /Professional
2 1 1 2 1
Parents
Non-Managerial /Professional
2 1 0 1 0
For the Non-Pal 2014 cohort, the social category makeup is shown in Table 1, the cohort is a diverse set of students. 89% of the records of the students’ indicate that their home residence was a Northern or Midlands industrial city or town. However 1 non-BME student was from rural North Wales, 1 non-BME student was from rural South West, 1 BME and 1 non-BME students are from Near Greater London. Table 2 highlights that 10% of the students disengaged in their course of study. It is noted that the students primarily leaving the course are white. The remaining cohort is a more equal diverse social mix of students. Also, Table 2 shows the remaining students are typically from low social economic parental homes (their parents are Non-Managerial/Professionals, aka semi-skilled, unemployed or students themselves) and commute from outside the city and live with their parents or their own residence regardless of their ethnicity. Only one of the commuting students was one of the students who disengaged from their studies and failed the 1st year, twice. One of the non-BME students from near greater London also left the course in the first year. The BME student from near greater London is also academically underperforming.
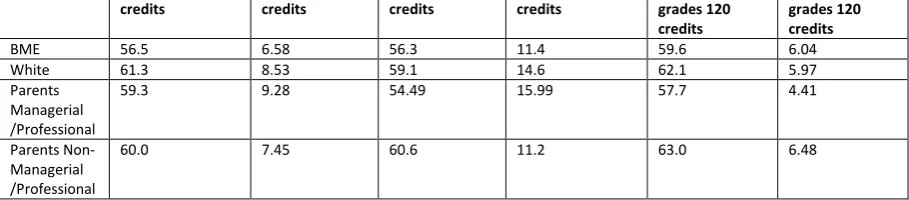
TABLE 3: NON-PAL 2014 COHORT ASSESMENT PERFORMANCE (33 1ST YEAR STUDENTS (EXCLUDES 4 STUDENTS WHO NON-ENGAGED AND FAILED 1ST YEAR TWICE AND 2 INTERNATIONAL STUDENTS), 30 2ND YEAR STUDENTS (EXCLUDES 1 STUDENT WHO PASSED 1ST YEAR AND WITHDREW AND 2 INTERNATIONAL STUDENTS), (INCLUDES 10 STUDENTS BORN OUTSIDE OF THE UK, 2 FEMALE STUDENTS)) Social
Category
% Mean 1st year grades 120
Std 1st year grades 120
% Mean 2nd year grades 120
Std 2nd year grades 120
% Mean 3rd year & No Placement
[image:6.595.67.394.306.447.2]credits credits credits credits grades 120 credits
grades 120 credits
BME 56.5 6.58 56.3 11.4 59.6 6.04
White 61.3 8.53 59.1 14.6 62.1 5.97
Parents Managerial /Professional
59.3 9.28 54.49 15.99 57.7 4.41
Parents Non-Managerial /Professional
[image:7.595.67.522.73.173.2]60.0 7.45 60.6 11.2 63.0 6.48
TABLE 4: NON-PAL 2014 COHORT LEARNING ATTAINMENT T TEST ANAYLSIS (M/P IS MANAGERIAL/PROFESSIONAL, NON-M/P IS NON- MANAGERIAL/PROFESSIONAL) Social Category T.Test Heteroscedastic, σ=0.05 BME 1st year BME 2nd year BME 3rd year Parents M/P 1st year
Parents M/P 2nd year
Parents M/P & No-Placement 3rd year
Parents Non- M/P 1st year
Parents M/P 2nd year
Parents Non- M/P & No-Placement 3rd year
White 1st year 0.09 0.39 0.61
White 2nd year 0.26 0.24 0.90
White 33d year 0.51 0.57 0.84
Parents Non-M/P 1st year
0.20 0.82
Parents Non-M/P 2nd year
0.33 0.27
Parents Non-M/P & No-Placement 33d year
0.43 0.23
Parents M/P 1st year
0.39
Parents M/P 2ndyear
0.87
Parents M/P & No-Placement 3rd year
0.57
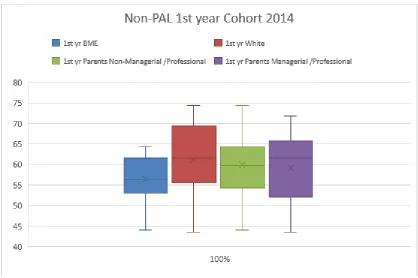
FIGURE 1: BOX AND WHISKERS PLOT OF NON- PAL 1ST YEAR COHORT ACADEMIC PERFORMANCE RESULTS FOR DIFFERENT SOCIAL CATEGORIES
It is also noted at the end of second year course of study for 2014 Non-PAL Cohort the students with parents in managerial or professional role are slightly underperforming in comparison to their peers, according to statistical mean and median, Figure 2. However, Figure 2 shows that the academic performance across all categories actually has become more homogeneous, typical the mean academic performance is 2(ii) (50-60%) for each social category. It should be noted there has been no pedagogy interventions other than that the academic course team have been working closely together to ensure the student learning and experience.
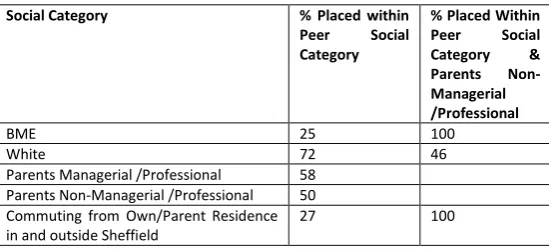
[image:8.595.71.490.68.346.2] [image:8.595.69.500.506.724.2]Of the cohort of students who had no PAL intervention and continued with their studies, since 2014 without repeating year of study, only 53% of the students were successful in securing a placement. The students who secured placements consisted of 81% white students and 19% BME. In addition, 44% of the students who secured placements were students with parents who are Managerial/Professional (M/P) personnel. Table 5 highlights the breakdown of the number of students placed within their social category of ethnicity and parental economic background. Table 5 also indicates that there is a placement attainment gap between white and BME students and less of a placement attainment gap between parental professional backgrounds. There is also no significance between student’s home residence and placement attainment. It is also noted in Table 5 that the BME students are less likely to secure placement opportunities. Therefore there is a need for appropriate innovations/initiatives to address this gap. Additionally, the placement results, Table 5, show that commuting from their main residence, own or parent’s residence (either from within or just outside the city of Sheffield) has an impact on student engagement in securing placement opportunity.
TABLE 5: NON-PAL 2014 COHORT PLACEMENT ATTAINMENT (30 STUDENTS (EXCLUDES 3 STUDENTS WHO FAILED 2ND YEAR, 4 STUDENTS WHO NON-ENGAGED AND FAILED 1ST YEAR TWICE, 1 STUDENT WHO PASSED 1ST YEAR AND WITHDREW AND 2 INTERNATIONAL STUDENTS), (INCLUDES 10 STUDENTS BORN OUTSIDE OF THE UK, 2 FEMALE STUDENTS))
Social Category % Placed within Peer Social Category
% Placed Within Peer Social Category & Parents Non-Managerial /Professional
BME 25 100
White 72 46
Parents Managerial /Professional 58
Parents Non-Managerial /Professional 50
Commuting from Own/Parent Residence in and outside Sheffield
27 100
FIGURE 3: BOX AND WHISKERS PLOT OF NON- PAL 3RD YEAR COHORT ACADEMIC PERFORMANCE RESULTS FOR DIFFERENT SOCIAL CATOGORIES
In conclusion the academic performance of the 3rd year students who did not receive PAL intervention (cohort 2014) and did not complete a placement has become more homogenised, see Figure 3. However the students with managerial/professional parents may need more support to improve their performance to be more consistent to their peers in achieving 2(i) degree classification.
PAL 2013 Cohort Results and Discussion
[image:10.595.74.488.73.283.2]result of poor integration into the course and HE institution. Again, PAL in this case was insufficient to address this issue through creating a sense of belonging for those students.
TABLE 6: PAL 2013 COHORT SOCIAL CATEGOIES (NO. 20 BRITISH STUDENTS INTIALLY ENROLLED (EXCLUDES 1 INTERNATIONAL STUDENT), (INCLUDES 7 STUDENS BORN OUTSIDE THE UK, NO FEMALE STUDENTS))
Social Category % Social Category
% Parents Non-Managerial /Professional
% Commute from Outside the City
% Living with Parents/ Own Residence
BME 52 55 19 33
White 48 40 0 19
Parents Managerial /Professional
43 5 10
Parents
Non-Managerial /Professional
57 14 52
TABLE 7: PAL 2013 COHORT ENROLMENT STATUS (NO. 20 BRITISH/EU STUDENTS INTIALLY ENROLLED (EXCLUDES 1 INTERNATIONAL STUDENT), (INCLUDES 7 STUDENS BORN OUTSIDE THE UK, NO FEMALE STUDENTS))
Social Category No. Failed 1st year (less 120 credits) & withdraw
No. with-draw during 1st year
No. Transferred to diff' 1st year Course
No. Passed 2nd year & with-draw after 2nd year
No. Failed 3nd year (less 120 credits)
BME 0 0 2 0 1
White 1 3 0 1 0
Parents Managerial /Professional
0 0 0 1 0
Parents
Non-Managerial /Professional
[image:11.595.66.394.144.257.2]1 3 2 0 1
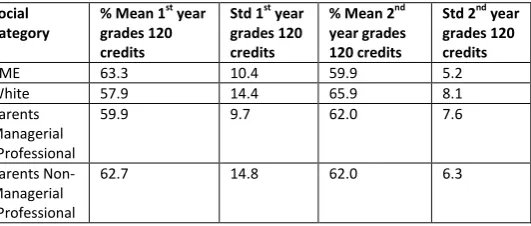
TABLE 8: PAL 2013 COHORT 1ST & 2ND YEAR ASSESMENT PERFORMANCE (NO. 15 BRITISH/EU STUDENTS INTIALLY ENROLLED (EXCLUDES 1 INTERNATIONAL STUDENT), (INCLUDES 7 STUDENTS BORN OUTSIDE THE UK, 1 EU STUDENT, NO FEMALE STUDENTS))
Social Category
% Mean 1st year grades 120 credits
Std 1st year grades 120 credits
% Mean 2nd year grades 120 credits
Std 2nd year grades 120 credits
BME 63.3 10.4 59.9 5.2
White 57.9 14.4 65.9 8.1
Parents Managerial /Professional
59.9 9.7 62.0 7.6
Parents Non-Managerial /Professional
62.7 14.8 62.0 6.3
TABLE 9: PAL 2013 COHORT LEARNING 1ST & 2ND YEAR ATTAINMENT T TEST ANAYLSIS (M/P IS MANAGERIAL/PROFESSIONAL, NON-M/P IS NON- MANAGERIAL/PROFESSIONAL)
Social Category T.Test Heteroscedasti c, σ=0.05 BME 1st year BME 2nd Year Parent s M/P 1st year
Parent s M/P 2nd year Parent s Non-M/P 1st year Parent s Non-M/P 2nd year White 1st year 0.45 0.19 0.54 0.77
White 2nd year 0.59 0.28
Parents
[image:11.595.68.392.314.457.2] [image:11.595.77.343.508.621.2] [image:11.595.66.338.673.768.2]Parents Non-M/P 2nd year
0.8 0.48
Parents M/P 1st year
0.49
Parents M/P 2ndyear
[image:12.595.68.341.72.134.2]0.25
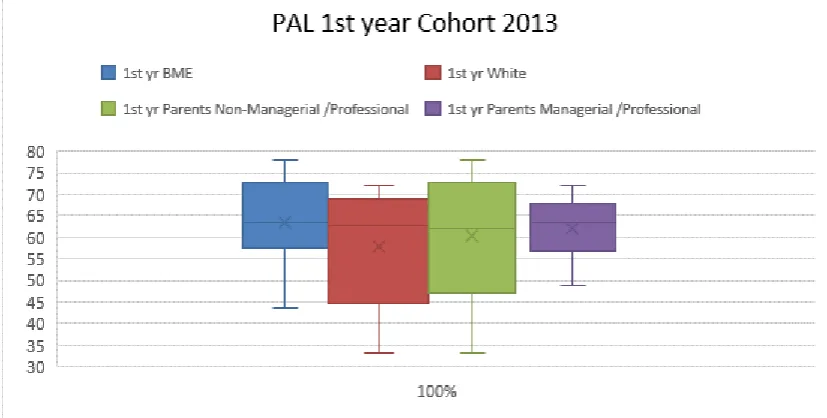
Table 8 and 9 illustrate the statistical results and T-test analysis of the academic performance of the first and second year of PAL 2013 Cohort. The results provide evidence to indicate the rejection of the alternative hypothesis that there is an academic learning attainment gap. However, Figure 4 and 5 highlights that half of white students and students from professional/managerial parents are below median and therefore are underperforming in comparison to the BME students and students from non-professional/managerial parents. These results are the inverse of the Non-PAL 2014 Cohort, strongly suggesting that the PAL intervention is addressing the BME and low social economic attainment gap. However, there is a need for further development of the peer learning approach to support all students’ attainment.
[image:12.595.71.485.310.519.2]FIGURE 5: BOX AND WHISKERS PLOT OF PAL 2ND YEAR COHORT ACADEMIC PERFORMANCE RESULTS FOR DIFFERENT SOCIAL CATOGORIES
73% of the students of the 2013 PAL Cohort secured a year-long placement. Table 10 illustrates which proportion of each social category of students secured a year-long placement (paid internship to be completed after their 2nd year of study). Table 10 shows that the placement attainment results for the PAL 2013 Cohort are both similar and different to the Non-PAL 2014 cohort, that is:
Different; as the students from the PAL 2013 Cohort secured more placements, 66.7%, 50:50 BME to white student ratio.
Different; in that for a small majority of commuting students, commuting has not been detrimental to securing placement. However, for the students who did not secure aplacement and live in their own residence and commute, it is known by the course team that these students have more complex personal responsibilities influencing them not to actively seek a placement.
Similar in that 70% of the students placed are with parents who are Managerial/Professional personnel.TABLE 10: PAL 2013 COHORT PLACEMENT ATTAINMENT (NO. 15 BRITISH/EU STUDENTS INTIALLY ENROLLED (EXCLUDES 1 INTERNATIONAL STUDENT), (INCLUDES 7 STUDENS BORN OUTSIDE THE UK, 1 EU STUDENT, NO FEMALE STUDENTS))
Social Category % Placed within Peer Social Category
% Placed Within Peer Social Category & Parents Non-Managerial /Professional
BME 56 40
White 100 20
Parents Managerial /Professional 100
Parents Non-Managerial /Professional 43
Commuting from Own/Parent Residence in and outside Sheffield
[image:13.595.71.502.68.283.2] [image:13.595.68.345.598.722.2]The significance of the 2013 cohort placement results is more striking when compared to the placement results for 2013 cohort of all engineering students on all engineering courses in the department. The 2013 cohort of all engineering students; 221 UK and EC engineering students were eligible for placement, of which 56 (25%) are BME students and 165 (75%) are non-BME students. 145 students successfully secured a placement opportunity each, of which 22 (15%) BME students secured a placement and 123 (85%) non-BME students secured a placement. Therefore 39% of the BME students out of the BME students were successful in gaining a placement opportunity in comparison to 74% non-BME out of non-BME students. The placement attainment data for every engineering student has not been cross correlated with each student’s record on their parental’s occupation as this data was not readily available for all engineering courses and students. With respect to the number of placement opportunities in engineering typically 3 or more placement opportunities are advertised per engineering student in every subject area. Typically each year there is no shortage of engineering placement opportunities in all subject areas, and a range of opportunities locally and nationally.
In conclusion, Table 10, provides further evidence that PAL has had a positive impact upon the BME students per se (this applies to BME students irrespective of the parents’ professions, non-managerial/professional students in attaining placements). PAL leaders significantly supported the employability development of the 2013 PAL cohort of students, i.e. assisting them in their 1st year in preparing for applying for placements. Also the PAL leaders gained from volunteering and supporting the 2014 1st year cohort through developing their employability skills and providing evidence of extra curriculum activity for their CV's. In conclusion, it appears the PAL interventions have supported the BME students in attaining placements regardless of whether they commute or live with their families or other living arrangements. However, there is also further work to be done in supporting white students from lower social backgrounds in securing placements.
TABLE 11: PAL 2013 COHORT 3RD YEAR ASSESMENT PERFORMANCE (NO. 14 BRITISH/EU STUDENTS INTIALLY ENROLLED (EXCLUDES 1 INTERNATIONAL STUDENT), (INCLUDES 7 STUDENS BORN OUTSIDE THE UK, 1 EU STUDENT, NO FEMALE STUDENTS))
Social Category % Mean 3rd year grades 120 credits
Std 3rd year grades 120 credits
BME & No placement1 52.5 10.11
BME & placement 65.7 5.46
White & 100% placement 67.8 2.05
Parents Managerial /Professional & 100% placement
65.5 4.21
Parents Non-Managerial /Professional & placement
68.8 4.00
TABLE 12: PAL 2013 COHORT LEARNING 3RD YEAR ATTAINMENT T TEST ANAYLSIS (M/P IS MANAGERIAL/PROFESSIONAL, NON-M/P IS NON- MANAGERIAL/PROFESSIONAL)
Social Category T.Test Heteroscedasti c, σ=0.05
BME 3rd Year & No Placement1
BME 3rd Year & Placement
Parents Non-M/P 3nd year & Placement
Parents M/P 3nd year & 100% Placement White 33d year
& 100%
0.05 0.46 0.72 0.29
1
The same set of students are BME 3rd Year & No Placement data set as the Parents Non-Managerial /Professional & No placement data
Placement BME 3rd Year & Placement
0.07
Parents Non-M/P & Placement 33d year
0.04 0.39 0.04
Parents Managerial /Professional 3rd year & 100% Placement
0.08 0.96 0.32
Tables 11 and 12 illustrate in the case of 3rd year PAL 2013 Cohort all students completed their 3rd year of study. It should be noted in these tables that the BME students who did not secure a placement are the same set of students who have parents that are non-managerial/professionals.
Table 12 T-Test probability value results, p, suggests;
Strongly, for p ≤ 0.05, the rejection of the hypothesis that 3rd year performance of the BME students without placement experience is similar to white students with a placement experience.
The hypothesis that the academic performance similarity is less true between;
o BME students with no placement experience versus BME students with placement experience
o BME students with no placement experience versus students with non-professional/managerial parents and placement experience.
FIGURE 6: BOX AND WHISKERS PLOT OF PAL 3RD YEAR COHORT ACADEMIC PERFORMANCE RESULTS FOR DIFFERENT SOCIAL CATOGORIES
In conclusion, the results indicate that placement attainment is critical to student academic attainment, and PAL assisted in improving the placement attainment and therefore academic performance. The results indicate 2nd year students do need to be encouraged and supported to secure a placement. The results can be used to emphasis to future students the educational value of a placement and the positive impact a placement can have upon their final degree attainment. From an educational perspective it is clear further academic interventions are needed in the 3rd year to support the students who don’t secure a placement (for whatever reasons) to ensure they have they had an opportunity to redress the absence of placement to academic performance.
PAL 2013 Cohort v Non-PAL 2014 Cohort Results and Discussion
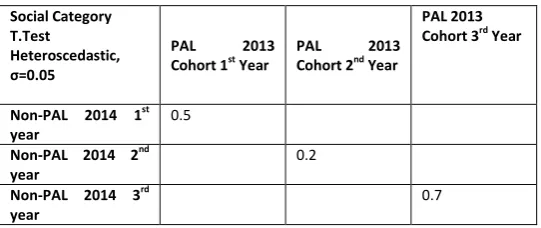
TABLE 13: LEARNING ATTAINMENT T TEST ANAYLSIS BETWEEN PAL AND NON-PAL COHORTS OVERALL ACADEMIC PERFORMANCE REGARDLESS OF SOCIAL CATOGERY
Social Category T.Test
Heteroscedastic, σ=0.05
PAL 2013 Cohort 1st Year
PAL 2013 Cohort 2nd Year
PAL 2013 Cohort 3rd Year
Non-PAL 2014 1st year
0.5
Non-PAL 2014 2nd year
0.2
Non-PAL 2014 3rd year
0.7
[image:16.595.72.552.79.307.2] [image:16.595.67.338.570.684.2]between social categories at 1st and 2nd year of study. However, for PAL 2013 cohort the placement experience has a significant impact on the 3rd year academic attainment. How true this is for Non-PAL 2014 Cohort is currently unknown; it is dependent upon the future academic performance of the students returning from placement during academic year 2017-2018.
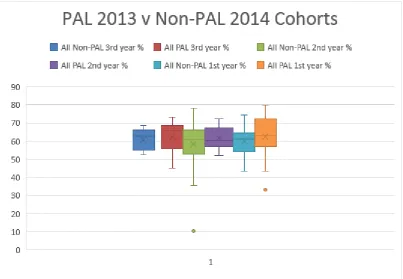
FIGURE 7: BOX AND WHISKERS PLOT OF OVERALL PAL AND NON-PAL COHORTS ACADEMIC PERFORMANCE RESULTS FOR DIFFERENT ACADEMIC YEARS
Also, it is observed that in both cohorts, students who commute to study and reside in their own or their parents' residence are typically from a low social economic background (parents from non-managerial or non-professional background). The retention (failure, withdrawn, or transfer) data in both cohorts is not significantly large enough to show whether any social category has an influence on the results; students typically withdrawing are white, but again the number of students is too small to suggest this is consistently the case. Students’ home residence geography has no significance on placement attainment. However, on the PAL 2013 cohort of students’ residing at their own residence/parents, 2 students transferred onto new courses, 2 withdrew from the course and 1 failed the course, indicating that commuting has an impact on student retention. Therefore, additional student support is needed to help integrate commuting students into their cohort. It is, also noted on both courses that another group of students underperforming are the 2nd year students with parents in managerial or professional role; therefore interventions are needed to investigate this further in order to develop their learning attainment.
Conclusions
[image:17.595.73.477.143.422.2]household may need to be encouraged to access additional academic interventions to improve their attainment.
Also, where cohorts have a larger number of commuting students it is recommended that interventions are made to support these students in order to aid first year retention. This concurs with Marra et al's (2012) conclusion that engineering courses may benefit from targeted initiatives to support minority social categories to increase their sense of belonging on the course. For example, attempts could be made to encourage the students to make further use of PAL. Encouraging PAL alongside the course team creating an inclusive and effective learning approach, will help instil a personal sense of belonging for each student, ibid. Regular monitoring of all students’ academic performance is recommended in order to monitor students’ performance is progressing as expected..
With respect to placement attainment, the statistical analysis demonstrates that PAL has a positive impact on the number of students that secured a placement. It can therefore be concluded that the PAL initiative has had a positive impact upon the 2013 student cohort. In particular when compared to the placement attainment data for all the 2013 engineering student cohorts, the results demonstrate a stark placement attainment gap between BME and non-BME students, i.e. the latter are 3 times more likely to attain a placement opportunity. PAL results appear to counter this issue and aid student employability development. Subsequently the placement experience had a positive impact on students’ academic attainment regardless of a student’s social category. However, the results of the study only provide part of the picture, as the 3rd year academic performance for Non-PAL 2014 cohort is incomplete. The impact of placement experience on Non-Non-PAL 2014 cohort on the academic attainment is not yet known.
The significance of the placement learning opportunity should not be dismissed as it is a critical part of enhancing student learning in student 3rd year of study. Previous research by Mandilaras (2004) demonstrated that economic graduates with placement gained an average degree classification of 2(i) whereas graduates without a placement averaged a 2(ii) degree classification. This study has shown for one cohort the lack of placement attainment has led to a 3rd year attainment gap between students, particularly impacting upon BME students and students with parents in non-managerial or non-professional roles. Student academic attainment for these students (BME and students with parents in non-managerial or non-professionals) could be further compounded on courses without PAL, as PAL has shown to help students secure placement opportunities.
It should be noted that the Wakeham Report (2016) concluded that STEM students' career prospects of securing graduate level employment are significantly enhanced if students have had previous relevant work experience, e.g. a placement experience. As placement opportunities develop students’ confidence through: working on real projects with realistic deadlines; developing communication; providing project management and time management skills; learning to work with colleagues other than their peers; building on their technical skills; and developing the ability to conduct themselves in a professional manner. In theory the students bring this learning with them on their return to their final year of study.
References
Angelini, M. (2011), "Measuring the effects of Peer-Assisted Learning on the development of students in transition to maths-based teaching programs". In CETL-MSOR Conference 2011 (pp. 9).
Berry, J. & Loke, G. (2011), Ethnicity and Degree Attainment. DfeS Research Report RW92. London: DfES
Bowl, M. (2001). “Experiencing the barriers: Non-traditional students entering higher education.” Research papers in education, Vol 16, No. 2, pp. 141-160
Connor, H., Tyers, C., Modood, T., & Hillage, J. (2004). "Why the difference? A closer look at higher education minority ethnic students and graduates" .Institute for Employment Studies research report, 552.
Cotton, D. R. E., Joyner, M., George, R., & Cotton, P. A. (2016), "Understanding the gender and ethnicity attainment gap in UK higher education." Innovations in Education and Teaching International, Vol. 53 No.5, pp. 475-486.
Cotton, D. R. E., Joyner, M., George, R., & Cotton, P. A. (2016), "Understanding the gender and ethnicity attainment gap in UK higher education." Innovations in Education and Teaching International, Vol. 53 No. 5, pp. 475-486.
Coughlan, S. (2002) “Three quarters of employers 'require 2:1 degree'”, BBC News, available at: http://www.bbc.co.uk/news/10506798, (accessed 31 August 2017)
Crawford, C. (2014). “Socio-economic differences in university outcomes in the UK: drop-out, degree completion and degree class” (No. W14/31). IFS Working Papers. available at: https://www.ifs.org.uk/uploads/publications/wps/WP201431.pdf, (accessed 31 August 2017)
Equality Challenge Unit (2015), "Degree attainment gaps, Equality Challenge Unit", available at: http://www.ecu.ac.uk/guidance-resources/student-recruitment-retention-attainment/student-attainment/degree-attainment-gaps/ (accessed 20 April 2017)
Field, A. (2017a). “Effect Sizes”, Discovering statistics, Effect Sizes, available at: https://www.discoveringstatistics.com/, (accessed 30 August 2017)
Field, A. (2017b). “Parametric tests of Differences Between Mean”, Discovering statistics, Effect Sizes, : available at: https://www.discoveringstatistics.com/, (accessed 30 August 2017)
Goldthorpe, J. H, (2004) “The Economic Basis of Social Class”. LSE STICERD Research Paper No.
CASE080.available at: https://ssrn.com/abstract=1158971 (accessed 30 August 2017)
Kane, S., & Sinka, I. (2009), "Good practice in undergraduate peer support", MSOR Connections, Vol. 9, No. 4, pp. 11-14.
Mandilaras, A. (2004),"Industrial placement and degree performance: Evidence from a British higher institution". International Review of Economics Education, Vol. 3, No.1, pp. 39-51.
Marra, R. M., Rodgers, K. A., Shen, D., & Bogue, B. (2012). Leaving engineering: A multi‐year single institution study. Journal of Engineering Education, 101(1), 6-27.
Newton, E., & Wells-Glover, L. (2000), "Mentors for undergraduates in technical disciplines: A collaborative effort by faculty, student development professionals, and alumni to improve undergraduate retention and success in technical majors". Journal of College Student Retention: Research, Theory & Practice, Vol. 1 No.4, pp. 311-321.
Nortcliffe, A. Keech, C. and Evans, J. (2014), "Closing the BME attainment gap", SEFI (2014) Educating Engineers for Global Competitiveness, 15-19 September 2014
Nortcliffe A. and Pink-Keech, C. (2017), "The Impact of PAL on Personal development of a diverse student cohort", Inclusive Engineering Report, Royal Academy of Engineers, UK
NUS (2011), "Race for equality: a report on the experiences of black students in FE and HE", National Union of Students, available at: http://www.nus.org.uk/en/news/race-for-equality/, (accessed 20 April 2017).
Ody, M., & Carey, W. (2013), "Peer Education”. Student Engagement Handbook: Practice in Higher Education, 291.
Page, N., Taylor-Steeds, E., Carey, L., Siaw, E., Gurnett, K., Ait Belkacem, L., & Ghatora, B. (2016), "Understanding student motivations and career aspirations so that we can effectively support our graduates". New Directions in the Teaching of Physics, Vol. 11 No. 1.
Parsons, D. (2017), Demystifying Evaluation: Practical Approaches for Researchers and Users. Policy Press.
OFFA (2017). “Topic briefing: White British students from low socio-economic status groups”, Office For Fair Access, available at: available at: https://www.offa.org.uk/universities-and-colleges/guidance/topic-briefings/topic-briefing-white-british-students/ (accessed 31st August 2017)
Paige, S. M., Wall, A. A., Marren, J. J., Dubenion, B., & Rockwell, A. (2017). The Learning Community Experience in Higher Education: High-Impact Practice for Student Retention. Taylor & Francis.
Quality Assurance Agency (2012), "Chapter B5: Student Engagement", Part B: Assuring and enhancing academic quality. London. [Online] available at:
http://www.qaa.ac.uk/Publications/InformationAndGuidance/Pages/quality-code-B5.aspx (accessed 07 February 2013)
Redmond, P. (2006), “Outcasts on the inside: Graduates, employability and widening participation”. Tertiary Education & Management, Vol. 12 No. 2, pp. 119-135.
Rumberger, R.W. (1983), “Dropping out of high school: The influence of race, sex, and family background”. American Educational Research Journal, Vol. 20No2, pp.199-220.
Senior, N., (2012), "Exploring the retention and attainment of black and minority ethnic (BME) students on Social Policy pathways in higher education". The Higher Education Academy, available at:
https://www.heacademy.ac.uk/system/files/exploring_retention_and_attainment_of_bme_student s_nicki_senior.pdf (accessed 20 April 2017)
Singh, G. (2011), "Black and Minority Ethnic (BME) students participation and success in higher education: improving retention and success - A synthesis of research evidence." York, Higher
Education Academy. available at:
http://www.heacademy.ac.uk/resources/detail/inclusion/Ethnicity/BME_synthesis (accessed 07 February 2013)
Singh, G. (2012), "Reducing disparities in Black and Minority Ethnic student attainment - challenges and possibilities," Paper presentation at MoRKKS workshop 7 Nov 2012 at Sheffield Hallam University. available at: http://www.slideshare.net/viscabarca/gurnam-singh-morkss-at-shu-171112 (accessed 06 February 2013)
Stuart, M., Lido, C., Morgan, J., Solomon, L., & May, S. (2011), "The impact of engagement with extracurricular activities on the student experience and graduate outcomes for widening participation populations" Active Learning in Higher Education, Vol. 12, No. 3, pp. 203-215.
Sword, W., Byrne, C., Drummond-Young, M., Harmer, M., & Rush, J. (2002), "Nursing alumni as student mentors: nurturing professional growth". Nurse Education Today, Vol.22 No. 5, pp. 427-432.
Thomas, L. (2017). “Student engagement in the context of commuter students”, The Student Engagement Partnership, available at: http://tsep.org.uk/student-engagement-in-the-context-of-commuter-students/, (accessed 31 August 2017)
Wakeham, W. (2016), "Wakeham Review of STEM degree provision and graduate employability", Gov.UK, available at:
https://www.gov.uk/government/uploads/system/uploads/attachment_data/file/518582/ind-16-6-wakeham-review-stem-graduate-employability.pdf, (accessed 20 April 2017).