Highly sensitive label-free in vitro detection of aflatoxin B1
in an aptamer assay using optical planar waveguide
operating as a polarization interferometer
AL-JAWDAH, A, NABOK, Aleksey <http://orcid.org/0000-0002-9078-1757>,
ABU-ALI, H, CATANANTE, G, MARTY, JL and SZEKACS, A
Available from Sheffield Hallam University Research Archive (SHURA) at:
http://shura.shu.ac.uk/25202/
This document is the author deposited version. You are advised to consult the
publisher's version if you wish to cite from it.
Published version
AL-JAWDAH, A, NABOK, Aleksey, ABU-ALI, H, CATANANTE, G, MARTY, JL and
SZEKACS, A (2019). Highly sensitive label-free in vitro detection of aflatoxin B1 in an
aptamer assay using optical planar waveguide operating as a polarization
interferometer. Analytical and Bioanalytical Chemistry.
Copyright and re-use policy
See
http://shura.shu.ac.uk/information.html
RESEARCH PAPER
Highly sensitive label-free in vitro detection of aflatoxin B1 in an
aptamer assay using optical planar waveguide operating
as a polarization interferometer
Ali Al-Jawdah1&Alexei Nabok1&Hisham Abu-Ali1&Gaelle Catanante2&Jean-Louis Marty2&Andras Szekacs3
Received: 2 May 2019 / Revised: 14 June 2019 / Accepted: 15 July 2019 #The Author(s) 2019
Abstract
This work reports on further development of an optical biosensor for the in vitro detection of mycotoxins (in particular, aflatoxin B1) using a highly sensitive planar waveguide transducer in combination with a highly specific aptamer bioreceptor. This sensor is built on a SiO2–Si3N4–SiO2optical planar waveguide (OPW) operating as a polarization interferometer (PI), which detects a
phase shift between p- and s-components of polarized light propagating through the waveguide caused by the molecular adsorption. The refractive index sensitivity (RIS) of the recently upgraded PI experimental setup has been improved and reached values of around 9600 rad per refractive index unity (RIU), the highest RIS values reported, which enables the detection of low molecular weight analytes such as mycotoxins in very low concentrations. The biosensing tests yielded remarkable results for the detection of aflatoxin B1 in a wide range of concentrations from 1 pg/mL to 1μg/mL in direct assay with specific DNA-based aptamers.
Keywords Optical planar waveguide . Polarization interferometer . Refractive index sensitivity . Aptamer . Aflatoxin B1
Introduction
This work is dedicated to development of novel optical bio-sensing technologies for detection of low molecular weight analytes such as toxins. Our particular target was the detection of mycotoxins being products of metabolism of numerous fungi species which are the most common (particularly in tropical countries) and dangerous contaminants in food and
animal feed [1]. Because of high toxic, carcinogenic, and endocrine-disruptive properties of mycotoxins on human, worldwide legislation established quite strict limits on myco-toxin content in food and feed, typically at the ppb (part per billion) concentration level [2]. This makes the detection of small mycotoxin molecules (with typical molecular weight in hundreds of daltons) a difficult task. The development of bio-sensors for mycotoxins as a cost-effective alternative to the modern advanced analytical methods, such as HPLC and mass spectroscopy, is in great demand nowadays. Such bio-sensors should be highly sensitive, but at the same time inex-pensive, portable, and simple to use to enable quick tests at the point of need.
The detection of mycotoxins is typically done by immunosensing which is based on binding of toxin molecules to specific bioreceptors such as antibodies or aptamers; there-fore, optical immunosensing technologies, such as surface plasmon resonance, spectroscopic ellipsometry, optical wave-guides, and interferometry, are the most common in mycotox-in detection [3]. The method of total internal reflection ellipsometry (TIRE) was successfully used for detection of several mycotoxins, e.g., T-2, zearalenone, aflatoxin B1, and ochratoxin A, in direct immunoassays with specific antibodies Published in the topical collectionNew Developments in Biosensorswith
guest editors Francesco Baldini and Maria Minunni.
Electronic supplementary materialThe online version of this article (https://doi.org/10.1007/s00216-019-02033-4) contains supplementary material, which is available to authorized users.
* Alexei Nabok [email protected]
1
Materials and Engineering Research Institute, Sheffield Hallam University, City Campus, Sheffield S1 1WB, UK
2
Department of Biochemistry and Molecular Biology, University of Perpignan, 66860 Perpignan, France
3 Agro-Environmental Research Institute, NARIC, Budapest 2100,
Hungary
[4–7]. The measurements of phase changes between p- and s-components of polarized light in the method of TIRE provided a high sensitivity of detection of mycotoxins in ppb level of concentration which corresponds well to the legislated limits. However, the method of TIRE is still based on a bulky and expensive optical instrument, e.g., spectroscopic ellipsometer. A logical continuation of this direction in biosensor develop-ment was the use of optical planar waveguide (OPW) operat-ing as a polarization interferometer (PI) with the multiperiodic output signal proportional to the phase shift between p- and s-components of polarized light [8]. Previous attempts in this development were encouraging [9,10]; the PI OPW devices demonstrated high refractive index sensitivity (RIS) which allows the detection of mycotoxins (aflatoxin B1, ochratoxin A, and zearalenone) in concentrations down to 0.01 ppb. During the last couple of years, the PI OPW experimental setup underwent several rounds of upgrading. The latest ver-sion, which is based on the waveguide having a Si3N4core
etched in a narrow (1 mm wide) strip and uses HeNe laser (633 nm) as a light source, offers much higher refractive index sensitivity and much more stable and less noisy output signal. The use of planar waveguides is, perhaps, the most popular direction nowadays in the development of optical biosensors. Several optical PW biosensor devices developed recently are based on the Mach–Zehnder (MZ) interferometer [11–15] and ring resonator [16,17] principles; both approaches demon-strated remarkable refractive index sensitivity around 7000 to 8000 rad/refractive index unit (RIU) [11,17]. The develop-ment of fully integrated all-silicon biosensors comprising mul-tichannel MZ interferometers with embedded avalanche LEDs as light sources, sensitive photodetectors, and microfluidic sample delivery system [18–21] was the pinnacle of this direction of research and development; such highly sensitive and portable devices showed their versatility in a wide range of applications from environmental to biomedical, and suitability for in-field or point-of-care detection of analytes of interest. The proposed PI biosensor has similar sensitivity to that of MZ-based devices, but achieved with much simpler design without splitting the waveguide [8–10]. Another idea which we are exploring in this work is the use of aptamers as bioreceptors for mycotoxins. Aptamers being linear biopolymers with specifically designed sequences of RNA or DNA nucleotides to bind target molecules are getting increasingly popular nowadays as artificial bioreceptors in various biosensing applications as alternative to antibodies [22,23]. Aptamers have a number of advantages over tradi-tional antibodies, mainly in their robustness, simple immobi-lization chemistry, and lower cost. The technology of aptamer synthesis improved dramatically in the last decade, so they became commercially available for a wide variety of analytes. Aptamers were recently used successfully in detecting myco-toxins, e.g., ochratoxin A [24–26]. In majority of biosensing applications, aptamers are usually labeled with either
fluorescent or redox groups enabling the use of simple optical or electrochemical detection, respectively. In our recent work, we successfully tried unlabeled aptamers for ochratoxin A [7] and aflatoxin B1 [27] in conjunction with highly sensitive TIRE detection method. In this work, we explore the use of aptamers as specific bioreceptors for in vitro detection of af-latoxin B1 in a combination with a highly sensitive (after recent upgrades) PI OPW method.
IP OPW experimental setup
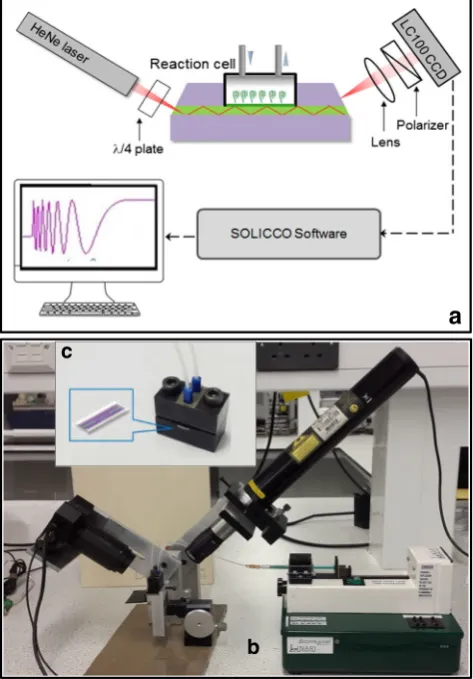
The key element of this system is an optical planar waveguide (shown in Fig.1) which was produced on silicon wafer using standard microelectronic processes and consisted with the core 200-nm-thick layer of Si3N4sandwiched between much
thicker (3μm) layers of SiO2. A large difference in refractive
indices of the Si3N4core (n= 2.02) and SiO2cladding (n=
1.46) results in a steep angle (47°) of light propagation through the waveguide and thus a large number of reflections which was estimated as 500 per mm of the waveguide length u s i n g t h e G o o s–H a n c h e n m o d e l [2 8] . U s i n g
a
b c
Fig. 1 Schematic diagram (a) and photograph (b) of the PI OPW experimental setup; the reaction cell with inserted OPW (c), the inset shows zoomed-in OPW chip
[image:3.595.307.544.342.682.2]photolithography, the Si3N4core layer was formed as a
1-mm-wide strip, and a sensing window was etched in the top SiO2
layer (see the image of the OPW chip in Fig.1c). Etching of the top cladding SiO2layer was carried out in diluted 1:10
hydrofluoric acid (HF), while the S3N4core was etched in
hot (160 °C) phosphoric acid (H3PO4). The reaction cell
(Fig. 1c) was attached to the sensing window to enable injecting different chemicals and thus performing different biochemical reactions, e.g., binding the analyte molecules to bioreceptors immobilized on the surface of a sensing window. The light beam from a HeNe laser (λ= 632.8 nm) cir-cularly polarized byλ/4 plate was coupled into the wave-guide via slant edge (polished at 47°). As shown in Fig.
1a, b, the light coming out from the other end of the waveguide goes through the polarizer which converts a phase shift between p- and s-components of polarized light into variations of light intensity. The light is collect-ed by CCD array (Thorlabs LC100–Smart Line Camera) which was interfaced to PC; SPLICCO dedicated software was used to record the output signals. The resulting multiperiodic output signal shown in Fig.1a can be pro-duced either by variations of the refractive index of the medium or by molecular adsorption.
The modeling of the PI OPW setup was carried out by calculating the phase shift between p- and s-components of polarized light caused by changes in the refractive index of the medium in the waveguide sensing window [29]:
ΔφP;S¼2arctan
ffiffiffiffiffiffiffiffiffiffiffiffiffiffiffiffiffiffiffiffiffiffiffiffiffi N2sin2θ−1
q
N sinθtanθ 2
4
3 5;
whereN = n1/n2is the ratio of the refractive indices of the core
and cladding, andθis the angle of propagation. The maximal refractive index sensitivity (RIS) atθ=47° was estimated as 1550 rad/RIU (RIU stands for refractive index unity) for 500 reflections per mm, or 9300 rad/RIU on 6-mm-long sensing window.
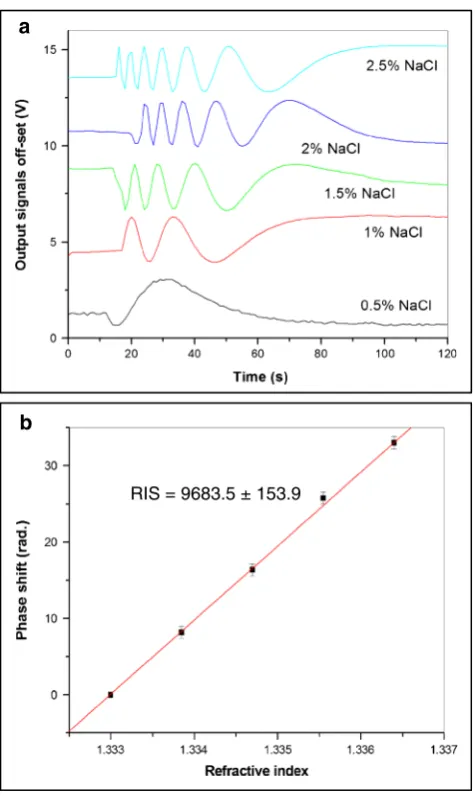
The refractive index sensitivity (RIS) was assessed exper-imentally by injecting NaCl aqueous solutions of different concentrations into the cell. Multiperiodic output signals caused by the changes in refractive index were recorded and presented in Fig.2a, and the number of periods of signal oscillations was precisely calculated from the waveforms and plotted against the refractive index in Fig.2b. The results of a single typical set of measurements were presented in Fig.
2; the accuracy of phase shift evaluation was estimated as 0.1 rad. The RIS value of 9683.5 ± 153.9 rad/RIU was found as a gradient of the linear dependence in Fig.2b. The obtained value is close to the estimated RIS of 9300 rad/RIU, and it is higher than the RIS values reported for the other OPW-based sensors [11,17].
Preparation of aptamers and their
immobilization on OPW
The anti-aflatoxin B1 aptamers were synthesized and purified by Microsynth (Schutzenstrasse, Balgach, Switzerland). The sequence of nucleotides established previously in [30] is shown below:
SH- 5′-GTTGGGCACGTGTTGTCTCTCTGTGT
CTCGTGCCCTTCGCTAGGCCCACA-3′
There was no label attached at 3′(e.g., C3) terminal, while the thiol group was attached to 5′ (e.g., C5) terminal. This aptamer is highly specific to aflatoxin B1 target with the af-finity coefficient in the range of 10−7Mol [30] which was independently confirmed in our previous research [27]. The aptamers dissolved in phosphate-binding buffer (PBB) con-taining MgCl2salt were immobilized on the Si3N4surface of
sensing window of OPW, which was firstly aminated in (3-a
b
RIS = 9683.5 ± 153.9
[image:4.595.307.545.49.448.2]aminopropyl)triethoxysilane, via an intermediate layer of 4-(N-maleimidomethyl) cyclohexanecarboxylic acid (SMCC).
The aptamers were delivered in lyophilized form. The aptamer stock solution is prepared at 100μM by adding an appropriate volume of sterilized water. Then, the stock solu-tion is aliquoted and stored at−20 °C. All other chemicals, e.g., sodium phosphate di-basic (Na2HPO4), potassium
phos-phate mono-basic (KH2PO4), potassium chloride (KCl),
mag-nesium chloride (MgCl2), dithiothreitol (DTT),
sulfo-succinimidyl-4-(N-maleimidomethyl) cyclohexane-1-carboxylate (sulfo-SMCC), and sodium chloride (NaCl), were procured from Sigma-Aldrich (France). Aflatoxin B1 was pur-chased from Sigma-Aldrich (UK). All reagents were of ana-lytical grade. Deionized Milli-Q water was used for prepara-tion of reagents throughout the experiments. The 100 mM PBS-binding buffer (PBB) was prepared by dissolving 10 mM Na2HPO4, 1.76 mM KH2PO4, 3 mM MgCl2,
2.7 mM KCl, and 137 mM NaCl in deionized water. The pH value of the buffer was adjusted to 7.4.
Before immobilization, the stock solution of aptamers was diluted at desired concentration with PBB supplemented with 2 mM of DTT, then diluted aptamer solution was thermo-cycled in PCR unit, e.g., heated to 90 °C for 5 min and cooled down to 4 °C for 5 min. The presence of thiol groups at 5′ terminal allows immobilization on gold surface. In our case, however, we need to immobilize this aptamer in the sensing
window of the planar waveguide on the surface Si3Ni4. The
process of aptamer immobilization is illustrated in Fig.3. At first, the silicon nitride surface was functionalized with amine groups using (3-aminopropyl) triethoxysilane (Fig.3a), then 4-(N-maleimidomethyl) cyclohexanecarboxylic acid (SMCC) molecules were bound to amine groups (Fig. 3b) by adding 30μL of 10 mM SMCC solution in PBS buffer, pH 7.4 to each waveguide chip, and incubating the samples for 1 h at room temperature. SMCC is a heterobifunctional cross-linker that containsN-hydroxysuccinimide (NHS) ester and maleimide groups which allow covalent conjugation of amine groups on the surface and SH-groups in aptamers. NHS esters react with primary amines at pH 7–9 to form amide bonds while maleimides react with thiol groups at pH 6.5– 7.5 to form stable thiol–ether bonds. The samples were then washed with deionized water three times. Finally, aptamers were attached to the SMCC layer using the specific reaction between C5-terminal cysteines and the maleimide-activated surfaces (Fig.3c). This was achieved by dropping 30μL of 2 μM aptamer solution (preheated with thermal cycler) in binding buffer pH 7.4 with the addition of 1 mM DTT (dithiothreitol) on the SMCC-activated plates. The samples were incubated for 4 h at room temperature in the dark. After the conjugation reaction was complete, the samples were washed three times for 2 min in binding buffer.
Before immobilization step on the maleimide-activated surface, the aptamer used was denatured by heating/cooling
b
c
d
a
Fig. 3 Aptamer immobilization protocol: amine-functionalized surface of Si3N4(a), SMCC-activated surface (b), aptamers immobilized (c), and aptamer binding target analyte molecules (d)
[image:5.595.234.543.419.709.2]cycle to ensure that the DNA sequence adopt the most favor-able secondary structure combining a loop and a linear part (see the secondary aptamer structure as Electronic Supplementary Material (ESM), Fig. S1). However, in the presence of analytes, e.g., aflatoxin B1, the above aptamer engulfs the target (Fig. 3d), which causes changes in the aptamer’s secondary structure stabilized by the presence of MgCl2salt in binding buffer [31]. This process which is
asso-ciated with changes in the molecular layer thickness can be easily detected by a PI OPW sensor.
Detection of aflatoxin B1 with a PI OPW
sensor in aptamer assay
Aflatoxin B1 (AFT B1) stock solution (1 mg/mL) was pre-pared in acetonitrile. Further dilutions of AFT B1 were done
in PBB. All of the working AFT B1 solutions of 1 pg/mL, 0.01 ng/mL, 0.1 ng/mL, 1 ng/mL, 10 ng/mL, 100 ng/mL, and 1μg/mL were prepared freshly before use and stored at 4 °C when not in use.
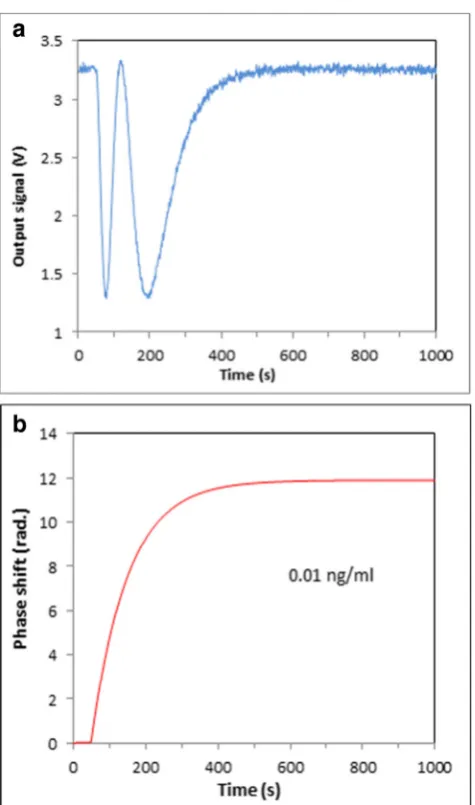
A series of PI measurements were carried out by sequential injections of AFT B1 solutions of different concentrations in PBB (starting with the smallest concentration of 1 pg/mL) into the cell. Intermediate washing of the cell by purging it with 1 mL of PBB solution was carried out after each injection in order to remove non-specifically bound toxin molecules. The signals were recorded during binding of AFT B1 to their spe-cific aptamers with the exposure time of around 40 min. The typical recorded waveform for injection of 0.01 ng/mL of AFT B1 is shown in Fig.4a along with the corresponding phase changes in Fig. 4b. In contrast to our earlier works, where the phase shift was roughly estimated with the accuracy of half-a-period, here the phase shift was calculated more pre-cisely by integration of the waveforms. All results, e.g., the waveforms and corresponding phase shifts, for all concentra-tions of AFT B1 used are given as ESM in Fig.S2.
As one can see, the lowest concentration of AFT B1 used was 1 pg/mL, which causes a noticeable 5.84 rad (nearly the whole period) of phase change. The saturation of the response typically occurs after 400 s to 500 s of exposure which is similar to the time of immune reaction, e.g., binding target analyte to respective antibodies [9,10]. The PI OPW sensor responses, e.g., the phase shift values, recorded for consecu-tive injections of different concentrations of AFT B1 summa-rized in Fig.5a(blue columns) show monotonous increase of the phase shift with the increase of AFT B1 concentration. The standard deviation values (shown as error bars) were calculat-ed by statistical analysis of five series of measurements.
A small drop in the response at the highest concentration of 1μg/mL is most likely caused by saturation of binding sites, e.g. aptamers. The signal recordings, which were performed during washing out non-specifically bound toxin molecules after each binding stage, typically yield 2.36 ± 0.14 rad of phase change (see Fig.5a, red columns). The fact that this value is practically independent on the AFT B1 concentration indicates that non-specific adsorption most likely takes place in voids between immobilized aptamers. Negative control tests were also carried out by injecting a different mycotoxin, e.g. ochratoxin A, which is not supposed to be bound to the anti-AFT B1 aptamer. The response was at the noise level. Also, the injection of pure buffer solution (with no AFT B1 added) yielded a zero response. These results are shown as ESM in Fig.S3.
Because the measurements were carried out in sequence of steps of injections of toxins in progressively increased con-centration, further analysis of the data obtained was carried out in order to work out the accumulated response. For that purpose, the phase changes at each stage were added, and the responses to washing out toxins were subtracted. The resulting
[image:6.595.52.290.48.451.2]calibration curve in Fig.5bwas obtained by fitting the data to sigmoidal (logistic) function using Origin 6.0 software; the formula and fitting parameters are shown in Fig.5b.
Figure5byields a wide linear dynamic detection range (from 0.01 to100 ng/mL) with the trend of flattening at both low and high concentrations. The mean standard deviation of phase shift measurements was estimated as ± 0.5 rad which allows the evaluation of low detection limit as 0.7 pg/mL by linear approximation of calibration curve to the level of 0.5 × 3 = 1.5 rad (see the inset in Fig.5b).
The results obtained are similar to those reported ear-lier for the PI detection of aflatoxin B1 in direct immu-noassay with specific antibodies [9]. However, the latest upgrades in the PI OPW experimental setup and signal processing in combination with aptamer bioreceptors are
clearly more sensitive and thus capable of detection of much smaller concentrations of aflatoxins in sub-ppt range. An additional advantage of using aptamers was a simple procedure of sensor recovery. The OPW sensor chips with immobilized aptamers can be restored to its initial state after performing a heating/cooling cycle in PCR unit (which unravels aptamers and releases the toxin) followed by washing out the toxins in PBB buff-er containing MgCl2. The recovered OPW chips could
be used again after this treatment (such attempts were carried out with the re-used OPW chips showing similar responses); alternatively, the OPW chips immersed in PBB could be stored in a fridge at 4 °C for few weeks. The repeating of a thermo-cycle is advisable before the use.
10-3 10-2 10-1 100 101 102 103 0
20 40 60 80 100 120
10-3 10-2
0 2 4 6 8 10 12
Accum
ul
at
ed p
hase
shi
ft
(
rad.
)
Total concentration of AFT b1 (ng/ml)
b
a
Fig. 5 aConcentration
dependence of phase shifts caused by consecutive injections of AFT B1 (blue columns) and during washing out of toxins (red columns).bAccumulated phase shift vs the total concentration of AFT B1. Inset shows zoomed-in section of the diagram (b)
[image:7.595.232.546.48.509.2]Conclusions and future work
The main aim of developing the experimental setup for polarization interferometry biosensor based on optical pla-nar waveguide suitable for in vitro detection of mycotoxins was achieved. After several stages of upgrading, which involved changes in the waveguide design and optical components as well as the improvement of signal process-ing, the sensor showed much clear (less noisy) output sig-nals with leveled amplitudes. Much higher refractive index sensitivity of around 9600 rad/RIU was achieved as a re-sult, which was similar to the values reported for MZ interferometer-based biosensors [11, 17]. A series of in vitro biosensing tests of detecting aflatoxin B1 in a di-rect assay with specific aptamer were successful; the PI OPW biosensor was capable of detecting 1 pg/mL of afla-toxin B1. The LDL estimated as 0.7 pg/mL is much lower than that reported for other biosensing techniques, for ex-ample, optical methods of SPR (1.5 ng/mL), LSPR using functionalized gold nanoparticles (0.2 ng/mL), LSPR/ TIRE (0.01 ng/mL), and electrochemical method of imped-ance spectroscopy 0.5 ng/mL SPR [32].
The use of aptamers showed several advantages over traditional bioreceptors, e.g., antibodies including the following: (i) the low cost of aptamers, (ii) their stabil-ity and re-usabilstabil-ity, (iii) relative simplicstabil-ity of immobili-zation, and (iv) selectivity similar to that of antibodies. In terms of performance, the PI OPW biosensors are similar to MZ interferometer–based ones, though having a much simpler design. The developed PI OPW biosen-sors can be used as a platform biosensing technology for detection of various analytes of interest for different applications including environmental control, agriculture and food industry, and biomedical fields.
As a result of the 3-year project funded by NATO SPS, the PI OPW biosensor reached the stage of commercial develop-ment. The future work could involve (i) further improvement of the planar waveguide sensor design using photolithography to make several narrow waveguide channels for simultaneous detection of several analytes, (ii) scaling down the sensor de-sign to a hand-held type of devices suitable for the point-of-need biosensing, (iii) further development of the data acquisi-tion system by simultaneous calculaacquisi-tion of the phase shift, and (iv) the detection of mycotoxins in a complex matrix of real samples of food extracts and drinks.
Funding information This work was funded by NATO SPS program, project NUKR.SFPP 984637.
Compliance with ethical standards
Conflict of interest The authors declare that they have no conflict of interest.
Open Access This article is distributed under the terms of the Creative C o m m o n s A t t r i b u t i o n 4 . 0 I n t e r n a t i o n a l L i c e n s e ( h t t p : / / creativecommons.org/licenses/by/4.0/), which permits unrestricted use, distribution, and reproduction in any medium, provided you give appropriate credit to the original author(s) and the source, provide a link to the Creative Commons license, and indicate if changes were made.
References
1. Peraica M, Radic B, Lucic A, Pavlovic M. Toxic effects of myco-toxins in humans. Bull World Health Organ. 1999;77:754–66. 2. Worldwide Mycotoxin Regulations. Romer Labs. 2016:https://
www.romerlabs.com/en/ knowledge-center/knowledgelibrary/ articles/news/ worldwide-mycotoxin-regulations/
3. Nabok A. Biosensors for security and bioterrorism applications. In: Nikolelis DP, Nikoleli GP, editors. Advanced sciences and technol-ogies in security applications. Berlin/Heidelberg: Springer; 2016. p. 491–508.
4. Nabok A, Tsargorodskaya A, Hassan AK, Starodub NF. Total in-ternal reflection ellipsometry and SPR detection of low molecular weight environmental toxins. Appl Surf Sci. 2005;246:381–6. 5. Nabok A, Tsargorodskaya A. The method of total internal reflection
ellipsometry for thin film characterisation and sensing. Thin Solid Films. 2008;516:8993–9001.
6. Nabok A, Tsargorodskaya A, Mustafa MK, Szekacs I, Starodub NF, Szekacs A. Detection of low molecular weight toxins using optical phase detection techniques. Sensors Actuators B Chem. 2011;154: 232–7.
7. Al-Rubaye A, Nabok A, Catanante G, Marty J-L, Takacs E, Szekacs A. Detection of ochratoxin A in aptamer assay. Sensors Actuators B Chem. 2018;263:248–51.
8. Shirshov YM, Snopok BA, Samoylov AV, Kiyanovskij AP, Venger EF, Nabok AV, et al. Analysis of the response of planar interferom-eter to molecular layer formation: fibrinogen adsorption on silicon nitride surface. Biosens Bioelectron. 2001;16:381–90.
9. Nabok A, Al-Jawdah AM, Tsargorodska A. Development of planar waveguide-based immunosensor for detection of low molecular weight molecules such as mycotoxins. Sensors Actuators B Chem. 2017;247:975–80.
10. Al-Jawdah AM, Nabok A, Holloway A, Tsargorodska A, Takacs E, Szekacs A. Toxins. 2018;10:272–7.
11. Lechuga LM. Optical biosensors. Compr Anal Chem. 2005;44: 209–50.
12. Zinoviev KE, González-Guerrero AB, Domínguez C, Lechuga LM. Integrated bimodal waveguide interferometric biosensor for label-free analysis. J Lightwave Technol. 2011;29:1926–30.
13. Dante S, Duval D, Sepulveda B, Gonzales-Guerrero AB, Sendra JR, Lechuga LM. All-optical phase modulation for integrated inter-ferometric biosensor. Opt Express. 2012;20:7195–205.
14. Gavela AF, García DG, Ramirez JC, Lechuga LM. Last advances in silicon-based optical biosensors. Sensors. 2016;16:285–300. 15. Carrascosa LG, Huertas CS, Lechuga LM. Prospects of optical
biosensors for emerging label-free RNA analysis. Trends Anal Chem. 2016;80:177–89.
16. Sun Y, Fan X. Optical ring resonators for biochemical and chemical sensing. Anal Bioanal Chem. 2011;399:205–11.
17. Kozma P, Kehl F, Ehrentreich-Förster E, Stamm C, Bier FF. Integrated planar optical waveguide interferometer biosensors: a comparative review. Biosens Bioelectron. 2014;58:287–307. 18. Misiakos K, Kakabakos SE, Petrou PS, Ruf HH. A monolithic
19. Kitsara M, Misiakos K, Raptis I, Makarona E. Integrated optical frequency-resolved Mach-Zehnder interferometers for label-free af-finity sensing. Opt Express. 2010;18:8193–206.
20. Misiakos K, Petrou PS, Kakabakos SE, Yannoukakos D, Contopanagos H, Knoll T, et al. Fully integrated monolithic opto-electronic transducer for real-time protein and DNA detection. The NEMOSLAB approach. Biosens Bioelectron. 2010;26:1528–35. 21. Misiakos K, Raptis I, Makarona E, Botsialas A, Salapatas A,
Oikonomou P. All-silicon monolithic Mach-Zehnder interferometer as a refractive index and bio-chemical sensor. Opt Express. 2014;22:26803–13.
22. Hamula CL, Guthrie JW, Zhang H, Li XF, Le XC. Selection and analytical applications of aptamers. Trends Anal Chem. 2006;25: 681–91.
23. Mairal T, Ozalp VC, Lozano P, Sanchez Mir M, Katakis I, O’Sullivan CK. Aptamers: molecular tools for analytical applica-tions. Anal Bioanal Chem. 2008;390:989–1007.
24. Bueno D, Mishra RK, Hayat A, Catanante G, Sharma V, Muñoz R, et al. Portable and low cost fluorescence set-up for in-situ screening of ochratoxin A. Talanta. 2016;159:395–400.
25. Catanante G, Mishra RK, Hayat A, Marty J-L. Sensitive analytical performance of folding based biosensor using methylene blue tagged aptamers. Talanta. 2016;153:138–44.
26. Mishra RK, Hayat A, Catanante G, Istamboulie G, Marty J-L. Sensitive quantitation of ochratoxin A in cocoa beans using differ-ential pulse voltammetry based aptasensor. Food Chem. 2016;192: 799–804.
27. Al Rubaye A, Nabok A, Catanante G, Marty J-L, Takacs E, Szekacs A. Optical aptamer biosensors based on gold nanostructures for detection of mycotoxins. Toxins. 2018;10(7):291–8.
28. Xu Y, Chan CT, Chen H. Goos-Hanchen effect in epsilon-near-zero metamaterials. Sci Rep. 2015;5:8681–5.
29. Azzam RMA. Phase shifts that accompany total internal reflection at a dielectric–dielectric interface. J Opt Soc Am A. 2004;21:1559– 63.
30. Ma X, Wang W, Chen X, Xia Y, Wu S, Duan N, et al. Selection, identification, and application of aflatoxin B1 aptamer. Eur Food Res Technol. 2014;238:919–25.
31. Batey RT, Rambo RP, Doudna JA. Tertiary motifs in RNA structure and folding. Angew Chem. 1999;38:2326–43.
32. Nabok A, Al-Rubaye A, Al-Jawdah A, Tsargorodska A, Marty JL, Catanante G, et al. Novel optical biosensing technologies for detec-tion of mycotoxins. Opt Laser Technol. 2019;109:212–21.
Publisher’s note Springer Nature remains neutral with regard to jurisdictional claims in published maps and institutional affiliations.