Analysis of finger motion coordination during packaging
interactions
YOXALL, Alaster <http://orcid.org/0000-0002-0954-2725>, GONZALEZ, V.
and ROWSON, J.
Available from Sheffield Hallam University Research Archive (SHURA) at:
http://shura.shu.ac.uk/15730/
This document is the author deposited version. You are advised to consult the
publisher's version if you wish to cite from it.
Published version
YOXALL, Alaster, GONZALEZ, V. and ROWSON, J. (2018). Analysis of finger motion
coordination during packaging interactions. Packaging Technology and Science, 31
(6), 389-400.
Copyright and re-use policy
See
http://shura.shu.ac.uk/information.html
Sheffield Hallam University Research Archive
A
NALYSIS OF FINGER MOTION COORDINATION
DURING PACKAGING INTERACTIONS
Yoxall A.1, Gonzalez, V.2, Rowson, J.2
1 Art and Design Research Centre, Sheffield Hallam University, Sheffield, UK 2 Department of Mechanical Engineering, University of Sheffield, Sheffield, UK
A
BSTRACT
Packaging accessibility is a significant problem for many older people. Whilst the majority of studies have focused on issues surrounding strength, work has shown that dexterity required to open a pack is also a major issue for many older people.
Hence, the work undertaken here, reports a quantitative study that aimed to analyse motion coordination patterns across digits 2–5 (index to little finger) during interactions with three of the most common types of packaging: plastic bottles, jars, and crisps packets, and comparing those interactions to a common measure of dexterity, the Perdue Pegboard. Ten subjects (6 males and 4 females) were examined while reaching forward to grasp and open a 300ml plastic bottle and a 500g jar. A ten-camera opto-electronic motion capture system measured trajectories of 25 miniature reflective markers placed on the dorsal surface landmarks of the hand. Joint angular profiles for 12 involved flexion–extension movements were derived from the measured coordinates of surface markers.
The results showed that finger correlations vary widely across the differing pack formats with the crisps having the lowest finger movement correlation and the jar having the highest. Speed and jerk metrics were also seen to vary across the various pack formats. However, finger correlations were seen to be more relevant to perceived dexterity of pack opening than finger speeds and jerk motions.
INTRODUCTION
Less work has been undertaken on issues surrounding dexterity and visual acuity or cognition of packaging. Leitkam et al. [13], have undertaken a series of studies examining font sizes and labelling for consumers, whilst Yoxall et al. [2], [14], has undertaken several studies comparing the time taken to open packaging with dexterity as measured using a Purdue pegboard.
The Purdue Pegboard (PBT) is one of the most widely used tests of hand function for therapy, rehabilitation, and treatment assessment purposes. It was developed by Dr. Joseph Tiffin, an Industrial Psychologist at Purdue University, in 1948 [15], and originally intended for assessing the dexterity of assembly line workers.
The PBT tests the quality and the speed of performance of the hand as the person accomplishes a task. More precisely, it assesses proficiency of one particular grasping pattern, the precision grip[16]. It has been shown, however, that there are several factors that account for manipulative tasks [17]–[21], and the degree with which the Purdue Pegboard Test assesses individual factors has yet to be investigated.
Whilst the work by Yoxall [2], [5] attempted to understand the effect of dexterity related to different forms of packaging using the dexterity measure as a way of ranking the packaging, no attempt was made to understand the actual nature of the dexterity required to open the pack, i.e. what the fingers needed to do or the movements required. Hence, this study aims to understand the motion, trajectory, speed and effort required to open several forms of packaging and relate that to a normative dexterity method.
Previous works have shown that finger movements during manipulative tasks rarely involve motion or rotation at a single joint. Anatomical factors, such as interdigit webbings, connections between various tendons, insertions of extrinsic finger muscles, and neuronal connections result in mechanical and neural couplings between various joints. The sum of mechanical and neural coupling generates coordinated movements between various joints [22]–[25]. Thus the proficient grasping of an object entails simultaneous motion at multiple joints, with correlated rotations [23]. Simultaneous correlated motion at multiple joints has been studied during more dexterous uses of the hand, such as typing [16], playing the piano [26], and haptic interactions [27], but a standard procedure to assess such movement synergies has not been developed. Moreover, a study involving packaging interactions and hand postures has yet to be developed.
Previous works in patients recovering from stroke and other motor related impairments revealed a reduction in trajectory smoothness and segmentation of continuous movements [31], [39]. However, evidence of discrete sub- movements has also been found in the movements of healthy subjects [40], and decomposition of complex movements into sub-movements has been implemented as analysis tool as they account for many patterns in human movement [41]. However, studies investigating the degree to which speed and jerk metrics can reflect dexterity when interacting with packaging and, particularly the relation of such metrics with finger correlated movement and perception of dexterity are still lacking.
M
ETHODOLOGY
E
XPERIMENTALP
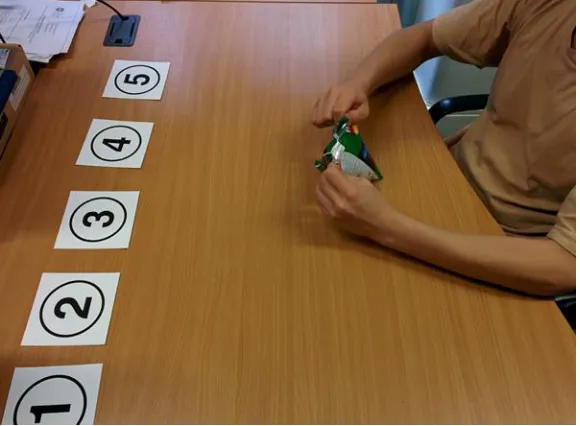
ROTOCOLThis study examined 10 healthy participants (6 male, 4 female, all right-handed, age 22-38 years, 26 ± 6.2 years) performing four tasks: grasping and opening a 300ml plastic bottle, grasping and opening a 500g jar, grasping and opening a 25g crisps packet, and the Purdue Pegboard Test.
Following the tasks, the participants were asked to rate the perceived dexterity and strength required to perform each task from low (1) to high (5) in an ordinal scale.
All movements began in a consistent seated posture with the torso upright, the right upper arm approximately vertical and forearm horizontal, the fingers in natural full extension (abduction/adduction not specified), and the palm resting on a specified area on the table.
The participants carried out three repetitions of each task with a 10-second pause between each trial.
E
THICAL APPROVAL FOR THE STUDYThe University of Sheffield’s Department of Mechanical Engineering Ethics Committee approved the experimental protocol.
D
ATAA
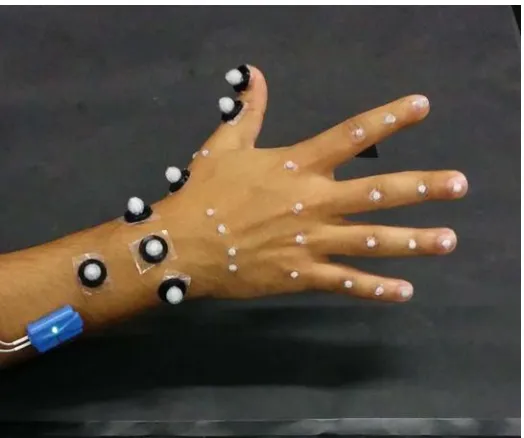
CQUISITIONThe acquisition technique consisted of the placement of 25 reflective markers (diameter 4mm) on different anatomical hand landmarks.
For the thumb, first marker was placed on the metacarpal base, second marker on the MCP joint, fourth on the IP joint and the fifth marker on the nail. One marker was placed on the wrist, aligned with the middle finger, on the wrist dorsum.
A ten-camera Vicon T-160 opto-electronic motion capture system (Oxford Metrics Ltd., UK) recorded the reflective marker movements at a sampling frequency of 120 Hz, and produced the time-varying marker coordinates in a three-dimensional laboratory coordinate system (X–Y–Z) established through calibration. The experimental set-up used for the analysis is shown in Figure 1 below.
A local coordinate system X0–Y0–Z0 was established to facilitate kinematic descriptions and definitions (Figure 2). The origin of this local coordinate system was the marker adhered to the dorsal landmark of wrist again as shown in Figure 2. The coordinates of the markers measured in the global (laboratory) coordinate system (X –Y –Z) were transformed and expressed in the local coordinate system (X0–Y0–Z0). From the local coordinates, the time-varying angles for all the involved joints were derived through a computational procedure.
The flexion portions of angular profiles for the metacarpophalangeal (MCP), proximal interphalangeal (PIP), and distal interphalangeal (DIP) joints of digits 2–5, a total of 12 movements, were analyzed in this study.
The starting time was defined as the frame during which the first increase in the moving of joint angles occurred, and the final time was defined as the frame during which the last decrease in the moving of joint angles occurred. The angular profiles were later normalised and a total movement time period was determined.
D
ATAA
NALYSISThe analysis consisted of the computation of a cross-correlation coefficient matrix for the joint angles of interest. A matrix X, whose rows are observations (instantaneous joint angles) and whose columns are variables (degree of freedom), was defined from data from the last trial of each task for each subject in order to reduce error due to learning effect.
Where R, is the zeroth lag of the normalized covariance function.
Significance of the correlation values was examined for p < 0.05, and for all correlation coefficients n = 10, df = 8.
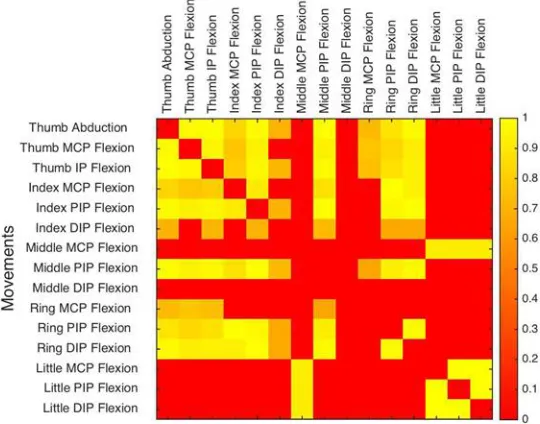
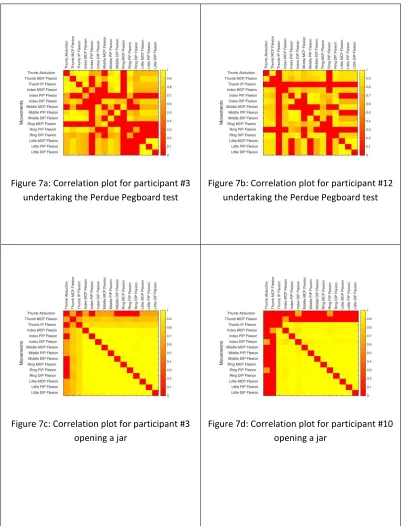
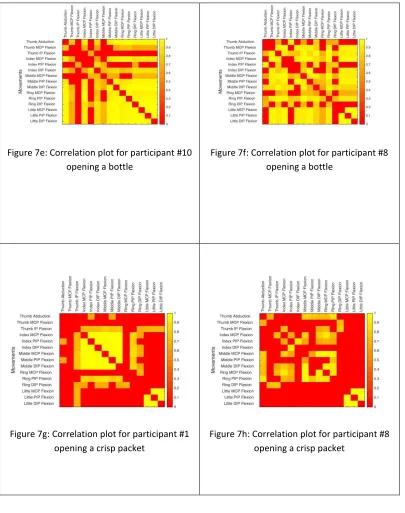
Data from each matrix R was represented as a colour map, with red indicating low correlation (coefficients between 0 - 0.5) and yellow indicating high correlation (coefficients between 0.6 and 1.0) (Figure 4).
A second analysis consisted of the inspection of the joint angular profiles’ sigmoidal shape. The proximal-to-distal flexion sequences across digits 2–5 for each joint type were then examined and compared with data from the correlation matrices to identify their possible relation.
The analysis consisted of the computation of the magnitude of the velocities, accelerations, and jerk by two-point numerical differentiation of positional data.
Jerk at each time point was computed according to the following equation,
The jerk metric (Jm) used for this study was calculated by dividing the negative mean jerk magnitude by the peak speed:
Taking the negative of the mean jerk makes the jerk metric directly proportional with smoothness, transforming this metric into a measure of smoothness. Dividing the jerk magnitude by peak speed normalizes the metric, making it less sensitive to changes in overall movement speed. The jerk metric has units of 1/s2.
The mean speed of such a movement is much less than its peak, making the normalized mean speed relatively low. A smooth movement tends to have fewer sub-movements and thus, fewer sudden stops, resulting in significantly higher normalized mean speeds.
Results
Perception Analysis
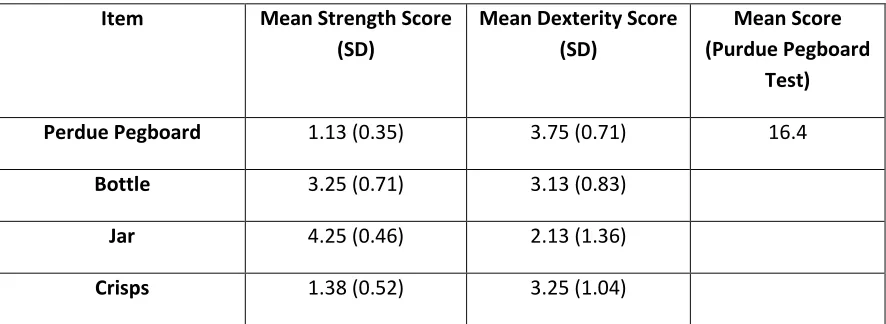
All the of the 10 users were asked to open the packaging and perform the Purdue Pegboard Test and asked to rate the interactions on a scale of 1 to 5 on their perception of the strength and dexterity. Participants were provided with a definition of strength and dexterity before undertaking the test. A score of 1 represented that the perception of the dexterity needed was low and a score of 5 rated that the perception of the dexterity needed was high (Figure 6).
The 10 participants were also asked to rate the manipulative task based on their perception of the strength needed to perform the task. A score of 1 represented that the perception the strength needed was low and a score of 5 rated that the perception of the strength needed was high (Table 1).
Scores from the Purdue Pegboard across participants were averaged and are presented along the perception results in Table 1.
Item Mean Strength Score (SD)
Mean Dexterity Score (SD)
Mean Score (Purdue Pegboard
Test)
Perdue Pegboard 1.13 (0.35) 3.75 (0.71) 16.4
Bottle 3.25 (0.71) 3.13 (0.83)
Jar 4.25 (0.46) 2.13 (1.36)
[image:7.612.85.528.437.599.2]Crisps 1.38 (0.52) 3.25 (1.04)
Table 1: Perceived strength and dexterity rating scores for all tasks
Correlation Analysis
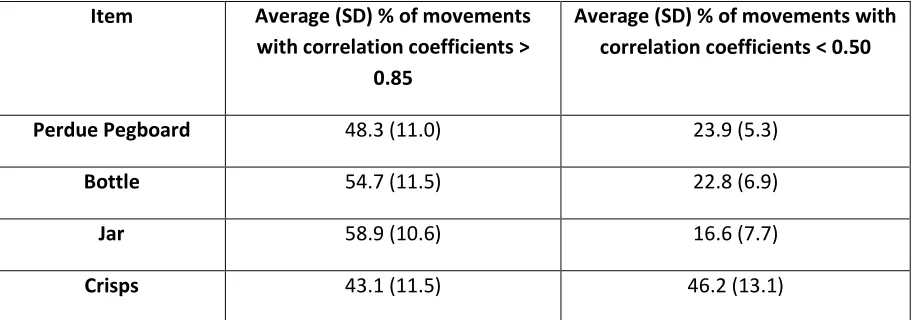
high finger correlation, i.e. over 0.85 or low finger correlation, i.e. less than 0.5 average (and standard deviation) for all 10 subjects tested.
The plots show that the degree of finger correlation, i.e. fingers moving together in a coordinated way, is highest for the jar (58.9%, with a standard deviation of 10.6%) than the bottle (54.7%, with a standard deviation of 11.5%) compared to the Perdue pegboard (48.3%, with a standard deviation of 11.0%) with the crisp opening event having the lowest finger correlation (43.1%, with a standard deviation of 11.5%).
Item Average (SD) % of movements with correlation coefficients >
0.85
Average (SD) % of movements with correlation coefficients < 0.50
Perdue Pegboard 48.3 (11.0) 23.9 (5.3)
Bottle 54.7 (11.5) 22.8 (6.9)
Jar 58.9 (10.6) 16.6 (7.7)
[image:8.612.79.536.223.383.2]Crisps 43.1 (11.5) 46.2 (13.1)
Table 2: Average Finger Correlation % with correlation coefficients > 0.85 and correlation coefficients < 0.50
Speed and jerk Analysis
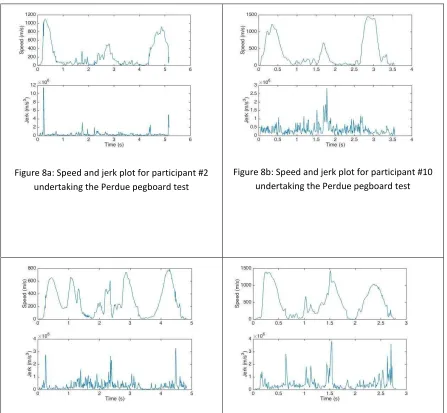
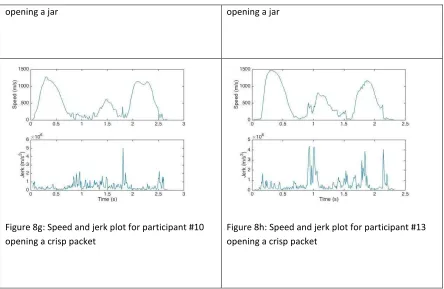
Plots of speed and jerk smoothness metrics for the Purdue pegboard, bottle jar and crisp packet are shown in the following Figures 8a-h. The figures are chosen as representative examples of the measured outputs for various tasks and differing participants and are presented to show trends for each pack type. From the figures it can be readily seen that peak finger speed and jerk are similar for all tasks measured. Examining the 'peakiness' of each event, i.e. the number of peaks over 500 m/s the bottle that last for over 2.5 m/s here again the events are very similar with typically three peaks measured for the bottle, jar and crisps. However, the Perdue pegboard has a slightly lower average of 2.55 peaks.
Item Average Speed metric (Standard Deviation) m/s
Average Jerk Metric (Standard Deviation) m/s3
Perdue Pegboard 0.24 (0.03) -0.009 (0.0025)
Bottle 0.28 (0.07) -0.016 (0.008)
Jar 0.33 (0.03) -0.013 (0.006)
Crisps 0.33 (0.04) -0.012 (0.004)
Table3: Speed and jerk metrics for all measured tasks
Discussion
This research has used several metrics to understand finger movements and relate them to packaging opening and dexterity. To date little work has been undertaken looking at dexterity and packaging accessibility and the understanding of finger movements and generating smoothness metrics is also a relatively new field.
Moreover, although the complex correlated movements of the hand have been investigated in previous studies, an in-depth investigation into the effects of correlated movement and velocity in packaging accessibility and their relation with perceived dexterity had yet to be made [44]–[47].
To that end this work has taken three packaging formats that are generally different in their opening properties, a jar (known to be largely an issue of strength), a bottle (that has elements of fine finger movements) and crisp pack which has elements of precision grip and fine fingers and studied them in detail using optical methods to measure finger correlations, finger speed and movement smoothness.
The opening events were compared to a known measure of dexterity, the Perdue pegboard and a participant perception test, and scores from the dexterity test were used to assess the average manual ability of the participants.
This study presents evidence of identifiable finger correlation patterns during packaging interactions, with clear differences based on the grasping pattern, strength, and dexterity required. Moreover, the current study discovered that finger correlation patterns are consistent with the complexity of the task, the number of sub-movements involved and the degree of independent finger movement required.
tasks under analysis. It has been shown how the wide range of strategies and grasping patterns used to interact with packaging limits the accuracy and robustness of a single time-based test.
Normative data for the Purdue Pegboard Test indicated participants were in line with average healthy adults performing the right hand (RH) Purdue Pegboard Test [42], [43]. Correlation coefficients from the Purdue Pegboard Test were the lowest when compared with the packaging tasks, indicating a lower degree of finger coordination and less coordinated fingers flexion was required to perform this task. In addition, participants coincided in rating the Purdue Pegboard Test as the most dexterous task (3.75/5). These results may suggest that finger correlated movements are strongly associated with independent finger movement and, particularly, perceived dexterity. Normative data for the Purdue Pegboard Test indicates participants are in line with average healthy adults performing the right hand (RH) Purdue Pegboard Test [42], [43].
From the selection of packaging tasks, bottle opening produced the lowest correlation coefficients, with participants rating perceived dexterity for this task higher when compared to the jar opening task, further suggesting the relation between finger correlated movements and perception of dexterity.
Speed and jerk metrics proved to be consistent with the number of movements required to perform the task, with bottle opening having the lowest movement smoothness as measured from speed and jerk. These results, however, were not consistent with perceived dexterity, with participants considering the Purdue Pegboard Test as the more dexterous task. Furthermore, results from the analysis of trajectory suggest a strong relation between object size and movement smoothness, with tasks requiring manipulation of larger objects resulting in smoother trajectories (larger speed and jerk metrics).
Conclusions
A series of metrics have been successfully used to examine finger dexterity and packaging accessibility, namely; finger correlations analysis, speed and jerk measurements, and a dexterity perception test.
However, in examining speed and jerk, whilst the jar and crisps have very different finger correlation measurements, their speed and jerk metrics are almost identical whilst the Perdue pegboard and the bottle have the lowest speed and jerk metrics.
Examining perception scores the Perdue pegboard scores highest on perceived dexterity and the jar the lowest. Given that that the Perdue pegboard has the lowest speed and jerk scores but the highest perceived dexterity score, we can assume that perceived dexterity of the packaging accessibility task is related to finger correlation and not finger speed. Similarly the jar has the lowest perceived dexterity score and the highest correlation, again indicating that there is a likely link to finger coordination and perceived dexterity.
Hence packaging that forces users to use highly uncoordinated grip patterns is likely to result in users perceiving the packaging to need high amounts of dexterity. Packaging that needs high amounts of dexterity to access is often perceived as 'fiddly' by consumers and has a higher chance of being unopenable by older consumers. Therefore 'non-fiddly' easy open packaging should be designed to facilitate the use of coordinated grip patterns, whilst minimizing the strength needed to also access the pack.
References
[1] American Dialect Society, “American Dialect Society,”
Word of the
Year 2007
, p. 81, 2008.
[2] B. A. Yoxall, J. Luxmoore, M. Austin, L. Canty, K. J. Margrave, C. J.
Richardson, J. Wearn, I. C. Howard, and R. Lewis, “Getting to Grips
with Packaging : Using Ethnography and Computer Simulation to
Understand Hand – Pack Interaction and Science,”
Packag. Technol.
Sci.
, no. October 2006, pp. 217–229, 2007.
[3] B. Carse, A. Thomson, and B. Stansfield, “Use of biomechanical data in
the Inclusive Design process : packaging design and the older adult,”
J.
Eng. Des.
, vol. 21, no. June, pp. 289–303, 2010.
[4] M. Galotto and P. Ulloa, “Effect of high‐pressure food processing on
the mass transfer properties of selected packaging materials,”
Packag. Technol. Sci.
, vol. 23, no. May, pp. 253–266, 2010.
[5] J. Rowson and a Yoxall, “Hold, grasp, clutch or grab: consumer grip
choices during food container opening.,”
Appl. Ergon.
, vol. 42, no. 5,
pp. 627–33, Jul. 2011.
[6] A. Yoxall and R. Janson, “Fact or friction: A model for understanding
the openability of wide mouth closures,”
Packag. Technol. Sci.
, vol.
21, no. 3, pp. 137–147, 2008.
[7] F. Rholes, K. L. Moldrup, and J. E. Laviana, “Opening jars: an
anthropometric study of the wrist twisting strength in elderly,” in
Proceedings of the Human Factors Society 27th Annual Meeting
, 1983,
pp. 112–116.
[8] Department of Trade and Industry, “Tha Handbook of Measurements
and capabilities of the Older Adult. Strength Data for Design Safety.,”
2000.
[10] F.-C. Su, H.-Y. Chiu, J.-H. Chang, C.-F. Lin, R.-F. Hong, and L.-C. Kuo,
“Jar-opening challenges. Part 1: an apparatus for assessing hand and
finger torques and forces in a jar-opening activity.,”
Proc. Inst. Mech.
Eng. H.
, vol. 223, no. 1, pp. 121–129, 2009.
[11] L. C. Kuo, J. H. Chang, C. F. Lin, H. Y. Hsu, K. Y. Ho, and F. C. Su,
“Jar-opening challenges. Part 2: estimating the force-generating capacity
of thumb muscles in healthy young adults during jar-opening tasks.,”
Proc. Inst. Mech. Eng. H.
, vol. 223, no. 5, pp. 577–588, 2009.
[12] S. T. Leitkam, T. R. Bush, and L. Bix, “Determining functional finger
capabilities of healthy adults: comparing experimental data to a
biomechanical model.,”
J. Biomech. Eng.
, vol. 136, no. 2, p. 021022,
2014.
[13] S. T. Leitkam, L. Bix, J. de la Fuente, and T. Reid Bush, “Mapping
kinematic functional abilities of the hand to three dimensional shapes
for inclusive design,”
J. Biomech.
, vol. 48, no. 11, pp. 2903–2910,
2015.
[14] A. Yoxall, E. M. Rodriguez-Falcon, and J. Luxmoore, “Carpe diem,
Carpe ampulla: a numerical model as an aid to the design of
child-resistant closures.,”
Appl. Ergon.
, vol. 44, no. 1, pp. 18–26, Jan. 2013.
[15] J. Tiffin and E. Asher, “The Purdue pegboard test; norms and studies
of reliability and validity,”
J. Appl. Psychol.
, vol. 32, no. 3, pp. 234–47,
1948.
[16] J. F. Soechting and M. Flanders, “Flexibility and repeatability of finger
movements during typing: Analysis of multiple degrees of freedom,”
J.
Comput. Neurosci.
, vol. 4, no. 1, pp. 29–46, 1997.
[17] E. a. Fleishman and W. E. Hempel, “A Factor Analysis of Dexterity
Tests,”
Pers. Psychol.
, vol. 7, no. 1, pp. 15–32, Mar. 1954.
[18] A. Pennathur, L. R. Contreras, K. Arcaute, and W. Dowling, “Manual
dexterity of older Mexican American adults: a cross-sectional pilot
experimental investigation,”
Int. J. Ind. Ergon.
, vol. 32, no. 6, pp. 419–
431, Dec. 2003.
Müri, and S. Bohlhalter, “Impaired finger dexterity in Parkinson’s
disease is associated with praxis function.,”
Brain Cogn.
, vol. 77, no. 1,
pp. 48–52, Oct. 2011.
[20] F. J. Valero-Cuevas, N. Smaby, M. Venkadesan, M. Peterson, and T.
Wright, “The strength-dexterity test as a measure of dynamic pinch
performance.,”
J. Biomech.
, vol. 36, no. 2, pp. 265–70, Feb. 2003.
[21] M. L. Latash and M. T. Turvey,
Dexterity and its development,
.
Mahwah, New Jersey: Lawrence Erlbaum Associates, Inc, 1996.
[22] F.-C. Su, Y. L. Chou, C. S. Yang, G. T. Lin, and K. N. An, “Movement of
finger joints induced by synergistic wrist motion.,”
Clin. Biomech.
(Bristol, Avon)
, vol. 20, no. 5, pp. 491–7, Jun. 2005.
[23] M. Santello and J. F. Soechting, “Force synergies for multifingered
grasping,”
Exp. Brain Res.
, vol. 133, no. 4, pp. 457–467, Aug. 2000.
[24] I. V Grinyagin, E. V Biryukova, and M. a Maier, “Kinematic and
dynamic synergies of human precision-grip movements.,”
J.
Neurophysiol.
, vol. 94, no. 4, pp. 2284–94, Oct. 2005.
[25] M. Tagliabue, A. L. Ciancio, T. Brochier, S. Eskiizmirliler, and M. a.
Maier, “Differences between kinematic synergies and muscle
synergies during two-digit grasping,”
Front. Hum. Neurosci.
, vol. 9, no.
March, pp. 1–17, 2015.
[26] K. C. Engel, M. Flanders, and J. F. Soechting, “Anticipatory and
sequential motor control in piano playing.,”
Exp. brain Res.
, vol. 113,
no. 2, pp. 189–199, 1997.
[27] P. H. Thakur, A. J. Bastian, and S. Hsiao, “Multidigit movement
synergies of the human hand in an unconstrained haptic exploration
task.,”
J Neurosci
, vol. 28, no. 6, pp. 1271 – 1281, 2008.
[28] N. Hogan and T. Flash, “The Coordination of Arm Movements:
Mathematical Model,”
J. Neurosci.
, vol. 5, no. 7, pp. 1688–1703, 1985.
[29] Q. C. Pham, H. Hicheur, G. Arechavaleta, J. P. Laumond, and A.
Berthoz, “The formation of trajectories during goal-oriented
locomotion in humans. II. A maximum smoothness model,”
Eur. J.
[30] B. Poston, A. W. a Van Gemmert, S. Sharma, S. Chakrabarti, S. H.
Zavaremi, and G. Stelmach, “Movement trajectory smoothness is not
associated with the endpoint accuracy of rapid multi-joint arm
movements in young and older adults.,”
Acta Psychol. (Amst).
, vol.
143, no. 2, pp. 157–67, Jun. 2013.
[31] H. I. Krebs, M. L. Aisen, B. T. Volpe, and N. Hogan, “Quantization of
continuous arm movements in humans with brain injury.,”
Proc. Natl.
Acad. Sci. U. S. A.
, vol. 96, no. 8, pp. 4645–9, Apr. 1999.
[32] R. C. Miall and P. N. Haggard, “The curvature of human arm
movements in the absence of visual experience.,”
Exp. brain Res.
, vol.
103, no. 3, pp. 421–8, Jan. 1995.
[33] D. Goldvasser, C. a. McGibbon, and D. E. Krebs, “High curvature and
jerk analyses of arm ataxia,”
Biol. Cybern.
, vol. 84, pp. 85–90, 2001.
[34] J. J. Boessenkool, E. J. Nijhof, and C. J. Erkelens, “A comparison of
curvatures of left and right hand movements in a simple pointing
task.,”
Exp. brain Res.
, vol. 120, no. 3, pp. 369–76, Jun. 1998.
[35] T. Flash, R. Inzelberg, E. Schechtman, and a. D. Korczyn, “Kinematic
analysis of upper limb trajectories in Parkinson’s disease,”
Exp.
Neurol.
, vol. 118, no. 2, pp. 215–226, 1992.
[36] S. Schneiberg, P. Mckinley, E. Gisel, H. Sveistrup, and M. F. Levin,
“Reliability of kinematic measures of functional reaching in children
with cerebral palsy,”
Dev. Med. Child Neurol.
, vol. 52, no. 7, pp. 167–
173, 2010.
[37] E. Todorov and M. I. Jordan, “Smoothness maximization along a
predefined path accurately predicts the speed profiles of complex
arm movements.,”
J. Neurophysiol.
, vol. 80, pp. 696–714, 1998.
[38] S. Schaal and D. Sternad, “Origins and violations of the 2/3 power law
in rhythmic three-dimensional arm movements,”
Exp. Brain Res.
, vol.
136, no. 1, pp. 60–72, 2001.
[40] A. B. Vallbo and J. Wessberg, “Organization of motor output in slow
finger movements in man,”
J. Physiol.
, pp. 673–691, 1993.
[41] J. a. Doeringer and N. Hogan, “Serial processing in human movement
production,”
Neural Networks
, vol. 11, no. 7–8, pp. 1345–1356, 1998.
[42] N. Amirjani, N. L. Ashworth, J. L. Olson, M. Morhart, and K. M. Chan,
“Validity and reliability of the Purdue Pegboard Test in carpal tunner
syndrome,”
Muscle Nerve
, vol. 43, no. 2, pp. 171–7, 2011.
[43] D. K. Lindstrom-Hazel and N. VanderVlies Veenstra, “Examining the
Purdue Pegboard Test for Occupational Therapy Practice,”
Open J.
Occup. Ther.
, vol. 3, no. 3, 2015.
[44] M. L. Latash, J. F. Scholz, F. Danion, and G. Schöner, “Finger
coordination during discrete and oscillatory force production tasks.,”
Exp. brain Res.
, vol. 146, no. 4, pp. 419–32, Oct. 2002.
[45] C. Castellini and P. Van Der Smagt, “Evidence of muscle synergies
during human grasping,”
Biol. Cybern.
, vol. 107, no. 2, pp. 233–245,
2013.
[46] P. H. Thakur, A. J. Bastian, and S. S. Hsiao, “Multidigit movement
synergies of the human hand in an unconstrained haptic exploration
task.,”
J. Neurosci.
, vol. 28, no. 6, pp. 1271–1281, 2008.
Figure 1: Ten-camera Vicon T-160 motion capture system
[image:17.612.90.352.354.573.2]Figure 3: Particpant undergoing testing opening a bottle
[image:18.612.99.369.391.603.2]Figure 5: Speed and jerk plot for participant #3 opening a jar
[image:19.612.90.380.313.526.2]Figure 7a: Correlation plot for participant #3 undertaking the Perdue Pegboard test
Figure 7b: Correlation plot for participant #12 undertaking the Perdue Pegboard test
Figure 7c: Correlation plot for participant #3 opening a jar
Figure 7e: Correlation plot for participant #10 opening a bottle
Figure 7f: Correlation plot for participant #8 opening a bottle
Figure 7g: Correlation plot for participant #1 opening a crisp packet
Figure 8a: Speed and jerk plot for participant #2 undertaking the Perdue pegboard test
Figure 8b: Speed and jerk plot for participant #10 undertaking the Perdue pegboard test
Figure 8c: Speed and jerk plot for participant #8 opening a bottle
Figure 8e: Speed and jerk plot for participant #10 Figure 8f: speed and jerk plot for participant #13
[image:23.612.90.534.274.563.2]opening a jar opening a jar
Figure 8g: Speed and jerk plot for participant #10 opening a crisp packet