A conceptual framework for power generation technology
management for developing countries.
ALJAMEL, Suleiman Ahmed Mohamed.
Available from Sheffield Hallam University Research Archive (SHURA) at:
http://shura.shu.ac.uk/19245/
This document is the author deposited version. You are advised to consult the
publisher's version if you wish to cite from it.
Published version
ALJAMEL, Suleiman Ahmed Mohamed. (2010). A conceptual framework for power
generation technology management for developing countries. Doctoral, Sheffield
Hallam University (United Kingdom)..
Copyright and re-use policy
See
http://shura.shu.ac.uk/information.html
Sheffield Hallam University Research Archive
Adsetts Centre, city Campu® Sheffield S1 1WD
1 0 1 9 6 3 6 3 9 4
ProQuest Number: 10694125
All rights reserved
INFORMATION TO ALL USERS
The quality of this reproduction is dependent upon the quality of the copy submitted.
In the unlikely event that the author did not send a com plete manuscript and there are missing pages, these will be noted. Also, if material had to be removed,
a note will indicate the deletion.
uest
ProQuest 10694125
Published by ProQuest LLC(2017). Copyright of the Dissertation is held by the Author.
All rights reserved.
This work is protected against unauthorized copying under Title 17, United States C ode Microform Edition © ProQuest LLC.
ProQuest LLC.
789 East Eisenhower Parkway P.O. Box 1346
A CONCEPTUAL FRAMEWORK FOR POWER GENERATION
TECHNOLOGY MANAGEMENT FOR DEVELOPING COUNTRIES
BY
SULEIMAN AHMED MOHAMED ALJAMEL
THESIS SUBMITTED IN PARTIAL FULFILLMENT OF
REQUIREMENT FOR THE DEGREE OF DOCTOR OF PHILOSOPHY
SHEFFIELD HALLAM UNIVERSITY
ABSTRACT
Most of the current approaches of technology management emphasis on the need of
systematic technology management in both strategic and operational perspectives.
The majority of developing countries have a problem to manage technology
systematically and fail to implement management techniques effectively. There is a big
gap between developed and developing countries in most fields of technology and the
power generation sector is among them.
The goal of this research work is to develop a conceptual framework for power
generation technology management for developing countries. Also to draw a systematic
guide lines and clear strategy to help decision makers to optimise their decisions to save
resources and less harming to climate.
In this, work, a systematic approach is developed to select a suitable hard technology
for power generation technologies selection using the AHP software. A sensitivity
analysis is carried out to show how the decision is affected with the change in criteria
and sub-criteria. After this objective is achieved, some other soft technologies are
identified with their limits and integrated with hard technologies for power generation.
DEDICATION
To my family and friends who supported me throughout my study and work. Thank you
very much indeed for everything.
And to all people who worry about keeping the environment clean and safe, do not stop
this struggle.
ACKNOWLEDGEMENT
I would like to express my gratitude to Professor Terrence Perera as a director of study
for setting up the project and for his guidance and patience throughout the research
work. Special thanks must go to Professor Sameh Saad for his help during my research
as a second supervisor of my work.
CONTENTS
ABSTRACT... .II
DEDICATION... :... Ill
ACKNOWLEDGEMENT ... ... ... IV
LIST OF FIGURES ... XV
LIST OF TABLES... XVII
CHAPTER ONE: INTRODUCTION
1.1 General Introduction... 2
1.2 State of technology management in developing countries ... 2
1.3 Proj ect b ackground and obj ectives... 3
1.4 The Organization of the thesis... 4
CHAPTER TWO: LITERATURE REVIW OF TECHNOLOGY
MANAGEMENT IN DEVELOPING COUNTRIES
2.1 Introduction ... 72.2 Power generation in developing countries... ...7
2.3 Technology management definition (Hard and S o ft)... 11
2.4 Research of technology management in power generation Sector ... 17
2.5 Factors effecting technology management (R&D, S&T, Policies, TNC, FDI, Innovation Systems) ... 26
2.6 Conclusions and comments... 33
CHAPTER THREE: RESEARCH METHODOLOGY
3. Introduction... ... .
3.1 Understanding research... ...
3.1.1 Types of research...
3.1.2 Purpose of research...
3.1.2.1 Descriptive research...
3.1.2.2 Analytic or exploratory research ...
3.1.2.3 Predictive research...
3.2 Process of research... ... ...
3.2.1 Qualitative and quantitative research ...
3.2.2 The Choosing sample size ...
3.3 Logic of research... ...
3.3.1 Deductive and inductive research... .
3.4 The research stages ...
3.5 The research methodology...
3.5.1 Elements of proposed fram ew ork... ...
3.5.1.1 Hard technology selection... .
3.5.1.2 Soft technology selection ...
3.5.1.3 Integration...
3.6 Main criteria for power generation...
3.7 AHP model for power generation sector...
3.7.1 Justification of using AHP...
3.8 The. validation of model...
CHAPTER FOUR: HARD TECHNOLOGY IDENTIFICATION AND
CRITERIA FOR POWER GENERATION TECHNOLOGY
4.1 Introduction... 52
4.2 Electricity Generation... 52
4.3 The Evolution of Electricity Generation Technologies ... ..53
4.4 The Size of the Industry... 55
4.5 The Environmental Considerations... .57
4.5.1 The evolution of environmental aw areness... 58
4.5.2 The environmental effects of power generation... ’. ...60
4.5.3 The carbon cycle and atmospheric warming... ... ...61
4.6 Why Power Generation Technology? ... 64
4.7 Different Types of Power Generation Technologies. ... 65
4.7.1 Coal fired power technology... '..65
4.7.2 Gas turbine and combined cycle power plants ... ..67
4.7.2.1 Natural gas ... 69
4.7.2.2 Natural gas costs... .•... 71
4.7.2.3 Gas turbine technology... 72
4.7.2.4 Environmental impact of gas turbine ... 74
4.7.2.5 Cost of the gas turbine power stations ... 75
4.7.3 Diesel engine power generation technology ... .77
4.7.3.1 Engine size and speed... 79
4.7.3.2 Compression engines ... ....79
4.7.3.3 Environmental considerations...80
4.7.4 Nuclear power generation technology... .83
4.7.4.1 Global nuclear capacity. ... ...84
4.7.4.2 Fundamentals of nuclear p o w e r . ... 85
4.7.4.3 The future of nuclear generating technology ... .86
4.7.4.4 Environmental considerations of nuclear... .87
4.7.4.5 Radioactive waste... ...88
4.7.4.6 The cost of nuclear power... 89
4.7.5 Solar power... 91
4.7.5.1 Sites for solar power generation... 92
4.7.5.2 Solar technology ... 93
4.7.5.3 Environmental considerations of solar power... 94
4.7.5.4 The cost of solar power... 95
4.7.5.5 Solar thermal costs... 95
4.7.6 Solar photovoltaic costs ... 96
4.7.7 Wind power technology... • .97
4.7.7.1 Wind sites ... 99
A.I.1.2 Environmental considerations... ...100
A.1.1.2 The cost of wind power. ... 102
4.7.8 Geothermal power technologies ... 103
4.7.8.1 Geothermal fields ... -106
4.7.8.2 Geothermal energy conversion technology... .. 108
4.7.8.3 Environmental considerations... .108
4.7.8.4 The cost of geothermal power... 110
4.7.9 Hydropower technology... 112
4.7.9.2 Hydropower sites ... 1'16
4.7.9.3 Small hydropower. ... ... ... ... . 117
4.7.9.4 The environment. ... 119
4.7.9.5 Greenhouse gases... ... 120
4.7.9.6 The cost of hydropower ... ...121
4.10 Power generation technology identification ... 123
4.10.1 Power generation technology selection ... 124
4.10.2 Power generation technology filtration. ... ... . 124
4.11 Selection of some criteria... 125
4.11.1 Some important sub-criteria. ... 126
4.12 Selecting a suitable software for analysis ... 127
4.13 Using Data from Literature. ... 128
4.14 Building the Model using the AHP ... ..131
4.15 Conclusions ... 134
CHAPTER FIVE: HARD TECHNOLOGY SELECTION, RESULTS
AND THE SENSITIVITY ANALYSIS
5.1 Introduction... 1365.2 Results. ... 136
5.3 Introduction to sensitivity analysis. ... 139
5.4 Methods of sensitivity analysis... 139
5.4.1 Nominal range sensitivity... ^ -139
5.4.2 Difference in Log-Odds ratio (ALOR)... 140
5.4.3 Break-Even analysis... ...141
5.4.5 Regression analysis... ....144
5.4.6 Analysis of variance ... 145
5.4.7 Response surface method (R SM )... ...146
5.4.8 Fourier amplitude sensitivity test... 148
5.4.9 Mutual information index ... 149
5.4.10 Scatter plots... ... ... 150
5.5 Sensitivity analysis using AHP... 152
5.5.1 Performance sensitivity ... 152
5.5.2 Dynamic sensitivity... ...152
5.5.3 Gradient sensitivity ... -.153
5.5.4 Two dimensional plot... 153
5.5.5 Weight differences sensitivity ..!... ...153
5.6 Sensitivity Analysis of Power Generation Technology Selection. ... 154
5.7 Conclusions of results and sensitivity analysis... 162
CHAPTER SIX: TECHNOLOGY INDICAORS, SOFT TECHNOLOGY
IDENTIFICATION, AND INTEGRATION OF TECHNOLOGIES FOR
POWER GENERATION
6.1 Introduction... 1666.2 Technology indicators... 166
6.3 Indicators (W hy)... -167
6.4 Indicators used for the following reasons... ... ...167
6.4.1 Monitoring present and past...!... 168
6.4.2 Benchmarking present and future. ... 168
6.4.4 Evaluation present and past ... 169
6.5 Important indicators to S&T ... ...169
6.6 Composition of Indexes... 172
6.6.1.The WEF technology Index... ... 172
6.6.2 The UNDP technology achievement index ... 172
6.6.3 The technological capabilities index (ArCo) ... 173
6.6.4 The industrial development scoreboard (UNDP)... ...173
6.6.5 Science and technology capacity index (STCI) ...174
6.7 Selection of important indicators... -174
6.8 Comments on technology indicators... 181
6.9 Introduction to soft technology... 182
6.10 Characteristics of soft technology... ;185
6.11 Soft science in Japan ... ...188
6.12 Soft technologies for power generation ... 190
6.13 Integration of hard and soft technologies for power generation. ... 193
6.13.1 Hard technologies priorities... ... 194
6.13.2 Soft technologies for power generation. ... ...194
6.13.3 Hard technologies lim itations ... .195
6.13.3.1 Hydropower limitations ... :... .195
6.13.3.2 W ind p ower limitations... 195
6.13.3.3 Solar photovoltaic limitations ... 196
6.13.3.4 Geothermal power limitations... 196
6.13.3.5 Natural gas-fired limitations... 196
6.13.3.6 Nuclear power limitations ... 197
6.13.3.8 Solar thermal technology limitations... 197
6.13.3.9 Coal fired technology limitations ... ... . 197
6.14 Integration of hard and soft technologies... 198
6.14.1 Step one of integration.... ... — ... .198
6.14.2 Step two of the integration process. ... 199
6.15 The proposed conceptual framework ... 200
6.15.1 Implementation of framework...200
6.15.2 Justification of developed framework ...202
6.16 Comments on integration of hard and soft technologies ... 203
CHAPTER SEVEN: THE VALIDATION OF THE MODEL OF POWER
GENERATION TECHNOLOGY
7.0 Validation of systematic approach... 2067.1 Introduction... 206
7.2 Why questionnaire?... 206
. 7.3 Designing of questionnaires. ... 207
7.3.1Types of questionnaires.... ... 207
7.3.2 Instruction in questionnaires ... '... 207
7.3.3 The layout of questions ... 208
7.4 Pilot your questionnaire... 208
7.5 Criteria and sub criteria.. ... 209
7.6 Different hard technologies options... 210
7.7 Questionnaire strategy... ....210
211
212
213
213
.215
218
219
CHAPTER EIGHT: CONCLUSIONS AND RECOMMENDATIONS
8.1 Discussion of research ...
8.2 Contribution to knowledge... .
8.3 Recommendations for further research...
REFERNCES AND BIBLIOGRAPHY
REFERENCES. ... ...
BIBLIOGRAPHY ... ...
APPNDIX ...
.228
236
.239 ,223
224
.226 7.8 The Statistical Analysis of Respondents
7.8.1 Averaging respondents frequency.
7.8.2 Geometric mean of respondents...
7.8.3 The AHP model...
7.9 Results from the AHP... ...
7.9.1 Comparing the criteria using AHP
LIST OF FIGURES
Fig. 3.1 General stages in the research life cycle... 43
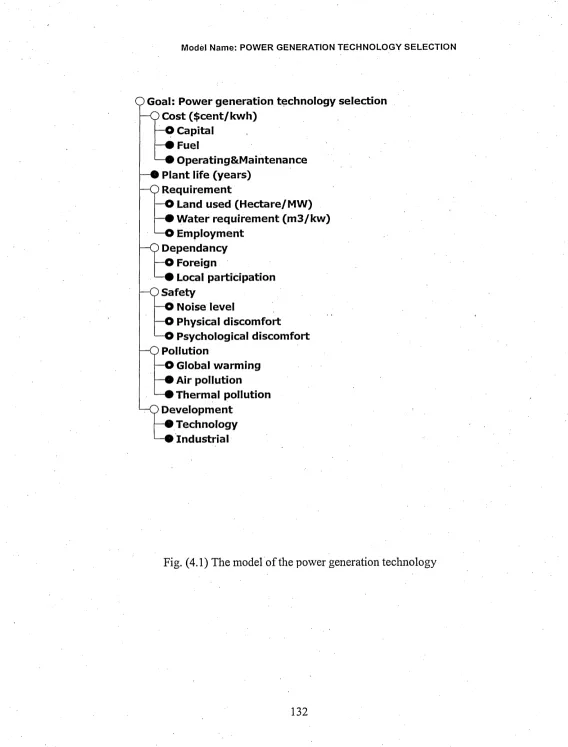
Fig. 4.1 The model of the power generation technology... 132
Fig. 4.2 The Hierarchy diagram of the power generation technology (AHP)... 133
Fig. 6.1 The integration between hard and soft technologies. ...198
Fig 6.2 The proposed framework of power generation technology selection...201
Fig. 7.1 The pair wise comparison between the main criteria and sub criteria (respondents) with respect to the goal. ... 214
[image:17.624.26.572.0.788.2]LIST OF GRAPHS
Graph 5.1 The results of the power generation technologies selection (AHP). 138
Graph 5.2 The priorities of different criteria with respect to power generation
technologies... ... . —155
Graph 5.3 The technology percentage gain with a change in the capital cost...156
Graph 5.4 The technology percentage change with fuel cost varying ... 157
Graph 5.5 The effect of operation and maintenance cost change on technology
percentage gain ... 158
Graph 5.6 The global warming percentage change verses different technologies priority
gain... ... ... ... ... . 15 9
Graph 5.7 The air pollution effect on different technologies priority percentage
gain... 160
Graph 5.8 The thermal pollution change effect on different technologies priority
percentage gain ... ‘... 161
LIST OF TABLES
Table 3.1 Classification of main types of research by Collis and Hussey (2003)... ....37
Table 4.1 World electricity production (TWh, 2000)...:...56
Table 4.2 World electricity generating capacity (GW, 2000)... .. .56
Table 4.3 The atmospheric carbon dioxide concentration ... 62
Table 4.4 The Proved global coal reserves ... 67
Table 4.5 The proved recoverable natural gas resources... ... 70
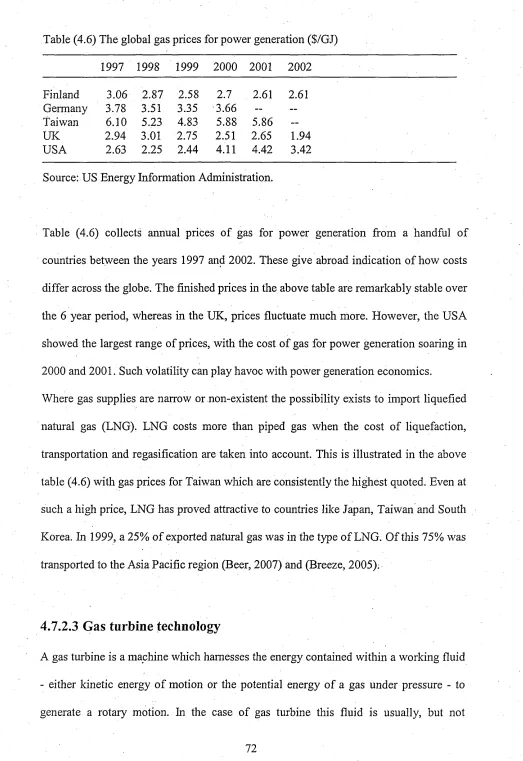
Table 4.6 The Global gas prices for power generation ($/GJ)... 72
Table 4.7 The combined cycle power plant costs... ...76
Table 4.8 The typical large diesel power plant costs ... 81
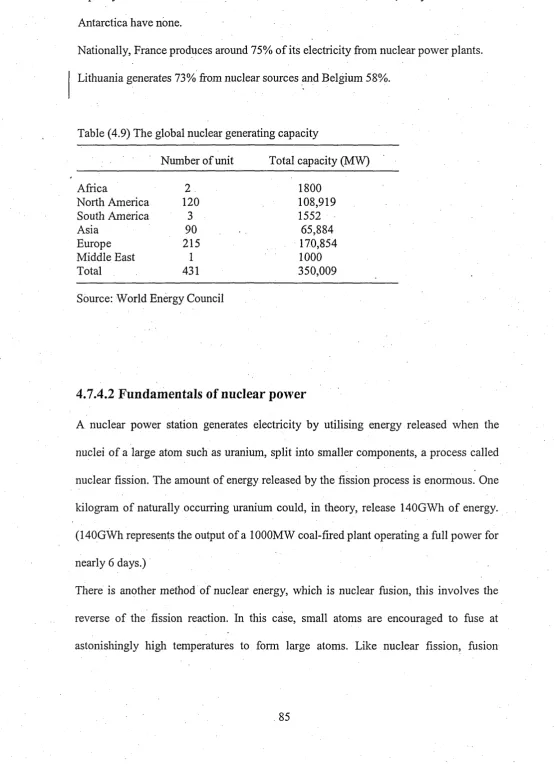
Table 4.9 The Global nuclear generating capacity... 85
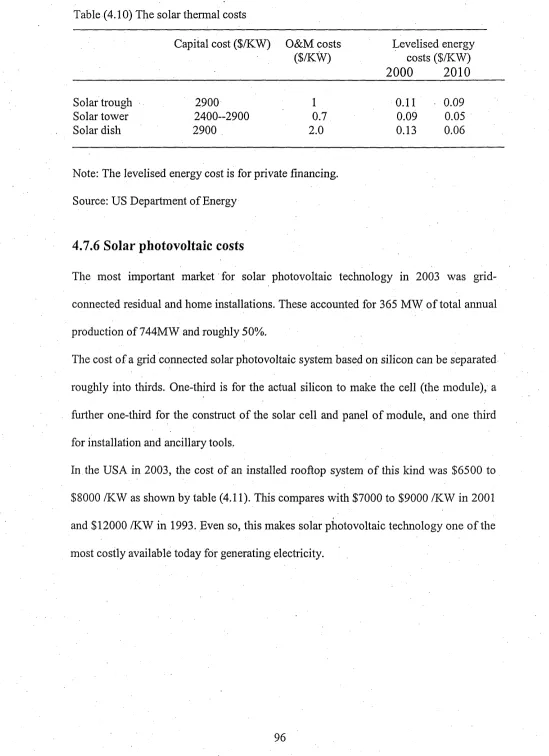
Table 4.10 The solar thermal costs !... 96
Table 4.11 The solar photovoltaic costs ... 97
Table 4.12 The regional wind resources ... 98
Table 4.13 The European wind energy resources ... 99
Table 4.14 The lifetime emissions of carbon dioxide for varies power generation technologies... '...101
Table 4.15 The main geothermal users, worldwide ... 105
Table 4.16 Direct capital costs ($/kW) for geothermal power plants... 111
Table 4.17 The Regional hydropower potential... 114
Table 4.18 The regional installed hydropower capacity... 115
Table 4.19 The typical hydropower project costs ... 122
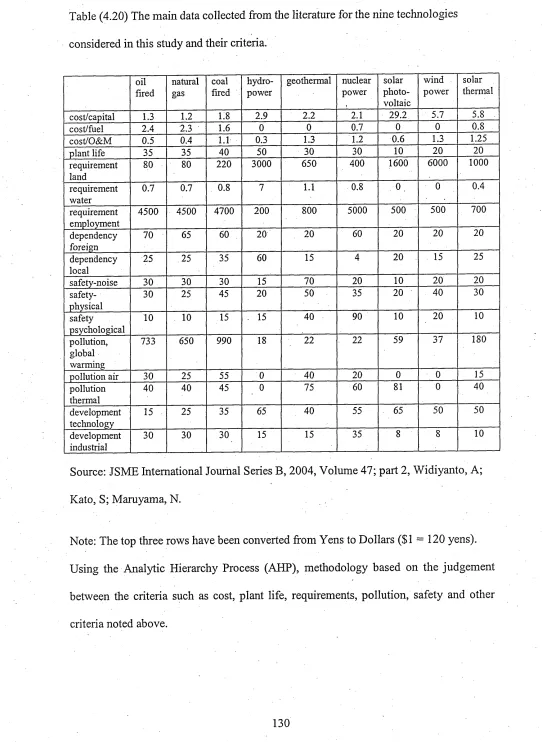
Table 4.20 The main data collected from the literature for the nine technologies considered in this study and their criteria... 130
Table 5.1 The output results of the AHP for hard technology priorities.. ... 137
Table 5.2 The weight of different criteria determining the goal ... 1.54 Table 5.3 The capital cost change and the percentage priority technology g a in ... 156
Table 5.4 The impact of fuel cost on different technology percentage gain ... 157
Table 5.5 The operation and maintenance cost and different technologies percentage gain... ... 158
Table 5.6 The global warming change and the effect on different technology percentage gain ... 159
Table 5.7 The air pollution percentage change and the change in different technologies percentage change ... 160
Table 5.8 The effect of thermal pollution change on the different technology. ... 161
Table 6.1 The important indicators recognised by some international organisation... ... 175
Table 6.2 The International technology leaders and indicators values... 176
Table 6.3 The technology potential leaders indicators values... ... 177
Table 6.4 The technology dynamic adopters countries indicators values... 178
Table 6.5 The technology marginalised countries indicators... 179
Table 6.6 The poor technology countries (others) indicators...180
Table 6.7 The differences between hard technology and soft technology ...184
Table 6.8 The soft technologies matrix... 199
Table 6.9 Knowledge management framework and applications... 202
Table 7 .1 The values of the pair wise criteria respondents (AHP) ... ..215
Table 7.2 The comparison between proposed and observed criteria ...218
CHAPTER ONE
1.1 General introduction
Technology plays a major role in the world development especially in developing
countries. Therefore, management of technology (MOT) is an important and
challenging issue in developing countries. Management o f technology typically
involves integration of different both hard and soft technologies. Some examples of
hard technology include special manufacturing tools, power generation technologies,
machines, instruments and appliances; mainly machine centred. Soft technology on the
other hand is more human-centred. In the main, developed countries appear to have
systematic and integrated approaches to the management of technology (Vilaschi, 2004).
However, developing countries continue to face challenges in embracing and managing
technologies (Li-Hu and Khalil, 2006) and (The unido report, 2001).
1.2 State of technology management in developing countries
According to Hug and Khalil (2004) three countries were under study Nepal, India and
Bangladesh, there is a need for technology policy but have failed in varying degrees,
there was a problem of appropriateness of policy design and the effectiveness of its
implication. In Nepal, there is a lack of indigenous industrial skills and uncoordinated
infrastructure. The lack of consistent government policy coupled with inadequate
information network create a serious constrain on the identification, selection and
technology development. In case of Bangladesh, a serious commitment to technology
promotion has been missing despite the declaration in national plans of the need for
promoting technological capability in the country. India has made some successful
efforts especially in the atomic energy and space sectors. The Indian government has
do not appear to have been effective and consequently fall short of coordinating the
various actors involved in knowledge production and knowledge sharing.
Zhouying (2005) suggested, the economic and technological gap between developed
and developing countries can largely be explained by the gaps in levels of soft
technology and soft environments between the two sets of countries. Shortage of soft
technology experts is the core problem facing the Chinese enterprises. Too few of them
know about commercial techniques and business strategy, including. translating
technologies into commodities that would enable them to coup with the challenges of
competition in global market. In Brazil, there was very little cooperation between
industry and local universities or training neither organisation, nor the enterprises
themselves (Vilaschi, 2004) and (Stacey, 2003).
1.3 Project background and objectives
The above analysis indicates that, there is a lack of considerations of relevant factors
that may affect technology management. In most cases, those factors are addressed in
isolation and there is a need to develop an integrated solution by means of linking hard
technology with soft technology for different industrial organisations at strategic level.
This research work aims to develop a conceptual framework for the management of
technology at strategic level in developing countries.
The objectives of this research work are as follow:
1- Conduct an extensive literature review of the technology management in developing
countries.
2- Establish key indicators of technology state and technology capabilities which can be
used by in policy formulation at national and business levels.
3- Develop a methodology to identify, prioritise and select appropriate hard and soft
technologies.
(4) Develop an integrated conceptual framework based on the outcomes of (2), (3) to
support the management of technology at national level.
(5) Evaluate the conceptual framework using a questionnaire method related to the
proposed model for power generation technology.
1.4 The organization of the thesis
This thesis is structured into eight chapters:
Chapter 2 briefly presents the literature study of the research work in the area of power
generation technologies and management of technology for developing countries.
Chapter 3 explains the research methodologies for both soft and hard technologies for
power generation for developing countries.
Chapter 4 presents the general model of hard technology identification and some
important criteria used to identify the type of hard technology used to generate
electricity. Also in this chapter, it is explained the environmental effects of different
power generation technologies on the environment. Cost of electrical power generation
using different technologies is discussed.
Chapter 5 presents the hard technology selection using the Analytic Hierarchy Process
(AHP) and shows some important outcome and the sensitivity analysis o f the decision
making process for power generation technology prioritise.
Chapter 6 is concerned with technology indicators and the technological capabilities of
some developing countries. This chapter also represents some important accepted
indicators recognised by international organisations such as UNIDO, UNDP, WB, and
indicators help for soft technologies identification related to power generation. Here,
also presents the integration of hard technologies with the soft ones. In chapter six, the
developed conceptual framework is explained and justified.
Chapter 7 describes the validation of the AHP model of the power generation
technologies and how a questionnaire methodology is used to verify the proposed model.
Finally the conclusions and recommendations for the power generation technologies are
presented in Chapter 8.
CHAPTER TWO
LITERATURE REVIEW OF
TECHNOLOGY MANAGEMENT IN
2.1 Introduction
This chapter discusses some of the previous research work related to different
approaches, tools and methodologies of technology management in developing
countries.
The first part is focussing on literature review how to help the decision maker in a
developing country , to decide which technology is most appropriate to generate
electrical power taking into account some important criteria. Also, discusses different
electrical power generation technologies including forms of fossil fuels and renewable
energy methods.
The second part concentrates on the technology management definitions in both forms
of hard and soft technologies.
The third part focuses on research of technology management in power generation
sector.
The fourth part focuses on the factors related to technology management such as
national policies, R&D public and private institutes and their role in the development of
different sectors in developing countries. The building of science and technology (S&T)
infrastructure and its importance to help to left the technological capabilities of a
country.
2.2 Power generation in developing countries
Yildirim and Erkan (2005) studied the growth of population and increasing
consumption of electricity exposed countries to build additional power units. Because of
the technical and economical differences of the energy sources, generation expansion
planning is used to determine the best unit type for the additional capacity.
Costs have always been a very important factor in decision making, in particular for
choices between alternative energy sources and electricity generation technologies.
Eventually, costs, risks, and benefits of energy source need to be analysed comparison
with those of other energy sources and options. Generally, nationally energy policies
aim at implementing systems ensuring diversity and security of supply, including
various primary energy sources and conversion technologies. The assessment of costs in
support of decision making should reflect this policy objective.
The costs of power units consist of two groups: construction cost and operating cost
including fuel and, operating and maintenance (O&M) costs. The construction cost is
independent of the production quantity, whereas the operating cost depends on the
production quantity. The amount of fuel cost changes with fuel type, fuel price and
energy conversion technology. In addition to this, the fluctuating fuel price over time
influences the variable costs considerably. It is obvious that not only the technical
parameters but also the economic parameters affect the determination of the best
additional power units. In electricity generating technologies, are the interest rate,
escalation rate and discount factor. The economic parameters vary between countries,
even between regions, also change with time.
The cost of nuclear unit consists of capital costs, fuel costs, O&M costs, waste related
costs and decommissioning costs. The operating cost, which is a variable cost, includes
the fuel and O&M costs. Fuel cost is associated with mining of the uranium ore,
conversion of uranium, enrichment, conversion to uranium dioxide pellets, loading of
the pellets into rods. O&M cost are associated with costs of labour and overheads,
expandable materials, regulatory, state fees, ongoing capital additions, and property
Like the other type of units, the decision of constructing a nuclear unit depends on the
long-term and least-cost generation expansion planning (GEP). Candidate unit types
compete against each other in the planning. The acceptance of-the nuclear unit is
heavily related to costs of other unit types as related as the cost of nuclear unit itself. In
this study, an acceptable level of the operating cost for nuclear unit is determined by
GEP of Turkey’s power system. In order to realise this aim, operating costs of nuclear
unit is gradually lowered from the level 7.5 cent/kWh to the level of 1.6cent/kWh by
utilising four different scenarios.
Nuclear energy is able to compete with other unit types when the operating cost is 2.4
cent/KWh or laser in the case that it is not permitted natural gas, imported coal, fuel-oil
and hydraulic capacities to exceed the 35% of total capacity in each period. If the
obligatory limits of natural gas, imported coal, fuel-oil and hydraulic are cancelled, it is
not able to compete with other unit types even though the operating cost is decreased to
1.6 cent/kWh or laser.
Consequently, in Turkey’s power system, nuclear energy is able to compete with other
energy sources when the operating cost is less than 2.4cent/kWh. However, this value is
generally low when compared with operating costs of existing nuclear units in OWCD
countries, therefore it is not realistic.
According to Shata and Hanitsch (2006), the study considered the potential of electricity
generation on the east coast of Red Sea in Egypt. Wind characteristics have been
analysed based on long-term measured data of monthly mean wind speed of seven
meteorological stations along the east coast of Red Sea in Egypt. Numerical estimations
using measured wind speeds and frequencies to calculate the two Weibull parameters
were carried out and two methods were applied.
A technical and economic assessment has been made of electricity generation from two
turbines machines having capacity of (1000 and 600 kW) considered in regions A & B,
respectively, using WASP program. The yearly energy output, capacity factor and the
electric energy cost of kWh produced by the two different turbines in each region were
estimated. The production costs of four stations in Region A was found to be less than
2€ cent/kWh and compared with retail tariff.
The contribution of fossil fuels (oil and natural gas) to electrical production in Egypt
accounts for about 79% of total production, while 21% is hydropower. The electricity
demand is expected to grow rapidly to meet the large requirements of future projects.
Studies showed that there was an additional need of annual electricity generation
capacity around lOOOMW/year up to 2017.
Finally, the conclusion in this study is that the expected electricity generation costs of
1 kWh in four locations of region A along the Red Sea in Egypt is less than 2€ cent/kWh,
which is very competitive compared to the actual tariff system in Egypt.
Streimikiene (2004) mentioned that Lithuania has very limited energy sources o f its
own. The main source of electricity production in Lithuania is Ignalina NPP. Over the
last five years, it has generated 80 to 85% of the total electricity production. The
anticipated closure of this nuclear power plant in 2010 will decrease the diversification
of fuel supply and there is no huge potential for renewable energy use in Lithuania.
Only bio-fuel, hydro and wind power can be considered as potential renewable energy
sources in Lithuania.
The share of renewable energy sources in the Lithuanian primary energy supply is the
lowest among the three Baltic States (Estonia, Latvia and Lithuania), though the trends
sets the strategic priorities of Lithuanian energy sector development. One of the main
strategic priorities is striving to achieve a share of renewable energy sources in primary
of energy supply of 12% by 2010. The price o f electricity in Lithuania is about of €
5.8cent/kWh for hydropower power plants HPP’s, € 6.4cent/kWh for wind power plants
and € 5.8cent/kWh for power plants using biomass.
It is suggested by Silveira (2004), the comparative between 1000 MW combined cycle
power plant and 1000 KW diesel power plant and permits some emission and economic
output results. The results for pollutant emissions comparison between them
respectively came out with 200.139 to 424.019 mg/KWh of carbon dioxide C 02 or 1:2
as a percentage. Taking the second pollutant of sulphur oxides S02 came out with 0.00
to 826.45 mg/KWh and the third pollutant of NOx came out with 61.87 to 233.02
mg/KWh of Nitrogen Oxides or 1:3.8 times as a percentage respectively. From these
three gases comparison, the total emission is 195.504 to 262.67 mg/KWh, or 1:1.3 times
respectively. The ecology efficiency (%) is 95.6 to 91.2.
The economic analysis that is the comparison between the electricity production costs
came out with 0.053 to 0.15 US $/KWh or the ratio between costs of combined cycle
and diesel plant is 1:3 or the electricity generated from the natural gas is cheaper three
times than the diesel.
2.3 Technology management definition (hard and soft)
According to Laio (2005), technology management is a process, which includes
planning, directing, control and coordination of the development and implementation of
technological capabilities to shape and accomplish the strategic and operational
using literature review and classification of articles from 1995 to 2003 with the key
word index in order to explore how technology management (TM) methodologies and
applications have developed in this period. This work uses the eight categories of: TM
framework, General and policy research, Information systems, Information and
communication technology, Artificial intelligence/expert systems, Database technology,
Modelling, Statistics methodology, together with their applications for different
research and problem domains. Laio suggested that integration of qualitative and
quantitative method. The qualitative and quantitative methods are different in both
methodology and problem domain. Some articles have presented their TM concepts
without a scientific approach, which leads TM methodology to remain at the stage of
discussion. Also, he suggested the integration of different technologies, and this
integration of technologies and cross-interdisciplinary research may offer more
methodologies to investigate TM problems.
According to Linn and Zhang (2000), current approaches to technology management
express the need to mange technology systematically from both strategic and
operational perspectives. However, considerable ambiguity seems to prevail over the
exact way of managing it. This work presents an object-oriented intelligent management
system for technology management by using the methodology of Intelligent
Engineering. A hierarchical model is proposed to manage the complex and ill-
formulated technology management process. The design and implementation for the
Intelligent Management System for Technology Management (IMS-MS) using the
hierarchical model are described. A meta-system, which serves IMS-TM kernel to
manage and control the operation of the system, is presented. This intelligent
supervision bureau to assist the management of their technology development policy
and project management. The implementation has demonstrated the great potential of
IMS-TM to enhance the automation, intelligence and integration of technology
management.
According to Hipkin (2003), a study described of South African managers’ current
perceptions of managing technology, and what they envisage for the future. The most
significant issues in technology transfer (TT) relate to technology and operations
strategy, where assimilation of technology must yield more and improved products.
Limited financial resources will restrain technological adoption and expansion. A
poorly educated and inadequately trained workforce, characterised by low productivity,
will impose further sever constrains. Knowledge management is in its infancy, and will
require concerted efforts by managers to create appropriate support frameworks before
knowledge can play its rightful role in achieving competitive advantage. Operations and
maintenance staff will be challenged to handle new technology with existing systems
and procedures. Organisations must take the initiative to use suppliers and networks for
a full range of benefits to accrue from new technologies. With South Africa’s history, it
is perhaps not surprising that managers are divided on the role of the government and
politics in business. Those who mistrust political motives seem resigned to accept that
the political agenda will not go away.
The findings in this study suggests areas for further research into technology transfer
(TT) in developing countries DC’s. The high importance scores for maintenance
support Leonard-Barton’s (1995) assertion that maintenance is one of the most
problematic issues in technology management. The results of this study provide a basis
for more detailed investigation of the relationship between the maintenance function
and TT, particularly as skills and knowledge deficiencies in DC’s have a significant
impact on maintenance policies and practice.
The role of technology in strategic decision is still ill defined in South Africa, but global
forces are likely to pressurise managers to introduce new technologies wherever
possible. For the foreseeable future, South Africa will import technology with limited
local technical and operational input. This is to be expected in a developing country
where research and innovation initiatives are limited, and whose economy is still greatly
dependent on technical expertise from abroad.
Li-Hua and Khalil (2006), the workshop report of the US National Research Council
(NRC), “MOT” is the hidden competitive advantage bridging “the knowledge and
practice gap” between science, engineering and business management. MOT as a field
links “engineering, science and management disciplines to plan, develop, implement
technological capabilities to shape and accomplish the strategic and operational
objectives of an organisation”. Enterprises must continue to ensure that the systems
responsible for the generation of knowledge and acquisition of new technologies are
effective. Knowledge generation is always a key-entry point for effectively managing
technology, and must be supported by innovative policy development and an infusion of
research funding in the development of new technology.
According to Zhouying (2004), technology came to being when humans first walked on
two legs and use their two hands as a tool. Then the technology o f making and using
artificial tools gradually developed; and with it came the increasing application of
human body as a tool, followed by labour-saved technology as popularised in
economics. In the recent years, automatic technologies and robotics-based production
become increasingly separated from the 'human body technology', and technological
progress has turned on what is external to human beings - i.e. nature or matter - rather
than what is internal to them - i.e. dimensions of the human mind and spirit.
From the point of view of problem-solving, technology is seen as an extension of
human abilities reflected through the human body, sense, and consciousness, etc.
With improvements in the level of material civilisation, people have come to care more
about the sensate aspects of life, involving sight, sound, taste, smell, and touch; and also
the intangible aspects of life. These aspects of human experience are associated with the
quality of life particularly in the post-industrial societies. Further trends in technological
progress should therefore be driven not merely by the signals of conventional soft-
benefit analysis, but rather by the aim improve living and working conditions and to
respect human moods, feelings, and morals that have significant bearing on the overall
quality of life. These factors relating to the sensate aspects of life are the driving force
behind the recent 'softening' of hard technology and the rise of soft technology through
the inclusion of values and important service innovation alongside technical
considerations in the design of technologies.
It is discussed above the importance of understanding technology in abroad sense,
incorporating the range of intangible and psychological dimensions of human life.
Technology is, strictly speaking, more than the hardware with which we are more
familiar and which has been the focus of most conventional studies. Soft technology
includes commercial technology, social technology, cultural technology and LPFE
technology. In the course of twenty-first century, the advance of globalisation, the
explosion of knowledge, the softening of economy, changes in value systems, the
integration of art and science, and the human mission of sustainable development would
render the traditional understanding of technology obsolete, and call a shift from a
narrowly defined to a broadly defined concept of technology in research and
development. This would involve the synergistic application of both hard and soft
technologies that would help provide a robust basis for sustainable development.
Zhouyiing (2005) indicated and pointed out the economic and technological gap
between developed and developing countries can largely be explained by the gaps in the
levels of soft technology and soft environments between the two sets o f countries.
Shortage of soft-technology experts is the core problem. The problems faced by Chinese
enterprises since the early 1980s, following their conversion to the ideals o f market
economy and their access to the global market, stem from irregularities in the operation
of the soft-technology system and prevalence of unfavourable soft environments
governing the operation of the system. Although China has an abundance of scientific
and technical specialists, too few of them know about commercial techniques and
business strategies, including translating technologies into commodities that would
enable them to coup the challenges of competition in global market. Take for example,
the Zhongguancun Science Park in Beijing, where the correct application of property
rights has created a 'bottleneck' for the development of enterprises in the Park. There are
more that one thousand intermediary organisations engaging in technical consultations
for Zhongguancun enterprises. However, a large proportion of the scientific
achievements cannot find a place where they may be transferred despite the fact that
many enterprises are thirsty for projects and despite the provision of venture capital
looking for 'good projects' every day. A major factor behind this situation is that there is
shortage in the supply of soft-technology . experts capable of tracking long-term market
and technology trends, and understanding market environments (including the law and
market economy, it desperately needed the skills of soft-technology experts. Such skills
cannot, however, be cultivated completely within the purview of the school education
system. Rather they would be expected to evolve through the alternating experiences of
success and failure upon exposure of enterprises to competition the open market.
The lack of competitive methodologies and high-technology products in China and
developing countries, more generally, is primarily a reflection of shortfalls in the supply
of the soft technology and soft environments in these countries. This means that in their
endeavour to be on the path of sustainable development, developing countries should
not seek to simply copy developed countries by adopting whatever the developed
countries have done and are doing. Neither should they place too much emphasis on the
'highness’ and 'newness' of hard technology, nor be limited to the short-term objective of
'striving for temporary superiority and enjoyment of the temporary satisfaction' (as the
old Chinese adage has it). They should rather seek to beat a well-grounded pathway of
development drawing balance between soft technology and hard technology and
recognising the criticality of soft technology and soft environment for the achievement
of competitive performance in an ever-changing global market place.
2.4 Research of technology management in power generation sector
Widiyanto (2004), the set of nine energy alternatives includes conventional and new
energy technologies of oil fired, natural gas fired, coal fired, nuclear power, hydropower,
geothermal, solar photovoltaic, wind power and solar thermal plants. Also a set of
criteria for optimized selection includes five areas of concern; energy economy, energy
security, environmental protection, socio-economic development and technological
aspects for electrical power generation.
However as the complexity of the problem increase due to the inclusion o f objectives,
the extension of model brings about more complexity in mathematical formulation, and
creates a tedious computational process, which tends to reduce analysis efficiency.
An exception to the situation is the model that based on matrix operation, such as the
Analytic Hierarchy Process (AHP), that has been proven to be practicable for solving
complicated and elusive problem in many decision areas. However, this model was
applied in far more problems which involved qualitative elements, as opposed to
quantitative, that play an essential role in the decision problem. There was a need to
develop a relatively simple mathematical formulation method for solving complicated
and elusive multi attribute decision problem, as in the AHP.
The method should be able to take any number of decision variables, without reducing
its computational efficiency. The DBA (Distance Based Approach) method proposed in
their work was one such attempt to accomplish these requirements. In the work there
were twenty three attributes drawn from the set criteria of the five areas of concerns.
The result of the model application using data related to power expansion in Japan
demonstrated that, once a complete set of criteria for energy system selection, along
with a set of alternatives and their levels of attribute are laid out, an effective
justification process around multi attribute decision model DBA can be performed, not
just a general analysis, but also other various focused analysis regarding his or her
personnel preferences. Literally, the decision maker has unlimited, choices in exploring
the influences of different sets of attributes to the final decision.
As the result of the analysis, it came out with the natural gas option has the best
numerical score followed by nuclear, oil fired, hydropower, coal fired, wind power,
solar thermal , geothermal, and solar PV. The findings validate the effectiveness of the
straight-forward matrix operation, it is capable of solving complex of multi-attribute
decision problems, incorporating both quantitative and qualitative factors. The
usefulness of this model, however, can only be ascertained through extensive field
testing, followed by further refinements.
According to Kitz and Glaspey (2005), the moderate temperature (140 to 146°C)
geothermal field at Raft River in the state of Idaho, United States was extensively
explored and drilled during the 1970s. Total depths of the production wells, which are
mainly vertical, are 1520 to 1980m. By the early 1980s, production and injection wells
had been tested many times and an experimental 5MW binary power plant was installed
and in operated briefly to demonstrate the feasibility of power generation at Raft River.
But the project was abandoned because of two major technological barriers at that time
to commercial power production from this resource. The well was too cool to allow
self-flowing for routine production, but down hole geothermal pump technology had not
become routine by the early 1980s. The second, the resource was too cool for cycle
power plants, which were the only plants commercially available at that time. Therefore,
an experimental binary cycle demonstration power plant was used at Raft River, with
disappointing results.
Fortunately, both down holes pump technology and binary power generation are no
longer technological barriers; and are routinely used today in commercial power
projects. The field is now being developed for commercial power generations.
Even with a conservative set of assumptions it could be concluded that it should be
possible to supply a 10MW (net) power plant at Raft River using binary-cycle power
conversion and down hole submersible pumps if only 3 of the existing production wells
can be restored to their full productivity by working them over. If all 5 wells can be
made fully productive, it should be possible to supply a 17MW (net) power plant by
either deepening the pump setting with time, or drilling up to 3 make-up wells over a
20-year project life, or a combination of these options. In this case, one to three new
injection wells will need to be drilled.
A 30 MW (net) plant capacity is likely to be supportable by 9 to 10 production wells
and 7 to 9 injection wells, including the existing wells refurbished for production or
injection.
Wong (2006) studied and updates the Pembina Institute’s 2001 publication. A
Comparison of Combustion Technologies for Electricity Generation, republished in
2004 in power for the future: towards a sustainable electricity system in Ontario.
The electricity generation technologies examined included the following:
- High efficiency coal combustion technologies: Pulverised Coal Combustion
(PCC), Atmospheric Fluidised Bed Combustion (AFBC), Pressurised Fluidised
Bed Combustion (PFBC) and Integration Gasification Combined Cycle (IGCC).
- “End-of-Pipe” or add-on pollution control options for coal such as Flue Gas
Desulphurisation (FGD), Low NOx Bums (LNB), Selective Catalytic or Non-
Catalytic Reduction (SCR/SNCR), Electrostatic Precipitators (ESP) and Bag
houses.
- Natural Gas-fired options: Natural Gas Combined cycle (NGCC) and Combined
Heat and Power.
The review concluded that none of the coal-fired options are as environmentally
favourable as the natural gas-fired options. Among the coal-fired options, IGCC showed
the best opportunity for environmental performance, although it still has high C02
The review also noted that IGCC technologies may theoretically be combined with
carbon capture and storage (CCS) technologies. However, the review concludes that
carbon storage options for Ontario are unproven and speculative, and that, given the
extent of the research required demonstrating their viability, they can not be considered
a series possibility within the current 20-year electricity policy planning horizon.
The plant efficiency (%) for the different Coal combustion (PCC) is about 33% but the
Natural Gas Combined Heat and Power is around 52 to 60 %.
The overall cost to produce Electricity ($/MWh) is about 42.45 and 48.54 for the Coal
combustion (AFBC) and Natural Gas Combined Cycle (NGCC) respectively.
The emissions of C02 (kg/MWh) is about 1000 and 350 for the Coal Combustion (PCC)
and the Natural Gas Combined Heat and Power Cycle (NGCHP) respectively.
According to Kannan & Osman (2005), Life cost assessment (LCA) and Life cycle cost
analyses (LCCA) models were developed and the life cycle energy, emissions and cost
inventory was established for potential power generation technologies in Singapore.
Power generation from clean/renewable power generation technologies are costlier than
fossil fuel based power generation. However, their low environmental impacts can
compensate for unfavourable economics if environmental externalities become an
accepted paradigm in appraisal. Unfortunately, a reliable externality cost estimates is
not yet established and path to assessing externalities is still fraught with difficulties and
uncertainties.
Considering limited potential for renewable energy sources in Singapore, power
demand can be reduced through energy efficiency measures instead of catering to
increasing power demand. Energy efficiency will be effective regardless of the future
power supply scenario. However, it is not easy task as there are many barriers to
implementing energy-efficient technologies. Making changes in traditional economic
evaluation are important to the adoption of energy-efficient technologies on the demand
side. If the costs of energy efficiency measures are compared with clean/renewable
based power generation technologies instead of market electricity price, some transition
barriers can be overcome.
Therefore, implementing policies with a mix of financial incentives and disincentives
and direct investment in energy efficient technology would be an effective strategy for.
Singapore. Consumer education and supportive political/regulatory environment are
vital in this context.
Fetescu (2003) suggested the usage of gas turbine technology and cycle selection have a
major impact on the economic performance of combined cycle power plants projects.
The main objective of this paper is to investigate decision criteria and their relative
importance in the selection of gas turbine technology and cycle configuration. The
levelised cost of electricity (LevCoe) is a simplified tool for comparing power
generation technologies using the cost of generation criteria based on PV (present value)
models for capital, fuel and O&M costs. Using input data as defined, it provides the
total LevCoe and the contribution split: capital, O&M and fuel costs.
LevCoe allows comparison and ranking of alternative generation technologies. LevCoe
is not size dependent and allows comparison of different technologies without imposing
the same capacity.
Graus (2007) mentioned the international comparisons of energy efficiency can provide
other countries. The results can be used to determine potential energy savings and
greenhouse gas emission reduction potentials.
Energy-efficiency analyses for power generation on a country level have been
performed in the past, but few recent studies are available. Furthermore benchmarks for
overall fossil-fired power generation are not available.
The analysis aimed to make a comparison of the efficiency of fossil-fired power
generation (coal, oil and natural gas). For this purpose, specific benchmark indicators
are developed for natural gas, oil and coal-fired generations efficiencies. These
indicators are aggregated to a benchmark for fossil-fired generation efficiencies.
The countries evaluated in this study were Australia, China, France, Germany, India,
Japan, Nordic countries (Denmark, Finland, Sweden and Norway aggregated), South
Korea, United Kingdom and Ireland, and United States. Together these countries
generate 65% of world wide fossil power generation.
The results of the study showed that the efficiency trend for coal, gas and oil-fired
power production, respectively, for the period 1990—2003.
The energy efficiencies for coal-fired power generation range from 30% for India to
42% for Japan in 2003 . The average efficiency of the countries is 37% and the weighted
average efficiency is 35% in 2003.
For gas-fired power generation, the efficiencies range from 39% for Australia to 52% in
2003. The average efficiency for gas was 46% and the weight average was 45% in 2003.
For oil-fired power generation, the efficiencies range from 30% for India to 45% for
Japan in 2003. The average efficiency for oil was 37% and the weighted average
efficiency is 38% in 2003.
For overall fossil-fired generation, the efficiencies range from 32% for India to 43% for
United Kingdom and Ireland and Japan in 2003.
According to Breeze (2005), at the beginning of the twenty-first century, the new power
plant offering the cheapest source of electricity appears to be the gas-fired combined
cycle power station. It is cheap and quick to build and relatively easy to maintain. The
fuel is the most significant determinant of electricity price, so while gas is cheap, so is
electricity. There are some other factors such as the effect o f power production on the
environment and on human health, factors which society pays for but not the electricity
producer or consumer directly. These factors are called externalities.
A major study carried out by the European Union (EU) and the USA over a decade in
the 1990s estimated that the cost of these externalities, excluding the cost of global
warming, were equivalent to 1-2% of the EU Gross Domestic Product.
The cost of electricity in the EU in 2001, when the report of the study was published,
was around €0.04/kWh. These figures indicate that coal combustion costs at least.
The economics of the gas turbine plant are complex. Even so, many planners assume
that is currently the cheapest cost option, quoting a generation cost of around
$0.03/kWh. This figure depends on a number of assumptions, particularly discount rate
over the life time of the plant.
A recent challenge to conventional thinking put the generating cC>st in the range $0.05-
$0.07/kWh. That would make some renewable sources cheaper. Even so, there was no
evidence yet for a waning in the popularity of the gas turbine for power generation.
Power production cost from first generation the Proton-Exchange Membrane (PEM)
fuel cell systems of $0.10/kWh had been suggested.
The cost of electricity from a hydropower plant will depend on the cost of building and
financing the project and on the amount of electricity it generates when operating. For
initial generating costs have been in the range $0.04-0.08/kWh. However once the loan
has been repaid the costs drop dramatically. The typical range of generation costs is
$0.01— 0.04/kWh but may easily fall below $0.01/kWh. This is cheaper than any other
source of electricity.
The cost of tidal power generation would be a $0.41/kWh. In this case the plant was
intended to replace power generated using diesel engines, which is an expensive source.
However, even with a renewable energy credit, the project was judged too expensive.
When electrical power generation from wind power is to be considered, the energy cost
depends on the amount of wind available at a particular site. Generating costs, operating
costs and some external costs will determine the total cost of electricity generated by the
wind power.
Taking these factors into account, favourable estimates suggest that at the beginning of
the twenty-first century modem onshore wind farms could generate electricity for
€0.03/kWh at a wind speed of 10 m/s and €0.08/kWh at a wind speed of 5 m/s. Early
commercial offshore wind farms generate power for between €0.05/kWh and
€0.0 8/kWh.
In common with many renewable resources, geothermal power generation involves a
high initial outlay but externally low fuel costs.
Some figures from the World Bank show that for the costs of development of
geothermal projects for different qualities of geothermal resources, a good resource has
a temperature above 250° C, and good permeability so providing good fluid flow. The
World Bank estimates suggest that power can be produces from a large geothermal
power plant (>30MW) exploring a good quality resources at between $0,025 and
$0.050/kWh.
Solar thermal and solar photovoltaic power plants share a number of features such as
short deployment times and additional benefits from dispersed deployment that affect
the cost and value of both technologies. However the technologies themselves have
different roots and the costs associated with them have to be considered separately.
The cost of solar thermal power to generate electricity at around $0.11— 0.12/kWh but
for solar photovoltaic power generation, electricity probably costs around $0.25/kWh.
This can be competitive with the peak power costs in somewhere like California but is
way above the cost of base-load power, $0.025— 0.050/kWh.
2.5 Factors effecting technology management (R&D, S&T, Policies,
TNC, FDI, Innovation systems)
According to (Huq, 2004), the study included three countries (India, Nepal and
Bangladesh), it indicates that the challenges facing technology policy in low-income
developing countries. The three countries see the need for technology policy, but have
failed, albeit in varying degrees, to establish an effective policy regime that would pave
the way for sustainable development. However, the benefits of technology policy derive
not merely from the statement of its need in plan and policy documents, as is apparent
from the experiences of many developing countries, but rather from the appropriateness
of policy design and the effectiveness of its implication.
The main points that emerge from the analysis of the state of technology development
in Nepal, are the lack of indigenous industrial skills and inadequate, and uncoordinated
infrastructure. The lack of consistent government policy coupled with inadequate
information networks also created a serious constraint on the identification, selection
is that a conscious policy effort would be needed to improve the infrastructures that
would enable the development of indigenous technological capability on the back of
technologies transferred from elsewhere.
The significance of infrastructure provision for science and technology (S&T)
development is illustrated by the experiences of India's successful industries in the
atomic energy and space sectors. The difference between India's successful and lagging
industries is that the successful ones, unlike the laggards, exhibit clarity o f mandate of
their goals and 'sustenance of their functions over a long period of time along with
integration of R&D generation and its use. The Indian government has devised various
initiatives to promote technological capability building. However, these efforts do not
appear to have been effective because they represent a bureaucratic solution to the
problem and consequently fall short of coordinating the various 'actors' involved in
knowledge production and knowledge sharing.
In the case of Bangladesh, a serious commitment to technology promotion has been
missing despite the declaration in the national plans of the need for promoting
technological capability in the country. Where Bangladesh has failed miserably with
respect to technological capability building is in the implementation of policy. But as in
the two other countries considered in this study, technology policy in Bangladesh will
also need to evolve within the broad framework of a national innovation system.
The experiences of developing countries show not only market failure when it comes to
the task of building technological capability, but also government failure in providing
relevant policies. This is apparent from the three cases discussed above. In exploring the
way forward, developing countries are faced with the challenge of promoting the
involvement of the private sector in R&D activities, while recognising the role of
governments in coordinating the direction of research.
The experience of South Korea is particularly instructive in this respect. While the
government has helped in building the training and skill base and in providing some
useful S&T institutions, R&D development in the private sector has been actively
promoted. The government o f South Korea took the responsibility of promoting
indigenous technological development by establishing the necessary S&D infrastructure,
providing funds of R&D and at the same time strongly encouraging private firms to
undertake R&D activities. Thus state participation is needed to correct shortfalls in the
supply of investment funds for R&D activities; it does not follow that the state will
necessarily have to engage itself in the operation and management o f R&D projects. It
is however essential that the S&T infrastructure is significantly strengthen by
coordinating activities of the existing institutions and also by adding, as required, some
new ones. This is the process in which the national system of innovation would be
expected to evolve as a basis for capacity building and technological capability
development in developing countries.
Technological policy that is destined to promote enterprise culture, R&D and
innovation initiatives will ultimately enable developing countries to produce global
competitive players in various areas of economic activity. On the other hand the failure
of policy to address local problems in the context of development in the wider global
economy will see low-income countries locked in to the vicious circle of poverty. It is
in this light that the opportunities and threats of globalisation facing developing
countries and the case of the technology policy and the role of the state in these
countries- will need to be considered.
Villaschi (2004) mentioned that throughout the 1990's, Brazil followed economic
policies enshrined in the virtues of market mechanism and considered by international
This followed a period when the government played a crucial role in the industrial and
leapfrogging of economy through the implementation of industrial and technological
policies. The work had examined results of the shift from a strategy of economic
development based on the role of the state to a strategy based on the role of the market.
The evidence of improvement in industrial capabilities was particularly apparent in the
performance of firms that faced foreign competition in the internal market.
However, there has been a little or no improvement in innovation capabilities. In most
of the arrangements examined, product development occurred through imitation of
international and local industries' leaders, and process improvements, through the
acquisition of the new machinery. There was very little cooperation between industry
and local universities or training organisations; nor between the entrepreneurs
themselves. If a country were to embark on 'path cr