axial glacier flow
SWIFT, Darrel A. <http://orcid.org/0000-0001-5320-5104> and JONES,
Andrew
Available from Sheffield Hallam University Research Archive (SHURA) at:
http://shura.shu.ac.uk/21428/
This document is the author deposited version. You are advised to consult the publisher's version if you wish to cite from it.
Published version
SWIFT, Darrel A. and JONES, Andrew (2018). Going against the flow: testing the hypothesis of pulsed axial glacier flow. Earth Surface Processes and Landforms, 43 (13), 2754-2761.
Copyright and re-use policy
See http://shura.shu.ac.uk/information.html
This article has been accepted for publication and undergone full peer review but has not been through the copyediting, typesetting, pagination and proofreading process which may lead to differences between this version and the Version of Record. Please cite this article as
Going against the flow: testing the
hypothesis of pulsed axial glacier flow
Darrel A. Swift
1,*and Andrew H. Jones
1,21
Department of Geography, University of Sheffield, Winter Street, Sheffield, S10 2TN, UK
2 Department of the Natural and Built Environment Sheffield Hallam University Sheffield UK
* Corresponding author.
Email: [email protected] (Darrel Swift); Telephone: +44 (0) 114 222 7959
Abstract
Hypothesised lobe-like flow of a temperate glacier in southeast Iceland, proposed from an
analysis of ice surface crevassing patterns, is appraised from both empirical and theoretical
perspectives. The hypothesis comprises the migration of individual lobes (or ‘pulses’) of ice
through the glacier body, with central lobes migrating more rapidly along a narrow, central, ‘axial
flow corridor’. Our alternative hypothesis is that crevasse patterns at this glacier instead reflect
simple surface ice responses to stresses caused by flow over uneven bed topography. To
substantiate our rejection of the lobe-like, pulsed axial flow hypothesis, we provide: (a) evidence
for a prominent transverse foliation that exhibits no evidence of shear of the required magnitude
to support the hypothesis; and (b) an analysis of ice surface displacement, obtained by feature
tracking, that shows a uniform flow field throughout the glacier tongue. We argue that caution
needs to be exercised when interpreting glacier flow solely from crevasse patterns and
Keywords: Glaciology, glacier flow, crevasses, foliation, thrusting, Iceland.
Introduction
Phillips et al. (2017) propose that fracture (i.e. crevasse) patterns at Kvíárjökull (Fig. 1), a
temperate glacier in southeast Iceland, indicate that flow since c. 1940 has proceeded as a series
of independently moving lobes or ‘pulses’ of ice (Fig. 1d) originating in the upper glacier tongue.
These authors have used ‘marked changes’ in crevasse patterns to divide the glacier surface into
27 domains, which are claimed to be individual pulses of ice separated by shear zones. Perceived
‘cross-cutting’ relationships between domains, and the elongate nature of the central domains, is
inferred to show that lobes within a narrow central corridor (or axis) ‘bypass’ packages of
slow-flowing or stationary marginal ice (Fig. 1(b)). The conclusion – that flow can occur in discrete
lobes that migrate independently through the glacier body – profoundly contradicts widely
demonstrated patterns of glacier flow (e.g. Hooke, 1998; Cuffey and Patterson, 2010).
The work presented by Philips et al. (2017) sets a new standard for glacier fracture mapping. In
addition, it is essential for the development of glaciological theory that, as in all fields of science,
new methods are trialled that seek to challenge received wisdom. It is also essential that all new
theories and methods are subject to rigorous testing, and that those found wanting are dismissed,
or highlighted as deserving of further work. We set out to test the pulsed axial flow hypothesis of
Phillips et al. (2017) because crevasse patterns are more commonly interpreted to reflect local
tensile stresses caused by undulations at the glacier bed (see Discussion). In addition, Swift et al.
(2006) have previously documented the presence of a glacier-wide, transverse, ogive-origin
foliation at Kvíárjökull. This foliation is largely overlooked by Phillips et al. (2017), yet could
provide strong supporting evidence for their theory if it can be shown that independently
Study Area and Methods
Kvíárjökull (Fig. 1(a)) is a valley glacier fed by the Oræfajökull icecap via a steep icefall located
c. 6 km from the glacier terminus. For this study, horizontal displacement of ice in the icefall and
tongue was obtained by analysis of high-resolution (3 m) PlanetScope imagery (Planet Team
2017) using a normalised cross correlation algorithm that tracks movement of surface features
(Kääb and Vollmer, 2000; Heid and Kääb, 2012). A limited structural survey (restricted to
mapping open crevasse areas and notable examples of transverse foliation) was undertaken from
an aerial photograph acquired in 2009 (shown in Fig. 1(b) and (c)), and mapped features were
observed in the field in August 2007 and 2012. Band-ogives (e.g. Goodsell et al. 2002) are clearly
visible in aerial and satellite images from the 1940s onwards (e.g. Phillips et al. 2017 and Fig.
1(a)), and thrusting along ogive-origin foliae has previously been observed in ice approaching the
glacier terminus (Swift et al. 2006). These thrusts were argued by Swift et al. (2006) to originate
from reactivation of shear along dark-ogive bands that contain a higher density of foliae
(Goodsell et al. 2002) by a change in deviatoric stress that occurs as ice nears the adverse slope of
the terminal overdeepening.
Phillips et al. (2017) describe the mapped domains (Fig. 1(b)) as a series of radially crevassed,
teardrop-shaped regions of ice centred around ice-surface topographic highs, and interpret these
to be a chronosequence of discrete lobes of ice produced in the upper tongue. The central lobes
are more elongate and said to ‘clearly cross-cut and truncate the relatively earlier developed
teardrop-shaped [i.e. less elongate] lobes at the ice margins’ (p. 14). Particular attention is given
to Domain 27, a marginal domain (Fig. 1(b)) that displays a rounded ‘teardrop’ shape and radial
crevasse pattern. This domain is immediately upglacier of Domain 1 (Fig. 1(b)), which has
relatively low relief and an absence of surface crevassing. Small displacements on steeply
dipping, closed fractures in Domain 27 lead Phillips et al. (2017) to conclude that Domain 27 is a
centimetres) along crevasses are also used to conclude that a longitudinal crevasse zone adjacent
to Domain 1 is a ‘dextral shear zone’ (see Fig. 1(b)), marking a deflection of the active ice flow
corridor to the true-left (i.e. to the northern part of the frontal margin).
Results
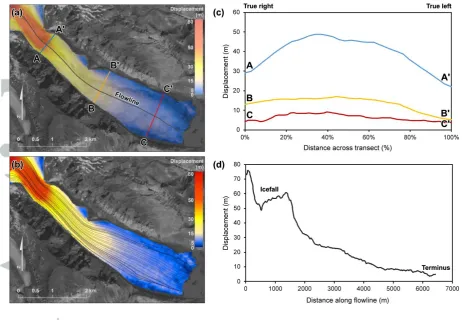
Measured displacement of glacier ice (Fig. 2) is highest along a broad central zone, with
maximum displacements occurring in the steep topography of the icefall, and decreases towards
the glacier tongue and margins. Displacements therefore demonstrate a broadly uniform flow
field that is characterised by ‘plug-flow’ across c. 60% of the glacier width (Fig. 2(c)), with the
majority of shear being restricted to ice at the lateral margins. Rapid changes in displacement that
are perpendicular to flow, which might indicate longitudinal shear, are not apparent (Fig. 2(c)),
meaning no discrete central (or ‘axial’ flow) corridor is observed. Mapped flowlines (Fig. 2(b))
indicate that flow near the terminus bends slightly to the true-right (i.e. the southern region of the
terminus), and do not show evidence of dextral shear. Rather, the northern region appears almost
to be stagnant (see Discussion). A small area (10s of m wide) of low displacement near the
terminus (Fig. 2(a)) possibly reflects localised mass loss caused by subglacial water flow, or
resistance provided by a subglacial landform, such as an esker deposit. Debris-covered ice at the
extreme lateral margins near the terminus Fig. 2(a) also exhibits low displacements.
Two prominent ice structures visible from aerial and satellite imagery and in the field are present
along the length of the glacier tongue. The first is an arcuate transverse englacial foliation that
originates from band-ogive foliation, which first appears below the icefall (Fig. 1(a)). The second
is a medial moraine that originates from a bedrock outcrop within the icefall (Fig. 1(a)) and
extends to the terminus. Band-ogive foliation continues to be visible along the tongue and is
traceable across the glacier width (Fig. 1, 3). Incorporation of debris into foliae associated with
of the medial moraine structure and lateral edges of the glacier (Fig. 1(c)). Bands become less
clear in the lower tongue and terminus, but many distinct, occasionally debris-rich ogive-parallel
foliae remain (Fig. 3). The reduced visibility of ogive bands in the lower tongue may be due to
surface ablation, which diffuses sediment across the glacier surface, and removes upper layers of
ice containing snow-filled crevasses that contribute to the lighter appearance of the ‘winter’ bands
(Swift, 2015).
Both medial moraine and transverse, ogive-origin structures originate upglacier of the area
identified by Phillips et al. (2017) as being a possible source of the lobes. Phillips et al. (2017)
observed minor displacements of ogive-related banding along surface fractures, but only on the
order of 10s of centimetres. Substantial offset of such features was not observed in the field and is
not evident from aerial imagery, even where such features intersect the boundaries of domains
identified by Philips et al. (2017) as independently moving lobes (Fig. 3). The more debris-rich
features appear to reflect the emergence of marginal and basal sediment, the latter identified by
the presence of faceted and striated clasts (Benn, 2004), that has been incorporated into
band-ogive foliae by folding and thrusting (Fig. 1(c)), as observed in 2002 by Swift et al. (2006). A
notably large thrust observed in 2002 was again observed in 2007, when it could be traced from
the southern glacier margin (Fig. 4b and c) to its meeting point with the medial moraine, whilst a
series of emergent thrust moraines were observed behind (Fig. 4a). A large englacial esker (Fig.
5) that has emerged since c. 2010 (see also Phillips et al. 2017) does demonstrate an offset
morphology, but, rather than shearing, this appears to indicate shortening (giving rise to a
Discussion
Crevasse patterns and glacier flow
Crevasses are tensional fractures that form at 90 degrees to the direction of maximum tension
(Nye, 1952; Hambrey and Müller, 1978; Huddleston, 2015). They are typically a shallow surface
phenomenon because the confining pressure imposed by surrounding ice sets a maximum depth
limit that in temperate ice is about 25 to 30 m (Nye, 1957; Hambrey and Müller, 1978).
(Water-filled crevasses can exceed this, but do not occur on Kvíárjökull). Crevasses form relatively
quickly under a specific local stress regime, and may close similarly rapidly as flow transports
them into a new stress regime. The minimum extensional strain required for crevasse formation
varies greatly, meaning the absence of crevassing does not necessarily indicate slow or stagnant
flow (Hambrey and Müller, 1978; Cuffey and Patterson, 2010). Closed fractures are sometimes
observed deep within the interior of glaciers but the origin of these is debated, and most
documented examples are transverse features originating in areas of very rapidly extending ice
flow, such as icefalls (e.g. Hambrey and Müller, 1978; Goodsell et al. 2002).
Their relatively shallow depth means crevasses have limited significance for glacier flow
(Huddleston, 2015). Instead, horizontal stress coupling in ice below the depth limit for crevassing
transmits internal forces over distances of several ice thicknesses, meaning glacier flow proceeds
in the manner of a stiff fluid in which flow is dictated by the creep properties of ice. This
precludes sharp longitudinal velocity gradients, and causes the drag exerted by bedrock at the
glacier sides to restrain the flow at the glacier centre. Rapid shear is concentrated in thinner ice
near the lateral margins and almost absent in thick ice near the glacier centre, as shown by field
measurements of longitudinal velocity (Fig. 6) (Raymond, 1971). This general pattern is
reinforced by patterns of basal water pressure that promote high rates of basal slip beneath thick
to 90%) of ice surface velocity across more than half the width of the glacier (Cuffey and
Paterson, 2010). Flow within this central region is therefore nearly uniform (i.e. ‘plug flow’).
Longitudinal flow of ice in discrete, fast-moving, corridors or streams (but not ‘lobes’) is known
to occur only in ice sheet systems. Such systems are sufficiently large to accommodate ‘shear
margins’ of 5 to 10 km wide (e.g. Joughin et al. 2004) that separate fast moving ice-stream ice
from adjacent, slow moving ice. Similar longitudinal separation of flow within outlet and valley
glacier systems, such as would be needed to produce a central corridor of fast-moving ice, lacks
precedent or physical plausibility. Distinct flow units are commonly observed in compound
glacier tongues formed by the confluence of ice from two or more tributaries or accumulation
basins, the boundaries between which may show considerable shear arising from longitudinal and
vertical extension necessary to accommodate adjustment of unit width according to flux
differences from the input basins (Jennings et al. 2014). However, there is no evidence that
longitudinal shear at unit boundaries enables input flux differences to be accommodated by
independent flow of adjacent units. Rather, as in all glaciers, flow in the tongue proceeds ‘en
masse’.
Complex crevasse patterns may occur as a result of the uneven character of glacial valleys and
beds (e.g. Hambrey and Lawson, 2000; Cuffey and Patterson, 2010; Huddleston, 2015). Notably,
longitudinal undulations in glacier beds give rise to alternating regions of transverse and
longitudinal crevassing arising from longitudinal flow extension on areas of steeper bed and
transverse extension due to flow compression on areas of less steep or negative bed slope,
respectively (Nye 1952). Thus, short wavelength bed undulations will cause crevasse formation
under rapidly alternating stress regimes, and therefore to contrasting crevasse patterns being
‘overprinted’. Further, longitudinal and radial (or splaying) patterns are common at glacier
2005), or where ice flows past a valley constriction or promontory, or where it negotiates
subglacial ridges or hills (Cuffey and Paterson, 2010).
Interpretation of flow at Kvíárjökull
Phillips et al. (2017) reject simple dynamic reasons for crevasse formation at Kvíárjökull and
favour explanations based on ice flow history (see Field Site and Methods). Minor observed
displacements on faults and fractures are used to support the hypothesis of independently
migrating lobes, and to support the existence of a dextral shear zone in the main axial flow
corridor on approaching the terminus. Longitudinal shear fractures are, however, rare in glaciers
(Hudleston, 2015) and observed displacements on such features are typically very modest (up to 1
m, e.g. Hambrey, 1994). The majority of such features appear to be formerly open crevasses and
do not indicate displacements on faults of any great depth (Cuffey and Patterson, 2010;
Hudleston, 2015). Considerable strike-slip displacements are typically observed only on
transverse, upglacier-dipping planes (i.e. thrusts) in situations where variations in deviatoric
stresses are imposed by changes in bed gradient or thermal regime (e.g. Hambrey and Müller,
1978) (see below). Except in unusual cases (e.g. Hambrey et al. 2005), thrusting appears to
require pre-existing, glacier-wide, weaknesses in the body of the ice that have the correct
orientation (Moore et al. 2010, 2011; Huddleston, 2015), such as ogive-origin foliae (e.g. Swift et
al. 2006).
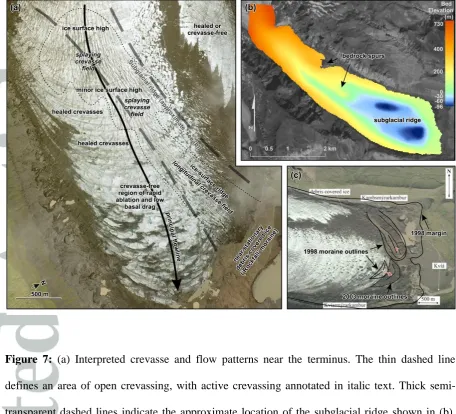
A simpler interpretation of flow at Kvíárjökull is that lobe-like highs and crevasse patterns reflect
flow over uneven subglacial topography. Importantly, a series of highs and ridges in the bed of
Kvíárjökull are shown in bed data (Fig. 7(b)) published by Magnússon et al. (2012), which has
been derived from point radio-echo soundings of ice thickness. The valley constrictions noted by
Phillips et al. (2017) also likely play a role, but only in the immediate vicinity of those features.
In the terminal area that includes Domains 27 and 1, rather than a discrete lobe centred on one
deflection by possibly several subglacial highs (Fig. 7(a)), before flow continues into Domain 1
where these crevasses close. These highs correlate with the upglacier termination of a diagonally
oriented subglacial ridge mapped by Magnússon et al. (2012) (Fig. 7 (b)). The change in
longitudinal crevasse orientation north of Domain 1, as ice approaches the terminus, reflects
quasi-transverse extension of ice that overrides the ridge (Fig. 7 (a) and (b)). Displacement in this
region (Fig. 2) indicates broadly uniform flow similar to that of other glaciers (e.g. Fig. 6) and
does not provide evidence of longitudinal shear or lobe-like flow.
Displacement measurements (Fig. 2 (b)) also show that the central flowline of ice in the glacier
tongue is not deflected to the true-left when approaching the terminus and that Domain 1 is not
slow-moving or stagnant ice. Rather, the central flowline runs through Domain 27 into Domain 1,
and ice meeting the subglacial ridge appears to slow and extend transversely. This general pattern
is supported by patterns of deformation shown by ogive bands and ogive-origin foliae (see
below), and displacements of prominent ice-surface debris accumulations (Fig. 7 (c)). An absence
of crevasses and the low elevation of Domain 1 likely reflect high surface ablation rates and
reduced basal drag in this location on account of flow entering a deep, terminal subglacial basin
(Magnússon et al. 2012; Fig. 7(b)). An advance of the northern frontal margin at a time of no
clear change in the position of the southern frontal margin is noted by Phillips et al. (2017) as
further evidence that active ice flow is deflected to the true-left. However, such an advance could
also have resulted from thermal insulation of the ice margin by large terminal debris
accumulations that are not present in the southern region. Further, 2017 imagery confirms the
continued presence near the ice-front of the ‘rockfall’ moraine (Fig. 2).
Coherent glacier-wide, transverse ogive-origin banding is also present throughout the region of
proposed lobe-like and axial flow (e.g. Fig. 1(c)). Band-ogives are an arcuate glacier-wide
foliation phenomenon commonly observed in glacier tongues where ice has navigated a steep
produce an annual pair of lighter ‘winter’ and darker ‘summer’ bands comprising transverse
foliae that dip steeply upglacier (Swift, 2015). Individual foliae are produced by the healing,
rotation and shortening of crevasses formed within the icefall and by shearing at the base of the
ice fall, a process that has been observed to entrain basal ice and debris, with folia in darker
‘summer’ bands appearing denser and more sediment-rich (Goodsell et al. 2002). Drag imposed
by the valley bed and sides (see above; Fig. 6) causes ogive folia to rotate from being initially
sub-vertical to being semi bed-parallel, and bands to become increasingly arcuate, with distance
down-flow. Bands therefore form a series repeating arches that are convex in the direction of
glacier flow and closely spaced near the ice margins and widely spaced near the centre of flow
(see Fig. 8 and caption).
At Kvíárjökull, the integrity of ogive-origin foliation throughout the lower tongue and terminal
region indicates an absence of internal longitudinal shear of the magnitude required to support the
presence of discrete ice lobes and therefore support the pulsed axial flow hypothesis. It is also
clear that, near the terminus, the deformation patterns shown by dark ogive banding and related
transverse foliae show that active flow is directed towards the southern part of the frontal margin,
an observation supported by feature tracking (Fig. 2). This means the crevasse-free ice surface in
Domain 1 does not indicate stagnation, but likely indicates rapid ablation. Further, it is this flow
pattern, rather than strike-slip at the edge of Domain 1, that likely explains the c. 260 m
movement of the ice-cored esker between 2010 and 2014 (see Phillips et al., 2017). Further
evidence of this general flow pattern and the integrity of the ogive-origin foliation throughout the
lower tongue and terminal region is provided by observations of thrusting close to the terminus
that apparently occurs along ogive-origin foliae (Swift et al. 2006) (Figs. 4 and 8).
Surging as an analogue and links to surge mechanisms
Phillips et al. (2017) speculate that the pulses of flow required to produce individual lobes are the
bedrock highs beneath the upper tongue. Flowers et al. (2011) have indeed proposed a surge
mechanism linked to the presence of a subglacial basin (i.e. overdeepening), but observations at
surging glaciers demonstrate that surging in temperate ice leads to even greater plug-like flow
because it is associated with uniformly high basal water pressures that produce widespread, rapid
basal slip (e.g. Kamb et al. 1985). Surging ice has not – to our knowledge – been observed to
flow in a corridor past non-surging or stagnant ice adjacent. Surging can produce certain lobe-like
flow phenomena, specifically ‘loop’ or ‘tear-drop’ moraines (Post & LaChapelle, 1971), but these
occur only where surging ice from one glacier displaces or strongly shears the ice of another
glacier at a tributary-trunk junction. The images we present indicate no evidence of such lobe-like
structures at Kvíárjökull. Nonetheless, it is possible that decadal scale changes in velocity at
Kvíárjökull do occur, and that they may indeed be linked to the presence of subglacial basins that
influence subglacial hydrological and sediment transfer processes (e.g. Turrin and Forster, 2014).
Conclusion
The motivation for the study by Phillips et al. (2017) appears to be the assumption that crevasse
patterns at Kvíárjökull are inconsistent with traditional views of glacier flow. As a result, Phillips
et al. (2017) advance an explanation based on ice flow history. However, the analysis and
interpretation presented by Phillips et al. (2017) is inconsistent with our observations in two main
respects.
First, crucial aspects of crevasse formation and glacier flow are not given adequate consideration.
Crevasses form in response to near-surface stress in their immediate locality and close as glacier
flow causes ice to move from one stress regime to another, whilst traces of shallow crevasse may
be removed entirely by surface ablation. Crevasses cannot therefore be used to identify,
unequivocally, discrete areas or packages of ice flow originating decades apart, or areas of
only in much larger ice sheet systems and lacks physical plausibility at the valley glacier scale.
Second, unequivocal evidence of shear of suitable magnitude at the boundaries of the proposed
lobes is lacking. Even more importantly, the existence of such lobes is incompatible with
glacier-wide transverse ogive-origin foliae and thrusts observed in the glacier tongue.
A simpler explanation for the crevasse patterns at Kvíárjökull is the uneven nature of the glacier
bed, which is indicated by published bed data. This explanation is supported by the unchanging
nature and positions of crevasse patterns between 2009 (ARSF aerial photograph) and 2017
(PlanetScope imagery). Longer-term changes in crevasse patterns may nevertheless occur as a
result of glacier thinning and thickening, and it is likely that subtle changes in patterns identified
by Phillips et al. (2017) since 1940 reflect changes in mass balance that have affected ice
thickness and velocity. In the absence of other evidence, these explanations are far more likely
than those that invoke surge behaviour or, even, changes in the morphology of the bed.
Crevasse patterns should primarily be interpreted in view of valley and bed morphology, which
determines local patterns of stress in surface ice, but in addition caution needs to be exercised
when interpreting glacier surface structures because their behaviour cannot be extrapolated to ice
behaviour at depth. For example, horizontal and vertical displacements along faults likely
represent local movements on open crevasses or their traces in the context of the very different
behaviour of surface ice. Such ice is not subject to large confining pressures or the transverse
stress couplings that dictate the behaviour of ice within the body of the glacier below. In light of
this, the ‘sense of shear’ that may be demonstrated by small displacements observed on such
near-surface features must be considered insufficient to support broader theories of ice flow.
Acknowledgements
The Natural Environment Research Council Airborne Research and Survey Facility (NERC
acknowledges support for fieldwork in Iceland from the Royal Geographical Society through
awards SRG 20/12 (awarded to DAS) and SRG 18/07 (awarded to Simon J. Cook). Fieldwork in
Iceland was conducted under permit from The Icelandic Centre for Research (Rannis). Eyjólfur
Magnússon kindly supplied the glacier bed topography dataset. Robert G. Bryant and Jeremy C.
Ely are thanked for their advice during the preparation of an earlier version of this manuscript.
DAS also gratefully acknowledges discussions with David J. Graham. Mike Hambrey and one
anonymous reviewer provided constructive and valuable reviews of an initial submission of this
References
Benn, D.I., 2004. Clast morphology. In: Evans, D.J.A., Benn, D.I. (Eds.), A Practical Guide to the
Study of Glacial Sediments. Arnold, London.
Cook, S.J., Swift, D.A. 2012. Subglacial basins: their origin and importance in glacial systems
and landscapes. Earth Science Reviews 115, 332-372.
Cuffey, K.M., Paterson, W.S.B. 2010. The Physics of Glaciers, Fourth Edition. Elsevier.
Flowers, G.E., Roux, N., Pimentel, S., Schoof, C.G., 2011. Present dynamics and future
prognosis of a slowly surging glacier. The Cryosphere 5, 299-313.
Fountain, A.G., Walder, J.S., 1998. Water flow through temperate glaciers. Reviews of
Geophysics 36 (3), 299–328.
Goodsell, B., Hambrey, M.J., Glasser, N.F. 2002. Formation of band ogives and associated
structures at Bas Glacier d’Arolla, Valais, Switzerland. Journal of Glaciology 48, 287–300.
Hambrey, M. J., Murray, T., Glasser, N. F., Hubbard, A., Hubbard, B., Stuart, G., Hansen, S. and
Kohler, J. 2005. Structure and changing dynamics of a polythermal valley glacier on a centennial
time-scale: midre Lovénbreen, Svalbard. Journal of Geophysical Research, Earth Surface.
F010006,doi:10.1029/2004JF000128
Hambrey, M.J. 1994. Glacial Environments. UCL Press, London.
Hambrey, M.J. and Lawson, W. (2000). Structural styles and deformation fields in glaciers: a
Hambrey, M.J., Müller, F., 1978. Structures and ice deformation in the White Glacier, Axel
Heiberg Island, Northwest Territories, Canada. Journal of Glaciology 20, 41–66.
Heid, T., Kääb, A. 2012. Evaluation of existing image matching methods for deriving glacier
surface displacements globally from optical satellite imagery. Remote Sensing of Environment,
118, 339-355.
Hooke R. Leb. 1998. Principles of glacier mechanics. Upper Saddle River, NJ, Prentice Hall.
Hudleston, P.J. 2015. Structures and fabrics in glacial ice: A review. Journal of Structural
Geology, 81, 1-27.
Jennings, S.J.A., Hambrey, M.J., Glasser, N.F., 2014. Ice flow-unit influence on glacier structure,
debris entrainment and transport. Earth Surf. Process. Landf. 39, 1279-1292.
Joughin, I., MacAyeal, D. R., Tulaczyk, S. 2004. Basal shear stress of the Ross ice streams from
control method inversions, Journal of Geophysical Research, 109, B09405,
doi:10.1029/2003JB002960.
Kääb, A., Vollmer, M. 2000. Surface geometry, thickness changes and flow fields on creeping
mountain permafrost: automatic extraction by digital image analysis. Permafrost and Periglacial
Processes, 11, 315-326.
Kamb, B., Raymond, C.F., Harrison, W.D., Engelhardt, H., Echelmeyer, K.A., Humphrey, N.,
Brugman, M.M., Pfeffer, T. 1985. Glacier Surge Mechanism: 1982–1983 Surge of Variegated
Magnússon, E., Pálsson, F., Björnsson, H., Guðmundsson, S. 2012. Removing the ice cap of
Öræfajökull central volcano, SE-Iceland: Mapping and interpretation of bedrock topography, ice
volumes, subglacial troughs and implications for hazards assessments. Jökull, 62, 132-150.
Moore, P.L., Iverson, N.R., Brugger, K.A., Cohen, D., Hooyer, T.S., Jansson, P. 2011. Effect of a
cold margin on ice flow at the terminus of Storglaciären, Sweden: implications for sediment
transport. Journal of Glaciology 57, 77-87.
Moore, P.L., Iverson, N.R., Cohen, D. 2010 Conditions for thrust faulting in a glacier. Journal of
Geophysical Research, 115, F02005.
Nye, J.F. 1957. The distribution of stress and velocity in glaciers and ice-sheets. Proceedings of
the Royal Society, Series A. 239, No. 1216, 113-33.
Nye, J.F., 1952. The mechanics of glacier flow. Journal of Glaciology, 2, 82–93.
Phillips, E., Everest, J., Evans, D. J. A., Finlayson, A., Ewertowski, M., Guild, A., Jones, L. in
press. Concentrated, ‘pulsed’ axial glacier flow: structural glaciological evidence from
Kvíárjökull in SE Iceland. Earth Surface Processes and Landforms, doi: 10.1002/esp.4145.
Planet Team 2017. Planet Application Program Interface: In Space for Life on Earth. San
Francisco, CA. https://api.planet.com
Post, A., LaChapelle, E.R. 1971. Glacier Ice. University of Toronto Press, Toronto, Canada.
Raymond, C. F. 1971. Flow in a transverse section of Athabasca Glacier, Alberta, Canada.
Swift, D. A. 2015. Ogive. In: Hargitai, H. & Kereszturi, Á (eds.) Encyclopedia of Planetary
Landforms. Springer.
Swift, D. A., Evans, D. J. A., Fallick, A. E., 2006. Transverse englacial debris-rich ice bands at
Kvíárjökull, southeast Iceland. Quaternary Science Reviews 25, 1708-1718.
Turrin, J. B., Forster, R. R. 2014: A conceptual model of cyclical glacier flow in overdeepenings,
Figure 1: (a) Oblique view of Kvíárjökull, December 2012 (copyright Google Earth). Annotated
features are discussed in the text. (b) Domains mapped by Phillips et al. (2017), superimposed
onto an August 2009 aerial image. Annotations highlight an ‘axial flow’ corridor of more
elongate lobes, and deflection of flow toward the true-left by dextral shear near the terminus, as
proposed by Phillips et al. (2017). (c) Annotated aerial image showing a heavily crevassed ice
surface, and highlighting dark ogive banding and prominent transverse englacial foliation. The
dark ogive banding first appears immediately below the ice fall, see (a). The thrusts and the
Figure 2: Ice flow mapped from measured displacement of surface features between 8th August
and 1st September 2017 from PlanetScope imagery (see text). (a) Semi-transparent overlay
showing horizontal displacement (see colour bar, inset). (b) Flow lines of ice through the tongue,
overlaid onto horizontal displacement as in (a). (c) Displacement values for profiles A to C across
the glacier tongue (see (a)). True-right and true-left are indicated for an observer facing
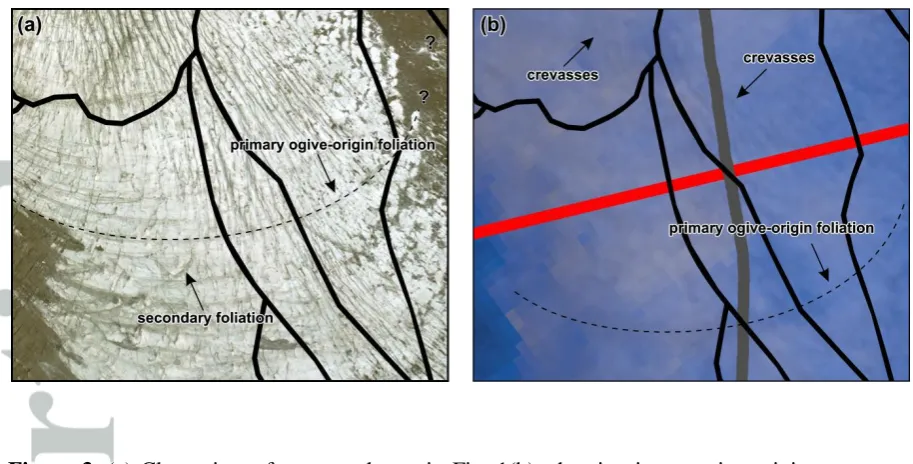
Figure 3. (a) Close view of an area shown in Fig. 1(b), showing intact ogive-origin transverse
foliation, even when crossing the boundaries between lobes (heavy black lines) mapped by
Phillips et al. (2017). (b) The same area from Fig. 2(a), showing displacement of transverse foliae
between 2009 and 2017 in a manner consistent with glacier flow, but no substantive change in the
patterns and locations of surface crevassing. The domains identified by Phillips et al. (2017) are
shown again for reference, and the heavy red and grey lines are the displacement profiles shown
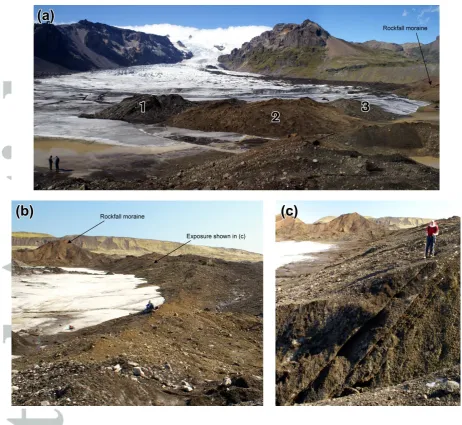
[image:21.595.68.525.68.300.2]Figure 4: Thrusts photographed in 2007 at the margin of Domain 1, which is a relatively low
relief area described by Phillips et al. (2017) as slow-moving or stagnant ice. (a) Small moraines
(labelled 1 to 3), forming from several separate thrust planes, viewed from the crest of the large
thrust moraine shown in (b). (b) View along the crest of a large thrust moraine from the southern
edge of the glacier tongue toward the ‘rockfall’ moraine (mapped in Fig. 1c). (c) Exposed thrust
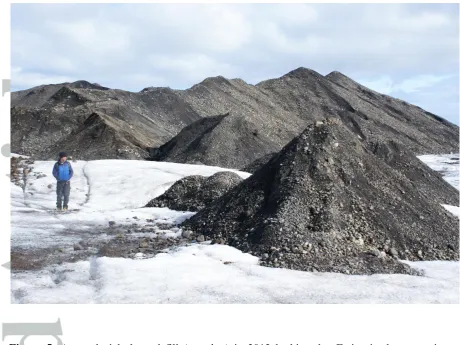
[image:22.595.62.525.67.492.2]Figure 5: An englacial channel fill (or esker) in 2012 looking due E, i.e. in the approximate
direction of ice flow. The esker is also visible in Fig. 1(a). The ‘concertina’ morphology is most
[image:23.595.63.524.69.414.2]Figure 6: Contours of longitudinal velocity in a transverse section of Athabasca Glacier inferred
from measurements in boreholes, redrawn from Raymond (1971). The glacier is c. 1 km wide,
which is approximately the width of Kvíárjökull. Values are in metres per year. ‘Plug flow’
Figure 7: (a) Interpreted crevasse and flow patterns near the terminus. The thin dashed line
defines an area of open crevassing, with active crevassing annotated in italic text. Thick
semi-transparent dashed lines indicate the approximate location of the subglacial ridge shown in (b).
Arcuate development of transverse foliae indicates that the central flowline (black arrow) is
directed through the crevasse-free area toward the true-right, in agreement with feature-tracking
(Fig. 2(b)). (b) Bed topography of the tongue and terminus region (Magnússon et al., 2012). (c)
Mapped displacement of prominent surface debris accumulations between 1998 and 2003.
Displacement of the ‘rockfall’ moraine (see Fig. 1(a)) is c. 10 m, whereas displacement of the
emergent thrust moraine crest in the crevasse-free area is 300 to 500 m. The background to (c)
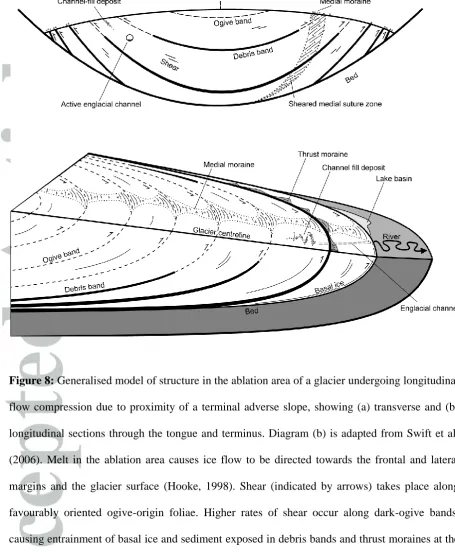
[image:25.595.67.524.79.493.2]Figure 8: Generalised model of structure in the ablation area of a glacier undergoing longitudinal
flow compression due to proximity of a terminal adverse slope, showing (a) transverse and (b)
longitudinal sections through the tongue and terminus. Diagram (b) is adapted from Swift et al.
(2006). Melt in the ablation area causes ice flow to be directed towards the frontal and lateral
margins and the glacier surface (Hooke, 1998). Shear (indicated by arrows) takes place along
favourably oriented ogive-origin foliae. Higher rates of shear occur along dark-ogive bands,
causing entrainment of basal ice and sediment exposed in debris bands and thrust moraines at the
glacier surface. Horizontal velocity patterns (cf. Fig. 2) mean foliae and thrusts are closely spaced
and almost vertical at the glacier margins (Phillips et al., 2017, Fig. 9c), and near the centreline
are widely spaced and dip gently upglacier. A medial moraine structure formed by the suture of
two separate flow units higher up the glacier is also folded into ogive foliation and subjected to
basins (cf. Fountain and Walder, 1998; Cook and Swift, 2012) are exhumed by ablation and
Going against the flow: testing the
hypothesis of pulsed axial glacier flow
Darrel A. Swift and Andrew H. Jones
Graphical Information File
Proposed lobe-like axial flow at a temperate glacier in southeast Iceland is appraised from both theoretical and empirical perspectives.
Migration of individual lobes of ice through a glacier is argued to lack physical plausibility and there is an absence of evidence of internal shear of the required magnitude.