Engaging with assessment: increasing student
engagement through continuous assessment
HOLMES, Naomi <http://orcid.org/0000-0002-0665-3518>
Available from Sheffield Hallam University Research Archive (SHURA) at:
http://shura.shu.ac.uk/11578/
This document is the author deposited version. You are advised to consult the
publisher's version if you wish to cite from it.
Published version
HOLMES, Naomi (2018). Engaging with assessment: increasing student
engagement through continuous assessment. Active Learning in Higher Education,
19 (1), 23-34.
Copyright and re-use policy
See
http://shura.shu.ac.uk/information.html
Page 1 of 12
Engaging with assessment: increasing student engagement through continuous assessment Naomi Holmes
Biographical/contact details of author
Naomi Holmes is a Senior Lecturer in Physical Geography. Her research interests include using technology to improve undergraduate student engagement and to enhance fieldwork learning, and the reconstruction of past environments using lake sediments.
Naomi Holmes, Department of the Natural and Built Environment, Sheffield Hallam University, City Campus, Howard Street, Sheffield, S1 1WB, UK. Tel: +441142253516. Email: n.holmes@shu.ac.uk
Abstract
Student engagement is intrinsically linked to two important metrics in learning: student satisfaction and the quality of the student experience. One of the ways that engagement can be influenced is through careful curriculum design. Using the knowledge that many students are ‘assessment-driven’ a low stakes continuous weekly summative e-assessment was introduced to a module. The impact this had on student engagement was measured by studying student activity within the module virtual learning environment (VLE). It was found that introduction of the e-assessments led to a significant increase in VLE activity compared to the VLE activity in that module the previous year, and also compared to the VLE activity of two other modules studied by the same student cohort. As many institutions move towards greater blended or online deliveries it will become more important to ensure that VLEs encourage high levels of student engagement in order to maintain or enhance the student experience.
Keywords
continuous assessment, learning analytics, student engagement, virtual learning environment.
Engagement and assessment
Student engagement, first introduced by Astin as student involvement in 1984, was initially defined as ‘the amount of physical and psychological energy that the student devotes to the academic experience’ (1999, p518). There has since been much debate about the meaning of student engagement (Trowler, 2010; Dunne and Owen, 2013), with more recent definitions incorporating the role of an institution in student engagement, for example, Exeter et al. (2010) suggest that student engagement refers to the 'time, energy and resources spent on activities designed to enhance learning at university' (p762). Student engagement is currently an important topic in higher education, with learning, marketing, retention rates and economics all influenced by the level of student engagement at an institution (Trowler, 2010). Student engagement is known to be correlated with student satisfaction (Kuh et al., 2007) and positive engagement by students is acknowledged to be an important indicator of quality (Coates, 2005). It is therefore important for higher education institutions to focus on increasing student engagement.
Page 2 of 12
Hullinger, 2008). Mitchell and Carbone (2011) suggest that engagement can be enhanced depending on the nature of the task the students are carrying out.
Assessment is a vital part of all university studies (Higher Education Academy, 2012). It is thought that the ‘single biggest influence on how students approach their learning’ (Rust et al., 2005, p231) is assessment, while Race (2009) states that ‘The most important thing we do for our students is assess their work’ (p3). 'Backwash' is a term which refers to the effect assessment has on student learning (Elton, 1987; Biggs and Tang, 2011); recognising that what and how students learn is largely determined by assessment. As well as providing a grade or mark to a student, assessment should also be designed to help students to learn and to engage with their studies.
Students tend to approach learning in one of two ways, broadly defined as ‘surface’ and ‘deep’ (McMahon, 2006). Surface learning aims to meet course requirements with minimal effort (Biggs and Tang, 2011), for example memorising facts without understanding, while deep learning aims to engage with the task meaningfully, with a focus on understanding underlying theories and principles (Biggs and Tang, 2011). The approach a student takes to learning will frequently depend on the task (Ramsden, 2003) and it has been stated that ‘one cannot be a deep or surface learner, one can only learn the content in a deep or surface way’ (Ramsden, 2003, p49). A student will vary their approach depending on the situation. Exeter et al. (2010) state that an engaged student will be 'one who is a deep learner' (p762). One of the tasks of an effective teacher is to try to encourage all students to take a deep approach to learning (McMahon, 2006; Biggs and Tang, 2011). It is important to try to encourage deep learning through assessment; and a positive learning experience can be created through careful alignment of assessment to learning outcomes (Biggs and Tang, 2011).
Student effort (and engagement) is known to often be unevenly distributed during a module (Gibbs and Simpson, 2004). Many students will not carry out work, or spend little time on it, if it does not contribute to their grade (Rust, 2002). Students are often strategic in their approach to University study, and many ‘only seriously engage with learning tasks if they are going to be assessed, with marks attached’ (Rust, 2002, p153). Lovatt et al. (2007, p40) found that ‘there is a tendency for students to concentrate their study into exam study weeks rather than engaging with the material throughout the semester.’ In many cases this means that students are only seriously engaging with a module at perhaps two or three points during that module, when they are being assessed. Working with this knowledge and the fact that, in most cases, ‘assessment defines what students regard as important, how they spend their time’ (Brown et al., 1997, p7) it should be possible to encourage increased motivation and engagement with a module by careful design and development of the assessment scheme (Biggs, 1996).
Van Gaal and De Ridder (2013) studied the impact of introducing assessment tasks at three points during a module on students’ examination performances and found that, in general, students performed better in the examination following the introduction of the assessment tasks. Marriott and Lau (2008) found that the use of online phased assessments encouraged students to work consistently through the year. The use of continuous assessments has also led to increased, and more uniform, attendance and improved examination performance (Cole and Spence, 2012). Continuous assessment, defined as ‘the use of tests over a learning unit, and the accumulation of results in a final grade’ (Miller et al., 1998, p34), has been described as ‘more formative than summative’ (Le Grange and Reddy, 1998, p10). Trotter (2006) used the term ‘continuous summative assessment’ to refer to this method of assessment and found that although it was relatively time-consuming for the lecturer, the positive effects on student motivation and learning were great. There is concern that continuous assessments encourage surface learning (Tan, 1992; Jordan, 2009), however, with considered design this can be avoided, allowing testing of higher cognitive functions such as critical thinking and analysis skills (Brady, 2005; Draper, 2005; Leung et al., 2008).
Student engagement with Virtual Learning Environments (VLEs)
Page 3 of 12
Hart and Rush (2007) suggest that the use of VLEs may necessitate an adjustment to the learning styles and approaches taken by individual students, and in doing so, may encourage them into modes of deep learning. Knight (2010) found that students who interacted with the online resources in a VLE consistently through a module adopted a deep learning approach. The design and functionality of a VLE is important and plays an important role in student engagement (Dale and Lane, 2007; Beer et al., 2010).
Lovatt et al. (2007) found that student use of a VLE decreased as the module progressed, and suggested that student interaction should be encouraged using methods including continuous assessment. Dale and Lane (2007) carried out an investigation into student engagement with a VLE with the intention of enhancing student engagement with online learning through the development of learning and teaching strategies. It is known that not all students will engage with a module (however interactive) to the same extent (Hart and Rush, 2007) and that motivating factors are needed to encourage engagement. Dale and Lane (2007) suggest that as student motivation is largely assessment driven then it would be a sensible approach to link VLE based activities with assessment. Marriott and Lau (2008) found that the use of online assessments had a positive impact on student motivation and engagement. It has been suggested that a student’s engagement throughout their degree is influenced by their first year at university (Kuh et al., 2007) and ‘that patterns of online learning appear to be fixed early on in students’ university careers’ (Maltby and Mackie, 2009, p58).
VLEs can provide much data about student interaction with learning materials (Beer et al., 2010). As delivery moves from face-to-face methods to online methods the teacher lacks the usual visual clues relating to student engagement, therefore monitoring VLE interaction is one way of tracking student engagement (Bodger et al., 2007; Ferguson, 2012). As well as engagement, the learning approaches of students have been investigated through their use of a VLE (Knight, 2010; Philips et al., 2012) while learning style has also been studied (Hsu, 2011). Recently a field of research into analytics in higher education has evolved (for example, Campbell and Oblinger, 2007; Ferguson, 2012; van Barneveld et al. 2012); originally under the umbrella of ‘academic analytics’ the new field of learning analytics has emerged. Learning analytics has been defined as ‘the measurement, collection, analysis and reporting of data about learners and their contexts, for purposes of understanding and optimizing learning and the environments in which it occurs’ (Society for Learning Analytics Research definition in Ferguson, 2012, p314). Van Barneveld et al. (2012) suggest that learning analytics can have a number of levels of focus including the individual learner, the instructor, the department and an institution. It is hoped that analysis of such data will allow instructors to monitor student engagement and evaluate the impact of learning and teaching practices (Chen et al., 2008; Dawson and McWilliam, 2008; Dawson et al., 2008; Van Barneveld et al., 2012; Henrie et al., 2015).
Different metrics have been investigated as indicators of engagement with a course VLE (Henrie et al., 2015). Ramos and Yudko (2008) found that student success in a course was related to the total number of page hits in a VLE (that is, learner–content interactions), a similar finding to Beer et al. (2010) who found a statistically significant relationship between student engagement (as recorded by number of clicks in a VLE) and student success. Agudo-Peregrina et al. (2014) studied student VLE interactions and analysed the data to find which interactions were important in influencing student academic performance, and whether VLE use had an impact on student success. They found that there was a significant relationship between student VLE interactions and success on online delivery courses, whereas this relationship was not significant for face-to-face courses supported by a VLE (Agudo-Peregrina et al., 2014). Mogus et al. (2012) investigated the impact of student activity in a virtual learning environment by comparing student VLE usage (by studying the activity logs) with their final grades. They found that there were some positive correlations between students’ activity logs and their final grades, with the strength of the correlation with final grade varying for different VLE-based activities. Henrie et al. (2015) suggest that more research is needed to understand what the VLE usage data can tell us about the student learning experience in order that teaching can be improved to better help students learn.
Page 4 of 12 Methods
This investigation is centred on an optional 20 credit second year undergraduate Physical Geography module (referred to as Module A) delivered at the University of Northampton, UK. Module A was delivered as a two hour session (consisting of lectures, seminars and practicals) weekly for 24 weeks. The VLE was used as a repository for module information (including lecture slides, handouts, reading lists, assignment information, links to news articles and TV programmes of interest), for assessments (e-submission and tests) and as a communication tool, and all students were encouraged to use the VLE as part of a blended learning approach. In 2011-2012 20% of the module was assessed using one in-class test; in 2012-2013 this was changed to weekly online tests (taken in the VLE in the students’ own time), with 20 tests each worth 1% of the assignment grade (20% in total). Both types of test (in-class and online) comprised multiple-choice questions, fill in the blank questions, short answer questions and data interpretation questions and were designed to assess the same learning outcomes. In both types of test there was a greater focus on testing students' understanding rather than recall of facts in order to encourage a deeper approach to learning. The other 80% of the module was assessed by coursework.
Data pertaining to two other optional 20 credit second year undergraduate Physical Geography modules (referred to as Modules B and C) were also collected. Modules B and C were delivered in the same way as module A (a two hour session (consisting of lectures, seminars and practicals) weekly for 24 weeks) with the module VLE used as a repository for module information, for submission of assessments and as a communication tool. The modules were assessed using a combination of examination (Module B), in-class tests (Module C) and coursework (Modules B and C).
All modules contained a mix of students typical of the University (a mix of males and females; mostly full time students, the majority were home and EU students with some international students, a few mature students, and some students with specific learning difficulties). In all three modules the VLE was continually updated with new material being provided for students throughout the duration of the module.
Virtual learning environment data
Module A: VLE activity data were collected for Module A for two academic years (2011-2012, 14 students, and 2012-2013, 20 students) in order to investigate the effects of changing part of the assessment strategy for the 2012-2013 academic year on student engagement with the VLE. Data were collected on the total number of logins and the total number of hours spent in the module by each student. Data from the two academic years were compared and analysed using a two sample t-test.
Comparable second year undergraduate modules: In order to compare use of the VLE by the same student cohort (not necessarily the same students) data for two other optional second year undergraduate modules (Module B,16 students, and Module C, 23 students) were collected alongside that for Module A. The data collected included the total number of logins to the module VLE and the total number of hours spent in the module VLE by each student during the 2012-2013 academic year. Daily data reflecting all user activity within the content area for each module’s VLE were collected for all three modules by generating an 'All User Activity Inside Content Areas' report’ for the spring term (07/01/13 to 28/03/13). Blackboard (2016) describes the All User Activity Inside Content Areas report as displaying 'a summary of all user activity inside content areas for a course'. Assessment data (deadline dates and type of assessment) were collected for each module. The total number of logins, total hours and total activity inside module area data for the three modules were analysed using one way-ANOVA, with significant results further investigated using Tukey’s honestly significant difference (HSD) post hoc test.
Results
Did the introduction of continuous e-assessments change student engagement with a VLE?
Page 5 of 12
number of logins of each student to the VLE. The total number of hours a student spent in the Module A VLE during 2011-2012 and 2012-2013 ranged from 0.7 to 226.2 hours (Table 1). The mean number of total hours was highest in 2012-2013 and varied significantly from 2011-2012 [two-sample t (19) = -10.22, p = 0.000]. The total number of logins to the Module A VLE ranged from 13 to 334 (see Table 2). The mean number of total logins was highest in 2012-2013 and was significantly different to the mean number of total logins in 2011-2012 [two-sample t (20) = -12.39, p = 0.000]. It is clear that the student engagement with the module VLE was significantly higher in 2012-2013 than in 2011-2012.
[Table 1]
[Table 2]
Did students engage more with the VLE of a module using continuous e-assessments than with VLEs of modules using only traditional assessment methods?
The engagement of students with the VLEs of two modules which use traditional assessment methods was studied and compared with the engagement of students with the Module A VLE. The total hours each student spent in the VLE, the total number of logins of each student to the VLE, and all user activity within the VLE were studied. The total number of hours a student spent inside the VLE during the 2012-2013 academic year for Modules A, B and C (see Table 3) varied from 0.14 (Module B) to 226.2 (Module A). The mean number of total hours spent in a module VLE was highest for Module A, followed by Module C and then Module B (see Table 3). The mean number of total hours in a module VLE varied significantly between the three modules [F(2,56) = 11.94, p = 0.000]. Post hoc tests showed that the mean number of total hours spent in the Module A VLE was significantly different to the mean number of total hours spent in the VLE of both Modules B and C, while Module B and C do not differ significantly to each other.
[Table 3]
The total number of times each student logged in to the VLE for Modules A, B and C during the 2012-2013 academic year (see Table 4) varied from 17 (Module B) to 334 (Module A). The mean number of logins to a module VLE was highest for Module A, followed by Module C and then Module B (see Table 4). The mean number of logins to a VLE varied significantly between the three modules [F(2,56) = 19.41, p = 0.000]. Post hoc tests showed that the mean number of logins to the Module A VLE was significantly different to the mean number of logins to the VLEs of both Modules B and C, while Module B and C do not differ significantly to each other.
[Table 4]
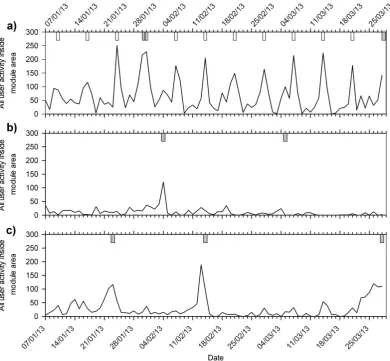
Total user activity within the content area of a module’s VLE during the spring term of the 2012-2013 academic year varied from 867 (Module B) to 5567 (Module A), as can be seen from Table 5. Total daily activity within the content area of the VLE sites ranged from 0 (all modules) to 251 (Module A), as can be seen from Figure 1 and Table 5. All modules had days with no activity in the content areas (Module A = 1 day; Module B = 16 days; Module C = 7 days). It is clear that peaks of user activity coincide with assessment deadlines (Figure 1). Mean daily activity was highest for Module A, followed by Module C and then Module B (see Table 5). The mean total daily user activity differed significantly between the three modules [F(2,240) = 41.64, p = 0.000]. Post hoc tests indicated that the mean daily total user activity within the content areas of the VLE sites was significantly different between all three modules.
Page 6 of 12 [Table 5]
The data from all three metrics show that the module which used continuous e-assessments experienced significantly increased student engagement with the VLE compared to the two modules which used traditional assessment methods.
Discussion and conclusions
The adoption of continuous e-assessments into a module led to increased student engagement with that module, as measured by interactions with the VLE. For many students much of their interaction with a module now occurs in a VLE, and this offers an opportunity to monitor student interaction and engagement with the module, at both individual and cohort levels (Van Barneveld et al., 2012). Monitoring student use of a VLE does seem to provide useful information about engagement, though deciding upon the metric(s) to be used to represent a student's engagement is important (Henrie et al., 2015). This study found that it was necessary to look at a number of factors representing VLE usage; it is not sensible to look just at data on the hours spent in the VLE (cf. Dawson et al., 2008; Beer et al., 2010). Engagement with a VLE was investigated by looking at the total hours spent in the VLE, total number of logins to the VLE and total interactions with content in the VLE. These parameters gave a reasonably good picture of how students used the VLE, but caution is needed when interpreting such data. For example, the student who spent the shortest time in the Module A VLE in the 2012-2013 academic year achieved the highest grade in the e-assessments. This student also accessed the most items in the VLE and had a number of logins greater than the mean. The student used their time in the VLE effectively, downloading and saving files for later use. The use of only one metric (in this case time in VLE) would not have provided a useful measure of this individual's engagement with the module. The collection and analysis of data relating to student interactions with a VLE has proven to be a useful method of inferring engagement, but it should be noted that there are a number of legal and ethical issues associated with learning analytics which need to be considered (Sclater, 2014; Jisc, 2015).
The introduction of low stakes continuous e-assessments into a module (Module A) led to increased engagement with the module VLE throughout the academic year when compared to the same module the previous year. The increased interactions with the VLE were much greater than could be expected if all the 'additional' interactions (logins and time in VLE) in 2012-2013 when compared to 2011-2012 were directly linked to students actually taking the e-assessments (this would account for a maximum of 10 hours and 20 logins per student). Interaction with the VLE of Module A (which uses e-assessments) was significantly higher than that with the VLEs of Modules B and C (which are assessed using more traditional assessments). The introduction of continuous assessment to Module A seems to have increased the total engagement as well as ensuring that students engage throughout the year. There were still clear peaks in engagement with the Module A VLE associated with assessment deadlines, but the weekly nature of the assessment encouraged students to engage with the VLE consistently throughout the module. In the modules with traditional assessments (Modules B and C) it is clear that student engagement peaked a few times through the year (the days before the assessment deadlines). These findings corroborate those of earlier research which found that continuous assessment led to enhanced student engagement (Marriott and Lau, 2008) and support the suggestion that continuous assessment could help to increase engagement with a VLE throughout a module (Dale and Lane., 2007; Lovatt et al., 2007), perhaps leading to higher levels of attainment by students (cf. Knight, 2010).
Page 7 of 12
perceptions of their learning and engagement in response to the use of continuous e-assessment (in Module A) and found that students considered that their increased engagement, and improved learning and understanding, were a direct consequence of the use of the continuous e-assessments with one stating that the tests ‘make sure I actually read my notes and understand what was taught each week' (Holmes, 2015, p8). The frequent testing, and associated immediate feedback, motivated and encouraged students to engage with the module material and to perform well throughout the module (Holmes, 2015). The average grade for Module A was higher in 2012-2013 than in 2011-2012, with a greater percentage of students achieving the equivalent of a first class or upper-second class grade in the module in 2012-2013 than in 2011-2012. These findings, along with the VLE usage data, suggest that careful changes in curriculum can successfully increase student engagement with a module.
An important limitation of this study is that it investigated the engagement of small numbers of students on just three modules at one higher education institution within one country. A larger study, including students studying a variety of subjects in a number of institutions, including those from other countries, would be useful. Investigating the thoughts of students on the impact that the design of a VLE has on their engagement with it, and exploring how different students use the VLE to support their learning, would also be beneficial, ensuring that a VLE can be designed to help all learners. It could also be valuable to compare the VLE activity of individual students taking Module A across different modules to explore whether they change their learning behaviour in other modules as a result of an assessment change (introduction of continuous e-assessments) in one module. This study only presents a snapshot of information; a longitudinal study following the VLE interactions of these individual students over the remainder of their course would allow the investigation of whether there are any long term benefits to their engagement with their studies. If it is found that students do change their behaviour as a result of curriculum change then it may be beneficial to include low-stakes continuous e-assessment in first year undergraduate modules to encourage all students to engage with the VLE throughout their degree programme.
There is currently a move towards greater blended learning and online delivery. It is possible for online learning environments to have as good student engagement, and therefore student satisfaction levels, as face-to-face learning environments. Engagement with a VLE is influenced by the VLE itself and therefore it is important that VLEs are designed to encourage high student engagement and not just to act as an information repository. It is clear that careful curriculum design, including assessment activity, can significantly increase student engagement, thereby enhancing the student experience and leading to greater levels of student satisfaction.
Acknowledgements
Thank you to Adel Gordon and Simon Thompson who helped with obtaining the Blackboard (VLE) data. Thank you to two referees for their constructive comments on an earlier version of this manuscript.
Funding
This research received no specific grant from any funding agency in the public, commercial, or not-for-profit sectors.
References
Agudo-Peregrina ÁF, Iglesias-Pradas S, Conde-González MÁ and Hernández-García Á (2014) Can we predict success from log data in VLEs? Classification of interactions for learning analytics and their relation with performance in VLE-supported F2F and online learning. Computers in Human Behavior 31: 542–550.
Astin AW (1999) Student Involvement: A Developmental Theory for Higher Education. Journal of College Student Development 40(5): 518–529.
Page 8 of 12
ascilite Sydney 2010 (pp.75–86). Available at: http://ascilite.org.au/conferences/sydney10/procs/Beer-full.pdf (accessed 6 October 2014).
Biggs J (1996) Enhancing teaching through constructive alignment. Higher Education 32(3): 347-364.
Biggs J and Tang C (2011) Teaching for Quality Learning at University. Maidenhead: Open University Press.
Blackboard (2016) Course Reports. Available: https://en-us.help.blackboard.com/Learn/9.1_2014_04/Instructor/130_Student_Performance/020_Course_Repo rts (accessed 12 January 2016).
Blin F and Munro M (2008) Why hasn’t technology disrupted academics’ teaching practices? Understanding resistance to change through the lens of activity theory. Computers & Education 50(2): 475–490.
Bodger E, Hart M and Rush D (2007) Tracking our Students as they Learn. In: 6th European Conference on e-Learning [ECEL2007], Copenhagen Business School, Copenhagen, Denmark, 4th-5th October, 2007 Available: http://mh-lectures.co.uk/pubs/papers/tracking.pdf (accessed 6 October 2014).
Brady A-M (2005) Assessment of learning with multiple-choice questions. Nurse Education in Practice 5(4): 238–242.
Brown G, Bull J and Pendlebury M (1997) Assessing student learning in higher education. London: Routledge.
Campbell JP and Oblinger DG (2007) Academic Analytics. Educause. Available: https://net.educause.edu/ir/library/pdf/PUB6101.pdf (accessed 6 October 2014).
Chen PD, Kuh GD and Gonyea RM (2008) Learning at a distance: Engaged or not? Innovate Journal of Online Education 4(3). Available: http://www.editlib.org/p/104252/article_104252.pdf (accessed 23 September 2015).
Coates H ( 2005) The value of student engagement for higher education quality assurance. Quality in Higher Education 11(1): 25–36.
Cole JS and Spence SWT (2012) Using continuous assessment to promote student engagement in a large class. European Journal of Engineering Education 37(5): 508–525.
Dale C and Lane A (2007) A Wolf in Sheep’s Clothing? An Analysis of Student Engagement with Virtual Learning Environments. Journal of Hospitality, Leisure, Sport and Tourism Education 6(2): 100–108.
Dawson S and McWilliam E (2008) Investigating the application of IT generated data as an indicator of learning and teaching performance. Australian Learning and Teaching Council. Available: http://www.olt.gov.au/system/files/resources/grants_cg_report_itgenerated_qut_feb09.pdf (accessed 6 October 2014).
Dawson S, McWilliam E and Tan JPL (2008) Teaching smarter: How mining ICT data can inform and improve learning and teaching practice. In: Hello! Where are you in the landscape of educational technology? Proceedings ascilite Melbourne 2008. (pp.221-230) Available: http://www.ascilite.org.au/conferences/melbourne08/procs/dawson.pdf (accessed 23 September 2015).
Draper SW (2009) Catalytic assessment: understanding how MCQs and EVS can foster deep learning. British Journal of Educational Technology 40(2): 285–293.
Dunne E and Owen D (2013) Introduction. In Dunne E and Owen D (eds) The Student Engagement handbook: Practice in Higher Education. (pp. xv-xxv) Bingley: Emerald.
Elton L (1987) Teaching in Higher Education: Appraisal and Training. London: Kogan Page.
Exeter DJ, Ameratunga S, Ratima M, Morton S, Dickson M, Hsu D and Jackson R (2010) Student engagement in very large classes: the teachers' perspective. Studies in Higher Education 35(7): 761–
75.
Ferguson R (2012) Learning analytics: drivers, developments and challenges. International Journal of Technology Enhanced Learning 4(5/6): 304–317.
Ghiatău R, Diac G and Curelaru V (2011) Interaction between summative and formative in higher education assessment: students’ perception. Procedia – Social and Behavioral Sciences 11: 220–
224.
Gibbs G and Simpson C (2004) Conditions under which assessment supports students' learning.
Learning and Teaching in Higher Education Issue 1 2004-2005: 3–31.
Gikandi JW, Morrow D and Davis NE (2011) Online formative assessment in higher education: A review of the literature. Computers & Education 57(4): 2333–2351.
Hart M and Rush R (2007) E-learning and the development of ‘voice’ in business studies education.
Page 9 of 12
Henrie CR, Halverson LR and Graham CR (2015) Measuring student engagement in technology-mediated learning: A review. Computers & Education 90: 36-53.
Higher Education Academy (2012) A Marked Improvement: Transforming Assessment in Higher Education. Available: https://www.heacademy.ac.uk/sites/default/files/A_Marked_Improvement.pdf (accessed 6 October 2014).
Holmes N (2015) Student perceptions of their learning and engagement in response to the use of a continuous e-assessment in an undergraduate module. Assessment and Evaluation in Higher Education 40(1): 1-14.
Hsu L (2011) The perceptual learning styles of hospitality students in a virtual learning environment: The case of Taiwan. Journal of Hospitality, Leisure, Sport and Tourism Education 10(1): 114–127.
Jisc (2015) Code of practice for learning analytics. Available: https://www.jisc.ac.uk/sites/default/files/jd0040_code_of_practice_for_learning_analytics_190515_v1. pdf (accessed 12 January 2016).
Jordan S (2009) Assessment for learning: pushing the boundaries of computer-based assessment.
Practitioner Research in Higher Education 3(1): 11–19.
Knight J (2010) Distinguishing the learning approaches adopted by undergraduates in their use of online resources. Active Learning in Higher Education 11(1): 167–176.
Kuh GD (2009) What Student Affairs Professionals Need to Know About Student Engagement.
Journal of College Student Development 50(6): 683–706.
Kuh GD, Kinzie J, Buckley JA, Bridges BK and Hayek JC (2007) Piecing together the student success puzzle: Research, propositions and recommendations. ASHE Higher Education Report 32. San Francisco: Jossey-Bass.
LeGrange L and Reddy C (1998) Continuous Assessment: An introduction and guidelines to implementation. Cape Town: Juta Higher Education Publishers.
Leung SF, Mok E and Wong D (2008) The impact of assessment methods on the learning of nursing students. Nurse Education Today 28(6): 711–719.
Lovatt J, Finlayson OE and James P (2007) Evaluation of student engagement with two learning supports in the teaching of 1st year undergraduate chemistry. Chemistry Education Research and Practice 8(4): 390–402.
Maltby A and Mackie S (2009) Virtual learning environments – help or hindrance for the ‘disengaged’ student? ALT-J, Research in Learning Technology 17(1): 49–62.
Marriott P and Lau A (2008) The use of on-line summative assessment in an undergraduate financial accounting course. Journal of Accounting Education 26(2): 73–90.
McMahon T (2006) Teaching for More Effective Learning: Seven maxims for practice. Radiography 12(1): 34–44.
Miller A, Imrie B and Cox K (1998) Student Assessment in Higher Education: A Handbook for Assessing Performance. London: Kogan Page.
Mitchell I and Carbone A (2011) A typology of task characteristics and their effects on student engagement. International Journal of Educational Research 50(5/6): 257–270.
Mogus A, Djurdjevic I and Suvak N (2012) The impact of student activity in a virtual learning environment on their final mark. Active Learning in Higher Education 13 (3): 177-189.
Phillips R, Maor D, Preston G and Cumming-Potvin W (2012) Exploring Learning Analytics as Indicators of Study Behaviour. In Amiel T and Wilson B (eds) Proceedings of World Conference on Educational Multimedia, Hypermedia and Telecommunications 2012 (pp. 2861–2867). Chesapeake,
VA: AACE.
Race P (2009) Designing assessment to improve Physical Sciences learning. A Physical Sciences Practical Guide. Higher Education Academy. Available: http://www-new1.heacademy.ac.uk/assets/documents/subjects/ps/ps0069_designing_assessment_to_improve_p hysical_sciences_learning_march_2009.pdf (accessed 6 October 2014).
Ramos C and Yudko E (2008) “Hits” (not “Discussion Posts”) predict student success in online courses: A double cross-validation study. Computers & Education 50(4): 1174–1182.
Ramsden P (2003) Learning to Teach in Higher Education. Abingdon: Routledge.
Robinson CC and Hullinger H (2008) New benchmarks in higher education: Student engagement in online learning. Journal of Education for Business 84(2): 101–108.
Rust C (2002) The impact of assessment on student learning: How can the research literature practically help to inform the development of departmental assessment strategies and learner-centred assessment practices? Active Learning in Higher Education 3(2):145–158.
Page 10 of 12
Sclater N (2014) Code of practice for learning analytics A literature review of the ethical and legal issues. Jisc. Available: http://repository.jisc.ac.uk/5661/1/Learning_Analytics_A-_Literature_Review.pdf (accessed 7 January 2016).
Tan CM (1992) An evaluation of the use of continuous assessment in the teaching of physiology.
Higher Education 23(3): 255-272.
Thelwall M (2000) Computer-based assessment: a versatile educational tool. Computers & Education 34(1): 37–49.
Trotter E (2006) Student perceptions of continuous summative assessment. Assessment and Evaluation in Higher Education 31(5): 505–521.
Trowler V (2010) Student engagement literature review. Higher Education Academy. Available: https://www.heacademy.ac.uk/sites/default/files/StudentEngagementLiteratureReview_1.pdf
(accessed 6 October 2014).
van Barneveld A, Arnold KE and Campbell JP (2012) Analytics in Higher Education: Establishing a Common Language. Educause. Available: http://net.educause.edu/ir/library/pdf/ELI3026.pdf (accessed 6 October 2014).
Page 11 of 12 Figure and Tables
[image:12.595.63.536.598.640.2]Figure 1 All user activity inside content area of VLE module site during the spring term (07/01/2013 to 28/03/13) for three second year undergraduate modules. Traditional assessment deadlines are marked by the grey bars; Continuous e-assessment deadlines are marked by the white bars. a) Module A; b) Module B; c) Module C.
Table 1 Total number of hours students spent in the Module A VLE during the 2011-2012 and 2012-2013 academic years.
Academic Year
Minimum number of Total hours
Maximum number of Total hours
Mean number of Total hours
SE Mean St Dev
2011-2012 0.7 19.8 7.7 1.4 5.4
[image:12.595.70.531.693.735.2]2012-2013 11.9 226.2 135 12.4 55.3
Table 2 Total number of logins made by each student to the Module A VLE during the 2011-2012 and 2012-2013 academic years.
Academic Year
Minimum number of Total logins
Maximum number of Total logins
Mean number of Total logins
SE Mean St Dev
2011-2012 13 44 30.4 2.5 9.3
Page 12 of 12
Table 3 Total number of hours students spent in the VLE module sites for three second year undergraduate modules during the 2012-2013 academic year (Modules A, B and C).
Module Minimum number of
Total hours
Maximum number of Total hours
Mean number of Total hours
SE Mean St Dev
Module A 11.9 226.2 135 12.4 55.3
Module B 0.14 173.3 63.1 11.4 45.4
[image:13.595.68.531.104.156.2]Module C 21.3 163.3 82.47 7.99 38.32
Table 4 Total number of logins made by each student to the VLE module sites for three second year undergraduate modules during the 2012-2013 academic year (Modules A, B and C).
Module Minimum number of
Total logins
Maximum number of Total logins
Mean number of Total logins
SE Mean St Dev
Module A 107 334 188.3 12.5 55.9
Module B 17 189 90.3 12.2 48.8
Module C 27 233 104.7 12.6 60.3
Table 5 All user activity within content area of module VLE sites during the spring term (07/01/2013 and 28/03/13) for three second year undergraduate modules.
Module Total user
activity within site during study
period
Minimum daily activity
Maximum daily activity
Mean daily activity
SE Mean St Dev
Module A 5546 0 251 68.5 6.69 60.2
Module B 867 0 121 10.7 1.78 16.0
[image:13.595.78.535.209.261.2] [image:13.595.77.539.315.387.2]