Determination of trace elements in crude oils by ICP-MS
using detergent microemulsion.
AL-MARMORI, Seham S.
Available from Sheffield Hallam University Research Archive (SHURA) at:
http://shura.shu.ac.uk/19250/
This document is the author deposited version. You are advised to consult the
publisher's version if you wish to cite from it.
Published version
AL-MARMORI, Seham S. (2008). Determination of trace elements in crude oils by
ICP-MS using detergent microemulsion. Masters, Sheffield Hallam University (United
Kingdom)..
Copyright and re-use policy
I Sheffield S1 1WB
1 0 1 9 2 1 6 4 6 8
ProQuest Number: 10694130
All rights reserved
INFORMATION TO ALL USERS
The quality of this reproduction is dependent upon the quality of the copy submitted.
In the unlikely event that the author did not send a com plete manuscript and there are missing pages, these will be noted. Also, if material had to be removed,
a note will indicate the deletion.
uest
ProQuest 10694130
Published by ProQuest LLC(2017). Copyright of the Dissertation is held by the Author.
All rights reserved.
This work is protected against unauthorized copying under Title 17, United States C ode Microform Edition © ProQuest LLC.
ProQuest LLC.
789 East Eisenhower Parkway P.O. Box 1346
Determination of Trace Elements in
Crude Oils by ICP-MS Using Detergent
Microemulsion
Seham S. Al-Marmori
A thesis submitted to the Faculty of Health and Wellbeing of Sheffield Hallam University
in partial fulfillment of the requirements for the degree of Master of Philosophy
Abbreviations
API American Petroleum Institute
UOP Universal Oil Product
ppm Parts Per Million
LPG Liquefied Petroleum Gas
FAAS Flame Atomic Absorption Spectrometry
ETAAS Electrothermal Atomization In Graphite Furnace
ICP-OES Inductively Coupled Plasma-Optical Emission Spectrometry
ICP-MS Inductively Coupled Plasma-Mass Spectrometry
VG Vapor Generation
IBMK Isobutyl Methyl Ketone
BA Butyl Acetate
ETV Electrothermal Vaporization
USN Ultrasonic Nebulizer
MIBK Methyl Isobutyl Ketone
SPL Solvent Plasma Load
NaDS Sodium Dodecylsulphate
HLB Hydrophile-Lipophile Balance
SDS Sodium Dodecylsulphate
ETV ICP-MS Electrothermal Vaporization Inductively Coupled
K Kelvin
TDS Total Dissolved Solid
bbl Barrels
bbl/d Barrels Per Day
HP Hewlett Packard
RF Radio Frequency Power
Sp.g Specific Gravity
EDS Emulsion Droplet Size
CRM Certified Reference Material
LOD Limits of Detection
LOQ Limits of Quantification
RSD Relative Standard Deviation
SD Standard Deviation
r2 Correlation Coefficient
Abstract
A method was developed and evaluated in terms of its analytical performance for the
determination of Ti, V, Cr, Mn, Ni, Cu, Mo, Cd, Sn and Pb concentrations in three
Libyan crude oil samples using ICP-MS. The samples were introduced to the plasma
after the formation of microemulsions in which Triton X-100 was used as the emulsifier
and tetralin was the co-solvent with the addition of nitric acid in order to enable
calibration with aqueous standard. The validity of the method was proven by three
different traditional sample preparation protocols (dry ash, wet digestion and microwave
digestion) and good agreement was obtained between the results using the proposed and
comparative procedures. The accuracy was confirmed by analysing two different
certified reference materials (Used Oil HU-1 from SCP science and Wear Metals in
Lubricating Oils 1084a from NIST). The recoveries ranged from 100.1% to 119.9 % for
all elements and 85.1 % for Cr in Used Oil HU-1 and from 84.8 % to 100.1 % for all
elements and 79.1 % for Cr in 1084a NIST. The precision of the method was < 5% for
all elements, except for Cr which was 30.9 %. The limits of detection based on 3 times
standard deviation of the blank (10 replicates), were ranging from 0.1 to 0.7 ng g' 1 for
all elements and 4.8 ng g' 1 for Cr. The limits of quantification based on 10 times
standard deviation of the blank (10 replicates) ranged between 0.2 to 2.4 ng g' 1 and 16.1
ng g' 1 for Cr. Satisfactory recoveries were obtained when 2 pg L' 1 and 10 pg L’1
multielement spikes were used to test the accuracy o f the developed method. The
method has proven to be reliable, and can be used in routine analysis in laboratories
Dedication
I would like to dedicate my thesis to my father and mother who
offered me unconditional love and support throughout my life.
To my dear husband, without his support, and gentle encour
agement, I wouldn’t have finished this thesis, and to a loving
family that just never stopped giving o f themselves in countless
Acknowledgements
Praise and gratitude be to ALLAH, Almighty, without whose gracious help it would
have been impossible to accomplish this work.
I would like to acknowledge and extend my gratitude to my supervisor Dr. Philip
Gardiner, for his guidance and helpful suggestions throughout this study and for his
vital encouragement and support. My thanks to Professor Malcolm Clench, for his
understanding and assistance. I am also deeply thankful to Professor Nicola
Woodroofe, for her efforts to afford a supportive environment for students in BMRC
to finish their studies. Many thanks to Dr. Peter Drew, for his invaluable advices and
supplies of references. And to the two helpful ladies, Marguerite Lyons and Sarah
Wright for the help and inspiration they extended.
My gratitude to Libyan Petroleum Institute for giving me this opportunity for
Contents
ABBREVIATIONS...I
ABSTRACT... Ill
DEDICATION... IV
ACKNOWLEDGEMENTS... V
CONTENTS...VI
LIST OF FIGURES...X
LIST OF TABLES...XII
CHAPTER 1... 1
1. INTRODUCTION...1
1.1 OCCURRENCES AND IMPORTANCE OF CRUDE OIL AND FRACTIONS...1
1.2 CLASSIFICATION OF CRUDE OIL... 2
1.3 CHEMICAL COMPOSITION OF OIL...3
1.3.1 Hy d r o c a r b o n s...3
1.3.2 No n h y d r o c a r b o n s...4
1.3.2.1 Sulphur Compounds...4
1.3.2.2 Oxygen Compounds...4
1.3.2.3 Nitrogen Compounds...5
1.3.2.4 Salts...5
1.3.2.5 Carbon Dioxide...6
1.3.2.6 Trace M etals...6
1.4.1 REFining OpErations... 8
1.4.1.1 Fractionation...8
1.4.1.2 Conversion processes...10
1.4.1.3 Treatment....10
1.4.1.4 Formulating and Blending....10
1.4.2 Major REFinEry Products...10
1.5 ELEMENTAL DETERMINATIONS BY ATOMIC SPECTROMETRY... 11
1.6 SAMPLE PRETREATMENT AND PREPARATION...13
1.7 EMULSION...16
1.8 INDUCTIVELY COUPLED PLASMA-MASS SPECTROMETRY (ICP-MS)... 27
1.8.1 In st r u m E n t Optim iza tio na n d Tu n in g... 32
1.8.2 In t E r F E r E n c E s...32
1.8.2.1 Isobaric Interferences...32
1.8.2.2 Molecular (or Polyatomic) Interferences...32
1.8.2.3 Doubly- Charged Ion Interferences...33
1.8.3. Ma t r k EF F E c t s... 34
1.9 RELIABLE MEASUREMENTS...35
1.9.1 ME t h o d Va l id a t io n... 35
1.9.1.1 Specificity & selectivity...35
1.9.1.2 Accuracy or Bias...35
1.9.1.3 Precision...36
1.9.1.4 Limit o f Detection (LOD)...36
1.9.1.5 Limit o f Quantification (LOQ)...36
1.10 CHARACTERISATION OF LIBYAN CRUDE OILS... 37
1.12 THE MOTIVATION... 41
1.13 THE AIMS... 41
CHAPTER 2 ... 42
2. EXPERIMENTAL...42
2.1 INSTRUMENTATION... 42
2.2 REAGENTS...43
2.3 SAMPLE PREPARATION...44
2.3.1 Dr y As h i n g...44
2.3 .2 WE t Di g E s t i o n... 44
2.3 .3 Mic r o w a v E Dig E s t io n... 44
2.3 .4 Mic r o E m u l s io n Pr E p a r a t io n... 45
CHAPTER 3 ... 46
3. RESULTS AND DISCUSSION... 46
3.1 OPTIMIZATION OF THE MICROEMULSION FORMATION...46
3.2 FACTORS AFFECTING MICROEMULSION STABILITY...48
3.2.1 SONICATION AND TEMPERATURE... 48
3 .2 .2 Ac id it y (pH ) ... 50
3 .2 .3 Dr y n E s so F Gl a s s w a r Ea n d Or d E ro F Ad d it io no F Em u l s io n Co n s t it u E n t s 54 3.3 ANALYTICAL FIGURE OF MERIT... 58
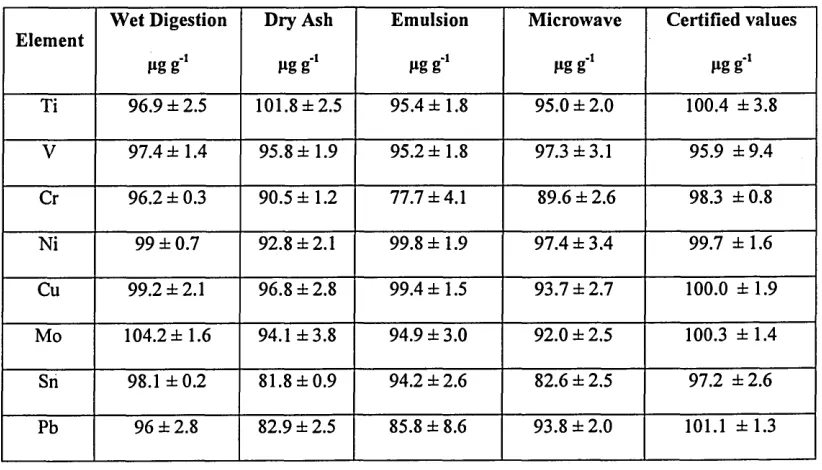
3.4 METHOD VALIDATION... 61
3.5 RECOVERY TEST...64
3.6 ANALYSIS OF REFERENCE MATERIALS...66
3.8 REAL SAMPLES RESULTS... 70
CHAPTER 4 ... 74
4.1 CONCLUSION...74
4.2 RECOMMENDATIONS...76
REFERENCES...78
L
ist of Figures
Figure 1 Distillation Units at the Azzawiya oil refinery... 8
Figure 2 The fractional distillation process... 9
Figure 3 Water-in-oil emulsions...18
Figure 4 Schematic of ICP-MS main processes... 27
Figure 5 Schematic of a spray chamber...28
Figure 6 ICP-MS plasma torch... 29
Figure 7 Schematic of sampling and skimmer cones with the extraction Lenses... 30
Figure 8 Libyan Sedimentary Basins... 39
Figure 9 Pictures o f the emulsions at pH between 2 and 12... 51
Figure 10 A picture for El-Sharara, El-Bouri and Amna emulsified crude oils prepared with the proposed m ethod...53
Figure 11 A stable transparent microemulsion of Amna crude oil prepared with the proposed m ethod...55
Figure 12 An unstable unclear microemulsion of Amna crude oil prepared with the proposed method without acid and sonication ...56
Figure 13 Separate phases o f Amna crude oil microemulsion prepared with the proposed method without acid and sonication... 57
microemulsion standard...60
Figure 15 Emulsified El-Sharara Libyan crude oil samples spiked with
L
ist of Tables
Table 1 The mean concentration of some trace elements of West Canada
basin with their ranges in (ppm)...7
Table 2 Interferences from organic crude oil that may occur in quadrupole
ICP-MS...34
Table 3 Characteristics o f Libyan Crude O ils...38
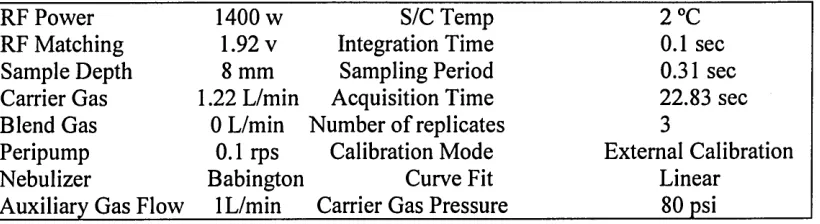
Table 4 The operating conditions of HP Hewlett Packard 4500 ICP-MS 42
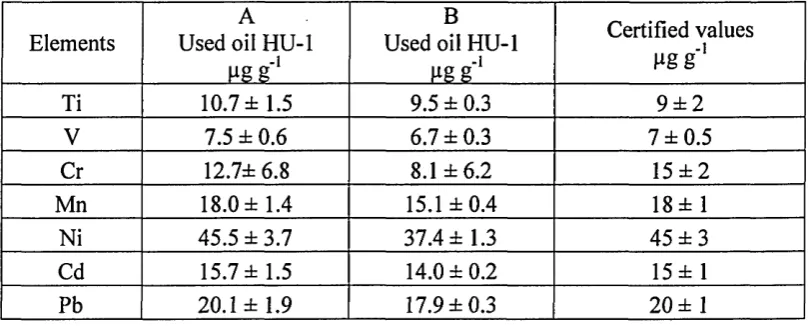
Table 5 Used oil HU-1 trace elements concentration A) after forming a
microemulsion with the use of temperature and sonication and B)
after forming a microemulsion without the use of temperature and
sonication... 50
Table 6 El-Bouri, El-Sharara and Amna crude oils microemulsion results
with and without 0.1 % HNO3...53
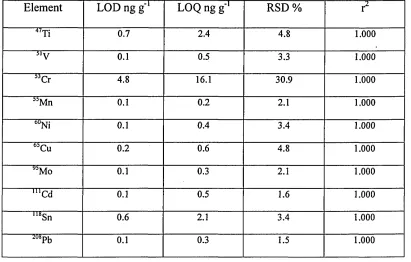
Table 7 Precision (RSDs), LODs, LOQs (ng g'1) and (r2) for trace elements
determination using oil in water microemulsion by IC P-M S 59
Table 8 Figures of merit for trace elements determination using oil in water
emulsion by ETV-ICP-MS...59
Table 9 Comparison of HU-1 Used Oil analytes results prepared with the
proposed methodology and traditional sample preparation methods
with the certified values...62
Table 10 Comparing NIST 1084a Wear-Metals in Lubricating Oil analytes
sample preparation methods with the certified v a lu es... 63
Table 11 Analyte spike recovery in El-Sharara oil sample spiked with 2
and 10 p g L' 1 standards...65
Table 12 The analysis o f the HU-1 Used Oil with the proposed method... 67
Table 13 The analysis o f the NIST 1084a Wear-Metals in Lubricating Oil
with the proposed m ethod... 67
Table 14 Comparison between CRM HU-1 microemulsion results obtained
from calibration with aqueous standard solution and results
obtained from calibration with emulsified standard solution...69
Table 15 Comparison between CRM 1084a microemulsion results obtained
from calibration with aqueous standard solution and results
obtained from calibration with emulsified standard solution...69
Table 16 Mean o f trace elements concentration in emulsified Libyan
crude oil samples in pg g' 1... 71
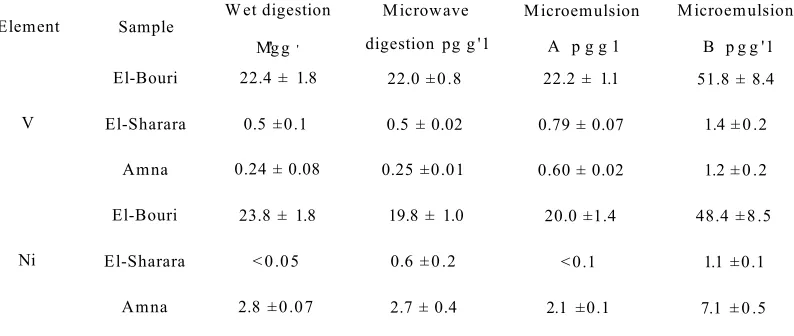
Table 17 Comparison between the mean concentration of nickel and
vanadium in three Libyan crude oil samples prepared with
microemulsion, wet digestion, dry ash and microwave
Chapter 1
1. Introduction
1.1 Occurrences and Importance of Crude Oil and Fractions
Land, sea and air transportation depend almost entirely on products refined from
crude oil. Refineries convert about three quarters of the crude oil into transportation
fuels. Other refined oil products are used to heat homes and buildings, generate
electricity, and in the manufacture of lubricants, waxes, plastics, synthetic rubber
and asphalt.
The crude oil industry provides thousands of jobs in exploration, production,
transportation, refining, distribution and marketing. It also supports a variety of
technological research and development.
The origin of crude oil has been the subject of considerable debate, but it is now
accepted that it is organic in origin and that the raw material was the bodies o f marine
organisms together with water-deposited plant life. Oil was formed from the remains
of those organisms and plants that lived millions of years ago in a marine
environment. Over the years, the remains were covered by layers of mud. Heat and
1.2 Classification of Crude Oil
Crude oils in general are complex mixtures containing different hydrocarbons
associated with very small amounts of nitrogenous substances and variable amounts
of organic sulphur compounds. These hydrocarbons may be paraffinic, olefinic,
naphthenic and aromatic in character [1,2]. Crude oil ranges in consistency from
water to tar like solids, and in colour from clear to black. An “average” crude oil
contains about 83.9 % -86.8 % carbon, 11 % - 14 % hydrogen, 0.06 % - 8.0 % sulfur,
0.02 % - 1.7 % nitrogen, 0.08 % -1.82 % oxygen, 0.00 % - 0.14 % metals, and salts
[1].
Relatively simple crude oil assays are used to classify crude oils as paraffinic,
naphthenic, aromatic or mixed. One assay method (United States Bureau of Mines) is
based on distillation, and another method (UOP “k” factor) is based on specific
gravity and boiling points [1]. Crude oils are also defined in terms o f API (American
Petroleum Institute) gravity. The higher API gravity is, the lower the specific gravity
and hence the lighter the crude. The heavier crude oil contains more sulphur which
makes it more difficult and expensive to turn it into usable refined products. Crude
oils that contain appreciable quantities of hydrogen sulphide or other reactive sulphur
compounds are called “sour”. Those with less sulphur are called “sweet”.
The viscosity of crude oils varies greatly even with oils from the same district. It
increases with rise of specific gravity; the higher value for both being dependent
mainly upon the presence of heavier hydrocarbons, but no connection can be traced
between viscosity and specific gravity, oils of the same specific gravity varying
and a rise of a few degrees will often cause a sluggish oil to flow freely. The pour
point of an oil is the lowest temperature at which it will pour or flow readily.
Density is one of the principle physical properties in classifying crude oils and it is
defined as the mass per unit volume. Crude oil density is temperature-dependant,
decreasing as temperature rises. Generally, paraffinic hydrocarbons have low
densities, naphthenic, and olefinic hydrocarbons intermediate densities, and aromatic
hydrocarbons high densities. The densities of crude oils generally lie in the range 0.79
to 0.95 g/cm3 [1].
1.3 Chemical Composition of Oil
1.3.1 Hydrocarbons
Crude oil is a mixture of hydrocarbon molecules, containing between 1 to 60 carbon
atoms. The properties of the hydrocarbons depend on the number and arrangement of
the carbon and hydrogen atoms in the molecules. Hydrocarbons containing up to four
carbon atoms are usually gases, those with 5 to 19 carbon atoms are usually liquids,
and those with 20 or more are solids. The refining process uses chemicals, catalysts,
heat, and pressure to separate and combine the basic types of hydrocarbon molecules
naturally found in crude oil into groups of similar molecules. The refining process
also rearranges their structures and bonding patterns into different hydrocarbon
molecules and compounds. Therefore it is the type of hydrocarbon (paraffinic,
naphthenic, or aromatic) rather than its specific chemical compounds that is
1.3.2 N onhydrocarbons
Crude oils contain considerable amount of organic compounds with structures
incorporating one or more atoms of sulphur, nitrogen, or oxygen in addition to carbon
and hydrogen; and some of these are associated with metals such as vanadium and
nickel. Crude oil may also contain relatively minor amounts of suspended inorganic
salts (mainly chlorides) and of dissolved elemental sulphur and hydrogen sulphide.
1.3.2.1 Sulphur Compounds
Sulphur may be present in crude oil as hydrogen sulphide (H2S), as compounds (e.g.
sulphides, mercaptans, disulphides, thiophenes, etc.) or as elemental sulphur. Each
crude oil has different amounts and types of sulphur compounds, but as a rule the
proportion, stability, and complexity of the compounds are greater in heavier crude-
oil fractions. Hydrogen sulphide is a primary contributor to corrosion in refinery
processing units. Other corrosive substances are elemental sulphur and mercaptans.
Petroleum products containing sulphur compounds produce undesirables such as
sulphuric acid and sulphur dioxide.
1.3.2.2 Oxygen Com pounds
Oxygen compounds such as phenols, ketones, and carboxylic acids occur in crude
oils in varying amounts. The total amount of combined oxygen in crude oils is
relatively low, ranging from traces to 2 % by weight [1]. Oxygen mainly exists in the
form of carboxylic acid in the low and medium boiling range distillate fractions. For
this reason, and instead of determining the total oxygen content, the determination of
the acidity o f the fraction becomes most significant. Consequently, paraffinic crudes
Romanian, Venezuelan, Californian contain considerable amounts of acids ranging
from 0.6 to 1.0 % by weight or higher [1].
1.3.2.3 Nitrogen Compounds
Organonitrogen compounds are present in traces in the lighter fraction of crude oil;
their concentration increases with increasing boiling point and reaches a maximum in
asphaltic distillation residues. They are relatively stable towards heat and do not
decompose under refinery conditions, so their presence causes problems.
Metalloporphyrins are the most important organonitrogen compounds in crude oils.
Nickel and vanadium porphyrins are commonly the most abundant in crude oil and
used as geochemical biomarkers because they are fairly ubiquitous in nature. At the
same time, they cause problems for they poison catalysts used in refinery processes.
Nitrogen oxides are formed in process furnaces. The decomposition of nitrogen
compounds in catalytic cracking and hydrocracking processes forms ammonia and
cyanides that can cause corrosion.
1.3.2.4 Salts
Crude oils often contain inorganic salts such as sodium, magnesium and calcium
chloride in suspension or dissolved in entrained water (brine). These salts must be
removed or neutralized before processing to prevent catalyst poisoning, equipment
corrosion, and fouling. Salt corrosion is caused by the hydrolysis of some metal
chlorides to hydrogen chloride (HCI) and the subsequent formation o f hydrochloric
acid when the crude is heated. Hydrogen chloride may also combine with ammonia to
1.3.2.5 Carbon Dioxide
The decomposition o f bicarbonates present in or added to crude oils, or from the
steam used in the distillation process, produces carbon dioxide.
1.3.2.6 Trace Metals
Numerous trace elements have been detected in crude oils besides nitrogen, oxygen
and sulphur. O f the many metals listed (arsenic, barium, calcium, chromium, copper,
iron, lead, magnesium, manganese, nickel, silver, titanium, vanadium,... etc. ), nickel
and vanadium are the most abundant. Their concentrations depend on the source of
the crude oil and can range between < 1 pg g’1 to more than 1300 pg g"1.
They have been used as biomarkers to provide information on the depositional
environment of the source rocks, determine the type o f organic source material,
estimate sediment or oil maturity, or to correlate crude oils with other oils or potential
source rocks [3]. The chemical identity of these geological markers known as
petroporphyrins, varies between sources depending upon the biological conditions
inherent to each site. Vanadium / Nickel ratios do not change with the biodegradation
or weathering of an oil seep [4,5] therefore each oil contains unique petroporphyrins
(fingerprint) which link the sample to its geographic origins. Consequently, oils from
different origins can be easily distinguished. The stability of these compounds
enables matching oil spills to their sources even years after the spill occurred [6].
Nickel and vanadyl porphyrin concentrations vary depending on the source o f the
crude oil. It is indicated that vanadyl porphyrins are commonly more abundant in
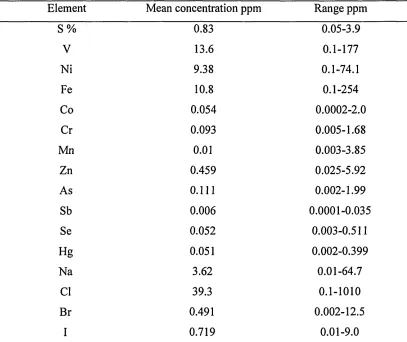
Table 1 shows the variation in trace element concentrations even among oils from the
same basin. West Canada basin was chosen to demonstrate the mean concentration of
[image:24.616.87.494.266.608.2]elements in one basin [3].
Table 1. The mean concentration of some trace elements of West Canada basin with
their ranges in ppm [3].
Element Mean concentration ppm Range ppm
S % 0.83 0.05-3.9
V 13.6 0.1-177
Ni 9.38 0.1-74.1
Fe 10.8 0.1-254
Co 0.054 0.0 0 0 2-2 .0
Cr 0.093 0.005-1.68
Mn 0.01 0.003-3.85
Zn 0.459 0.025-5.92
As 0.111 0.002-1.99
Sb 0.006 0.0001-0.035
Se 0.052 0.003-0.511
Hg 0.051 0.002-0.399
Na 3.62 0.01-64.7
Cl 39.3 0.1-1010
Br 0.491 0.002-12.5
1.4 Petroleum Refining Operations
Petroleum refining begins with the distillation, or fractionation, of crude oils into
separate hydrocarbon groups. The resultant products are directly related to the
characteristics of the crude oil processed. Most distillation products are further
converted into more usable products by changing the size and structure of the
hydrocarbon molecules through cracking, reforming, and other conversion processes.
These converted products are then subjected to various treatment and separation
processes such as extraction, hydro treating, and sweetening to remove undesirable
constituents (e.g. sulphur, hydrogen sulphide, ammonia) and improve product quality.
Figure 1 shows the distillation units at the Azzawiya oil refinery.
Figure. 1 Distillation Units at the Azzawiya oil refinery [8]
1.4.1 Refining O perations. Petroleum refining processes can be separated into
four basic areas:
1.4.1.1 Fractionation (distillation): Crude oil is separated in atmospheric and
vacuum distillation towers into groups of hydrocarbon compounds of
Ci to C.j gases
tractions decreasing in density an0
boding point
liquefied petroleum gas
chemicals
fractions m cr«sif|Q in density and oo ‘mg point
petrol for vehicles column to Cg naphtha f l
h
Cr, to C m petrol(gasoline
Cjq t o C ^ kerojme
I paraffin oil!
l! |
cu wc20
diesel oils p H L T L
crude oil
C2 0 t0 C5Q
uoricatinq oi
j-JlLTL
p r u m ^ C20fuel o10 C70
600* C
residue
jet fuel, paraffin for lighting and heating
d ese: fitels
[image:26.612.83.445.85.536.2]oils, waxes, polishes fuels for ships. factories and central heating bitumen for roads and roofino
Figure. 2 Diagram showing the fractional distillation process and the refinery
1.4.1.2 Conversion processes change the size and /or structure of
hydrocarbon molecules. These processes include:
• Decomposition (dividing) by thermal and catalytic cracking
to augment the yield of gasoline.
• Unification (combining) through alkylation and
polymerization such as the use o f polymerization of olefins
which is effective in the production of iso-paraffins of high
knock-rating by which the gasoline is characterized.
• A lteration (rearranging) with isomerization and catalytic
reforming that converting straight chains to branches such
as converting butane or pentane to isobutane or isopentane.
1.4.1.3 Treatm ent. This process prepares the hydrocarbon stream for
additional processing and to prepare finished product. It includes the
removal or separation of aromatics and naphthenes as well as
impurities and undesirable contaminants such as H2O, salts and
sulphur compounds.
1.4.1.4 Form ulating and Blending. In this process hydrocarbon fractions,
additives, and other components are mixed and combined to produce
finished products.
1.4.2 M ajor Refinery Products
The major refinery products are liquified petroleum gas (LPG), gasoline, kerosene,
1.5 Elemental Determinations by Atomic Spectrometry •
Information on trace element concentrations in crude oil is very important for the
geochemical characterization of source rocks and basins and for corrective actions
during oil production and refining (e.g. prevention of scale formation and catalyst
poisoning, corrosion and pollution control) [3,10,11].
Trace metals occur in crude oil partly as organometallic compounds from which the
geoporphyrins o f V, Ni, Cu, and Zn have been identified [12-15]. Iron, Sr and Mn
contamination could have entered the oil during migration or as pollutants during oil
extraction. The elements Mo and Cr are of biological origin [13].
There are three major types of spectrometric methods for identifying the elements
present in samples of matter and determining their concentrations; optical
spectrometry, mass spectrometry, and X-ray spectrometry [16].
Atomic spectrometric techniques have been used to determine trace elements, among
which are flame atomic absorption spectrometry (FAAS), electrothermal atomization
in graphite furnace (ETAAS), inductively coupled plasma-optical emission
spectrometry (ICP-OES) and inductively coupled plasma-mass spectrometry (ICP-
MS). FAAS is a well established and accessible technique, less prone to spectral
interferences in comparison to ICP-OES and ICP-MS, however, the detection limit is
still poor for a series of elements for many applications in crude oil such as As, Sb,
Se, Hg and Sn [11,17]. Electrothermal atomization in a graphite furnace (ETAAS)
and Vapor generation techniques (VG) overcome the sensitivity limitations o f FAAS.
Amorim et al. [18] reported that oil samples might be analyzed directly by ETAAS if
avoided.
The behaviour of various organic solvents and analytes in ETAAS has been studied
by Tserovesky and Arpadjan [19] who found that a high charring temperature is
necessary to reduce the nonspecific absorbance. For the influence o f the complexing
agent, they reported it is insignificant while the effect of the nature of the solvent is
more pronounced for toluene and xylene in comparison with IBMK and BA.
A Perkin-Elmer HGA-700 graphite furnace was used, with tungsten impregnated
graphite tube and using Pd as the chemical modifier in the organic medium.
Analyzing crude oil directly using little or no sample preparation is most suitable for
graphite furnace atomic absorption spectrometry although the organic sulphur content
in heavy oils may influence the determination of vanadium [2 0].
Compared to AAS, ICP-OES offers a wider linear dynamic range, and several
elements can be determined simultaneously. This property is very important for the
multielement analysis of very small samples [16,18,21]. The high viscosity of
petroleum and many of its derivatives and the flammability o f the lighter fractions
make it very difficult to analyse these samples directly by ICP-OES or ICP-MS
[11,18,21,22]. As a result, the aspiration of organic liquids into the plasma normally
requires additional equipment or sample pretreatment in order to maintain plasma
stability, reduce carbon build up and minimize background interferences.
Electrothermal vaporization (ETV) [18], ultrasonic nebulization (USN) [23] or
introduction of oxygen to the plasma [2 1], have been used when introducing crude oil
or its derivatives to the plasma in order to reduce molecular band emissions and
Despite the spectral interferences and the high cost of ICP-MS, it is considered to be
an attractive technique for the determination of trace element concentrations in
several organic materials in the petroleum industry, because o f its multielement
capability and low detection limits. ICP-MS detection limits are in the sub parts per
billion range [24] and its ability to measure isotopic ratio is of particular importance
[25,26].
Multiple calibration curves are often employed in multielemental techniques such as
ICP-OES and ICP-MS to cover the wide range of metal concentration in crude oils,
from below ng g' 1 to hundreds of pg g' 1 [11]. The standard addition method is
recommended for the complex matrices in order to get reliable results [10,23] and the
use of internal standardization is essentially for instrumental drift correction and also
to account for differences between blanks, calibration standards and samples.
1.6 Sample Pretreatment and Preparation
Sample preparation is the critical step of any analytical protocol, and involves steps
from simple dilution to partial or total digestion. Most methods based on atomic
spectrometric techniques require sample pre-treatment in order to make them
compatible with the employed instrumentation, and also allow easy and efficient
calibration procedures to be used. A variety of procedures have been used that are
Ashing of the crude oil followed by dissolution of the ash in mineral acids has been
used [27]. An investigation of some of the steps involved in the ashing procedures
was studied by Karchmer and Gunn [28] who revealed that unless care is taken, this
method may lead to low results due to the stratification of the sample in the crucible,
and the loss of volatiles such as lead and zinc halides, vanadyl and chromyl
compounds. Although this procedure is still largely employed in industry, it is time
consuming and could be unsafe because of the release of toxic vapours due to the low
flash point o f petroleum.
Alternatively, wet digestion of the oil samples ensures that the organic matrix is
mineralized and the total metal content is converted to simple water soluble species.
Wet digestion procedures for oil samples can be performed in closed or open vessels,
using thermal energy or microwave radiation [29-32]. In the closed vessels, risk of
contamination from airborne particulates is reduced, but in both cases, problems arise
due to trace contamination from used digestion vessels and from the relatively large
volume of mineralizing acids used (especially in the open vessel procedure). The risk
of explosion still remains when using microwave digestion in closed vessels.
Extraction with acids is an applicable procedure but not with heavy petroleum
products containing high levels of asphaltenes, and for volatile gasoline that have
very high vapour pressure [11,29], Acid extraction using ultrasound-assisted
digestion in which crude oil was treated with concentrated nitric acid and heated at 85
°C for 30 min has been proposed. The obtained mixture was placed in an ultrasonic
bath for 15 min and then was aspirated directly into an ICP-OES instrument.
validate the method [21,33].
Dilution o f crude oil with organic solvents {e.g. MIBK, kerosene, xylene, etc) [11,
27,32,34,35] is by far the most studied and used direct introduction technique for ICP
instruments [11,36], because it reduces sample preparation time, decreases analyte
losses and reduces sample contamination [20]. However, other difficulties arise from
the wide range of densities, viscosities, flammability and the increased care required
for safe disposal. In addition, the increased solvent plasma load (SPL) is a critical
problem that has been identified. The solvent load can cause instability and extinction
of the plasma. Furthermore, the background levels due to carbon build-up [11] are
increased necessitating the introduction of oxygen to the plasma to reduce molecular
band emissions and prevent carbon build-up. Desolvation devices such as ultrasonic
nebulizers (USN) [11,21,23] have been used to reduce the amount of solvent
introduced into the plasma.
A multi-element optimization of the operating parameters for simultaneous ICP-OES
with a charge injection device detector for the analysis of samples dissolved in
organic solvents was carried out by Chirinos et al. [37]. They found that the nebulizer
pressure is the factor that must be carefully optimized when using a volatile organic
solvent.
Emulsification of the sample with surfactant agents and water forming oil-in-water
emulsions is an alternative that offers the possibility o f circumventing the problem
identified above. This approach does not require the destruction o f the organic matter
organic content of the sample solution down to 5% w/w. When the oil is evenly
dispersed in the water phase, the sample behaves similarly to an aqueous solution.
1.7 Emulsion
An emulsion is a heterogeneous system of two liquid phases, one of which is
dispersed as microdroplets throughout the other by mechanical agitation [38]. Since
the resulting system has no or little stability, a surfactant is added to make the liquids
more compatible and facilitates the emulsification and often promotes stabilization of
the mixture [39].
Surfactants are usually organic compounds that are amphiphilic. That means; they
contain both hydrophobic and hydrophilic groups. The head is the hydrophilic, water
soluble part whilst the tail is the hydrophobic, water insoluble part . Since they are
soluble in both organic solvents and water, they reduce the surface tension at the
interface between the oil and water molecules and stabilize the emulsion.
The hydrophobic part of the surfactant is a hydrocarbon chain in either aliphatic or
aromatic form or a mixture of both while the hydrophilic part is the part by which the
surfactant is classified as anionic, cationic, nonionic or ampholytic which can behave
as either anionic, cationic or nonionic [40 ]. An example of a surfactant is sodium
dodecylsulphate ( SDS):
CH3-CH2-CH2-CH2-CH2-CH2-CH2-CH2-CH2-CH2-CH2-CH2-S04'Na+
Nonionic surfactants are the most commonly used in oil-in-water microemulsions
because they are compatible with the other types of surfactant and their properties are
little affected by pH.
The amphiphilic nature o f the nonionic surfactant is expressed in terms o f the balance
between the hydrophilic and hydrophobic parts of the molecule (hydrophile-lipophile
balance (HLB) number) and can be used to characterize the affinity o f surfactants for
aqueous and organic phases. A high HLB number generally indicates good surfactant
solubility in water, while a low HLB number indicates a lower aqueous solubility and
higher relative affinity for the organic phase [40].
The water soluble part of nonionic surfactants can be hydroxyl groups or
polyoxyethylene chains. There are polyoxyethylated nonylphenols with a wide range
of oxyethylene chain lengths from 1.5 to 100. Surfactants with low oxyethylene chain
lengths are water insoluble and are water-in-oil emulsifying agents, while longer
oxyethylene chain lengths are water soluble and produce oil-in-water emulsions.
Polyoxyethylated t-octylphenols are available as the Triton-X series which includes
X-114 (E7-8), X-100 (E9-10) and X-102 (E12-13). Surfactants with hydrophile-lipophile
balance (HLB) values between 8 and 18 tend to form oil-in-water emulsions [24,41].
Therefore Triton X-100 (HLB = 13.5) has been successfully employed in the
formation of emulsions in petroleum oils. Figure 3 shows surfactants surround water
droplets and the polar-hydrophilic end is in the aqueous phase while the hydrophobic
Surfactant
polar end
hydrophobic end
particulates
Figure. 3 Schematic for a water-in-oil emulsions. It shows a water droplet dispersed
in oil with the hydrophilic end of the surfactant in the aqueous phase while the
[image:35.617.133.426.82.513.2]In the early eighties, Polo-Dies et a l [43] proposed a method for the determination of
lead in gasoline by FAAS using an emulsion. They recommended mixing 1ml of
gasoline with 20 ml of water and 5 drops of emulsifier with HLB 13.5 and shaking
vigorously to form an emulsion which was then introduced directly into the flame.
The results showed the applicability of the procedure and the sensitivity of the
absorption signals was about 15 times higher than those from aqueous solutions. De
la Guardia and Sanches [44] reported a method for the determination of manganese in
gasoline by FAAS using an emulsion in which 10 ml of the sample was mixed with a
sufficient amount o f (1:1) B^.CCU solution. After evaporation of the excess amount
of bromine, 4ml of emulsogen and a small amount of water were added with stirring
until a clear solution was obtained. This method gave good results when compared
with a colorimetric method. However, care had to be taken because the reaction was
exothermic. V, Ni, Fe, Mg and Na determination was investigated by Platteau and
Carrillo [45] using FAAS. Highly stable crude oil emulsions were prepared by mixing
3g of homogenized crude oil, 15 ml of ethyl alcohol and 0.3g of linear alkylbenzene
sulfonic acid (10 wt%). The homogenized mixture then was subject to a dry ashing
procedure (ignition, burning in muffle furnace at 550 ± 5°C, dissolving the ash with
acids). The method was shown to be reliable and accurate but at the same time it was
time consuming. In addition, changes in V and Na signals due to the ionization effect
for V in a nitrous oxide-acetylene flame and for Na in the air-acetylene flame
required the addition of ionization suppressants. For Na, 2000 mg L' 1 K was added to
Aucelio and Curtius [17] determined the concentrations of As, Se and Sb in gasoline
and kerosene by ETAAS using two sample preparation procedures. The first
procedure involved the formation of a detergentless microemulsion by mixing an
appropriate amount of the sample with water and propan-l-ol; (10:25:65) v/v/v for
gasoline and (10:15:75) v/v/v for kerosene and 1 ml of concentrated nitric acid in a 10
ml volumetric flask. In the second procedure, a surfactant microemulsion was
prepared in which 10 % of the sample was mixed with lm L concentrated nitric acid
and the mixture was sonicated for 5 min, then 4% v/v non-ionic surfactant (Triton X-
100) was added. Mechanical agitation was used in both procedures. The preparation
of oil samples as surfactant microemulsions were found to be the most appropriate,
although they were stable for only 10 min. However, direct correlation between
analyte signals in the sample and in an aqueous standard were found to be
satisfactory.
Silva et a l [46] described a method for the determination o f lead and copper in
kerosene by ETAAS. A three- component solution was prepared from kerosene,
propan-l-ol and 0.2 % nitric acid (5:11:2 ml respectively). This three component
solution provided adequate stability (24 h) which made it possible to determine both
elements in the presence of Pd as modifier. Burguera et a l [47] developed a
procedure to form an on-line emulsification of lubricating oils to determine chromium
by a flow injection system and ETAAS. The surfactant used for this study was
sodium dodecylsulphate (SDS) with an HBL of 40.0 and hexane as co-solvent. It was
considered that the addition of any modifier would bring no further advantage. The
Aucelio and Curtius [32] described the determination of silver by ETAAS in used
lubricating oils. In a 10 ml volumetric flask, 0.2 g of the sample and 0.5 ml
concentrated HNO3 were mixed and sonicated for 5 min. A volume of 0.5 ml of
xylene was added with 0.4 ml of Triton X-100. Water was added dropwise with
continual agitation. In this study, a comparison was made of the three methods;
dilution with organic solvent, acid digestion and the formation o f emulsion. The latter
was found to be the most effective, although it was stable for only 30 min. The same
authors with Welz [48] applied the previous procedure to determine Sb and Sn in
used lubricating oil by ETAAS with aqueous calibration. The accuracy and
repeatability of the method was verified by using two standard reference materials
(SRM 1084a and SRM 1085a). Ru was used as a modifier for both elements and
results showed good correlation between absorbance signals for spiked emulsions and
aqueous standards.
A three component system (gasoline-ethanol-water) was prepared by Ozcan and
Akman [49] to determine Cu, Co and Pb in gasoline by ETAAS using an aqueous
standard addition method. 1 ml of gasoline was mixed with 2.5 ml of water and 0.5
ml of concentrated HNO3 followed by the addition of standard solution then
completion to 10 ml with 96% ethanol. It was reported that the addition of nitric acid
to the three component system is required in order to attain accurate determination of
the analytes. Results were verified by microwave digestion using HN0 3, where it was
found that there was no significant difference between the two methods. Matos Reyes
and Campos [50] developed a method for the determination of Ni and Pb in diesel
absorption spectrometry. Long term sample stabilization was obtained by mixing 3.3
ml of the sample with 6.5 ml propan-l-ol and 0.1 ml of 50 % v/v HNO3. A
transparent microemulsion was attained which was stable for more than 15 days.
Aqueous modifiers such as Pd and Mg showed good performance for Pb
measurement.
The determination of trace metals in lubricating oils using atomic spectrometric
techniques has been reviewed by Aucelio et a l [51] highlighting problems related to
sample pretreatment and calibration, as well as strategies to overcome them.
Aluminum was determined by Burguera et a l [52] in lubricating oils emulsified in
a sequential injection analysis system by ETAAS. 0.5 ml of the sample was mixed
with 1 ml of sec-butanol solution and 1 ml of the surfactant mixture then they were
subjected to 5 sequences during which standard addition was used in order to study
the matrix interference on the aluminum absorbance. No significant difference was
found when compared with that obtained from a single calibration curve.
Inductively coupled plasma optical emission spectrometry has been used successfully
for the determination of trace elements in crude oil and its derivatives. ICP-OES was
used by Souza et a l [53] for the determination of Ni, Mo, Cr, V, and Ti in used
lubricating oil. 0.2 ml of sample was acidified using 0.5 ml concentrated HNO3 then
emulsified by adding 0.5 ml xylene as co-solvent and 0.6 ml Triton X-100 as
surfactant. An inorganic standard was used for calibration and three different certified
lubricating oils were analyzed. Although the emulsion was stable for only 40 min,
good accuracy was achieved for Ni, Mo, V and Ti while for Cr the recovery was
[53,55,56].
A procedure to prepare crude oil samples as detergentless microemulsions to
determine Mo, Zn, Cd, Ti, Ni, V, Fe, Mn, Cr and Co by ICP-OES was demonstrated
by Souza et al. [54]. The composition of the microemulsions was 0.6 g of crude oil
(previously dissolved in 0.5 ml of xylene) mixed with 0.4 ml of concentrated nitric
acid. Then propan-l-ol and water were added in an alternate way (1.1 ml of propan-l-
ol followed by 0.25 ml o f water) until a final mass o f 10 g was attained. Oxygen was
used in the nebulizer gas flow in order to minimize carbon building up and
background. Standard reference material (SRM 1634c) was used to verify the
accuracy of the method and the recoveries were between 97.9% and 103.8%. Souza et
al. [55] also compared two sample emulsification procedures (Triton X-100 emulsion
and detergentless emulsions) for the determination of Mo, Cr, V and Ti in diesel and
fuel oil by ICP-OES. For detergentless emulsions, 2.5 g of the sample was acidified
with 0.5 ml of concentrated nitric acid and mixed with 6 ml o f propan-l-ol. Water
was used as a complement of these compositions. For detergent emulsion, 1.5 g of the
sample previously dissolved in xylene was placed in a 10 ml volumetric flask with
0.5 ml of concentrated nitric acid. The mixture was placed in an ultrasonic path for 5
min, then 0.3 ml of Triton X-100 was added followed by water. The whole
compositions were sonicated for 5 min after vigorous shaking for 2 min. In the two
cases (Triton X-100 emulsion and detergentless emulsions), milky homogeneous
emulsions were achieved which separated shortly into two phases that could be
readily reconstituted after manual shaking. Good recoveries and better results were
detection at the ng g' 1 level. Oxygen was used as auxiliary gas flow to minimize
carbon buildup and plasma background.
Not only crude oil and its derivatives were studied using the emulsification procedure
but vegetable oils, margarine and butter were investigated as well by Souza et al.
[56]. ICP-OES was used for determination of six elements (Cd, Co, Cr, Cu, Ni and
Mn) in olive oil, soy oil, margarine and butter which were prepared using two
procedures (detergent and detergentless emulsions). In order to prepare detergent
emulsions in a 10 ml volumetric flask, 0.2 g of the sample, 0.5 ml of concentrated
HNO3 with an amount between 0.1 and 2 g of Triton X-100 were added. It was
reported that the Triton X-100 emulsion for soy and olive oils gave very short
stabilities (less than 3 min). While for margarine and butter, even when the samples
were previously dissolved in 0.5 ml of xylene, Triton X-100 emulsions were not
formed. The second procedure described by Souza involved the formation of
detergentless emulsions by weighing an amount between 0.1 and 1 g of the sample
into a 10 ml volumetric flask with 7 g of propan-l-ol and 0.5 ml of HNO3. Margarine
and butter were dissolved in 0.5 ml of xylene before any addition. After vigorous
shaking the emulsions remained stable for a few hours. Good sensitivities with limits
of detection in the ng g' 1 range were achieved for the detergentless emulsions.
As some elements are found in the oil at very low concentration levels, inductively
coupled plasma mass spectrometry could be a remarkable alternative, because of its
high sensitivity and simultaneous detection that can be carried out easily and rapidly.
A new approach for introducing crude oil directly into ICP-MS by forming a
0.5 g of crude oil with an equivalent amount of tetralin were weighed in a tared 60-ml
glass bottle and the contents were mixed until a homogeneous mixture was achieved.
Then 1 g of Triton X-100 was added and the mixture was mechanically agitated until
reaching homogeneity. De-ionized water was added gradually with continual
agitation until a final mass of 50 g was attained. The author reported the formation of
a very stable emulsion with no phase separation even after several months of storage.
Accuracy was verified by analyzing two standard reference materials (NBS 1634b
and NBS 1085), and the results obtained were in good agreement with the certified
values.
Al-Swaidan [10] provided a new automated technique for trace elements analysis by
sequential injection analysis / inductively coupled plasma-mass spectrometry using an
emulsion of crude oil. 0.5 g of oil was mixed with 1.5 ml of tetralin, 0.5 ml of Triton
X-100 and 5 ml of 40 % nitric acid with graduate addition o f water until 50 ml of
homogenized solution was obtained. The sequential injection system easily
introduces the samples to the ICP-MS. This technique enabled good results for Pb
and Ni, while low concentration for V was obtained due to its background.
Al-Swaidan [57] also studied the determination of vanadium and nickel in some
Saudi Arabian crude oils and petroleum products (aviation turbine oil, gasoline and
diesel fuel oil) by ICP-MS using the previous technique described by Lord [24] and
the concentrations were measured using a standard addition method. Reasonable
detection limits were obtained and the recoveries of added metals were between 98 -
This technique was successfully applied on light fractions of crude oil as well. V, Co,
Ni, As, Hg and Pb were determined in naphtha by ICP-MS using Triton X-100 to
form an emulsion without the addition of a co-solvent. Kumar and Gangadharan [22]
mixed 2 ml o f naphtha with 1ml of 2.5 % solution o f Triton X-100 in a capped 5 ml
container, with stirring with a magnetic stirrer for 20 min. Immediately after
emulsification the solution was introduced into the ICP-MS. The recovery for Ni and
Pb was close to the added value, for V was 60% and almost no recovery was attained
for Hg and As when adding aqueous standard solutions to the emulsion. They
recommended not to use an aqueous standard for calibration for analyzing emulsified
naphtha. Saint’Pierre et al. [38] treated gasoline with concentrated HNO3 and Triton
X-100 to form an emulsion to determine Cu, Mn, Ni, and Sn by electrothermal
vaporization ETV ICP-MS. They used the procedure described by Aucelio and
Curtius [17]. They reported that this emulsion was stable for only few minutes and
they recommended pre-concentrating the emulsion by repeated pipetting and drying.
Gasoline was emulsified using tetralin and Triton X-100 by Heilmann et al. [58] to
determine sulphur by Isotope Dilution ICP-MS. They used the procedure described
by Lord [24] and they reported that the use o f transparent microemulsions is a
necessary precondition for precise and accurate sulphur analysis in gasoline and
related fuel samples. A satisfactory accuracy was obtained by analyzing two different
certified gas oil reference materials using the proposed procedure and comparing the
recovery with those obtained by microwave assisted digestion.
Castillo et al. [59] described a simple method for a semiquantitative simultaneous
ICP-MS. Approximately 2 g of oil was mixed with 1.5 ml of Triton X-100 and
stirred mechanically and the homogenized mixture had a final weight of 50 g. In
order to get a stable emulsion, the addition of HNO3 was not recommended. Results
from spike and recovery experiments at the level of 100 and 200 ng mL"1 were 93 -
136 % for all elements (Ba, Cd, Co, Cr, Cu, Ge, Mn, Ni, TI, Pb, U and V) except for
Zr which was found to range between 73.8 - 76.2 % . The detection limits were
found to be suitable for very low concentrations of metals in olive oil.
1.8 Inductively Coupled Plasm a-M ass Spectrom etry (ICP-MS)
ICP-MS is a fast, precise and accurate multi-element analytical technique for the
simultaneous determination of trace elements in liquid and solid samples. Nearly all
the elements in the periodic table can be analyzed by ICP-MS. The analytical range
extends from ppt (pg g"1) to ppm (pg g’1). ICP-MS consists of the following
components:
sample introduction system, excitation source, ion transport system, mass separation
device, detector and data processing (Figure 4).
Sample Introduction and Aerosol
Generation
Mass discriminator and Detector
Ionization by Argon Plasma
Data Analysis
n
The samples are introduced into the plasma in the form of an aerosol by a nebulizer.
There are a variety of nebulizers that can be used to produce such sample aerosols
and the one used in this study was the Babington nebulizer. The nebulizer is
connected to a spray chamber by which larger aerosol droplets are removed from the
gas stream and the remaining smaller droplets are passed into the central channel of
the argon plasma (Figure 5).
Sample solution
Ar carrier gas
Nebulizer (high solids type)
Small droplets to ICP
Aerosol
Sample drain
Large droplets to waste
The plasma is generated in a quartz torch, which consists of three concentric quartz
tubes. The outer quartz tube introduces the auxiliary gas flow to the inner annular
space. A flow of Ar gas carries the sample aerosol to the plasma through the central
tube. The plasma is generated by applying a spark from a Tesla coil on the argon gas
passing through the central tube of the quartz torch. The spark generates free
electrons and ions which are coupled to the magnetic field formed as a result of the
radio frequency current passing through the cooled copper coil placed around the
torch (Figure 6). Temperatures in the plasma range from 6000 to 10,000 K. Once the
aerosol droplets are introduced to the high temperature plasma, they are vaporized,
atomized, then ionized [62].
rapid oscillation o f / electrons -> HEAT (
Radio frequency voltage induces oscillation of Ar ions and
-1 0 ,0 0 0 K)
Plasma gas
Quartz "torch" made of concentric tubes
Auxiliary or coolant gas Carrier or injector or nebulizer gas
RF load coil
Sample aerosol is carried through center of plasma -> dried, dissociated, atomized, ionized -6 5 0 0 K.
The produced ions are transferred to the mass spectrometer by an ion transport system
that consists of the interface region and the ion lens system that perform the
separation of the ions from the photons and residual neutral material. The ions in the
centre of the plasma are sampled into the quadrupole mass spectrometer through the
interface region that consists of two successive Ni cones with 1mm diameter. The
first extraction of the ions is through the orifice of the sample cone into the region
between the two cones where the pressure is about 1-3 torr by rotary vacuum pump.
Further extraction for the ion beam is through the orifice of the skimmer cone into the
ion lens system in the front part of the mass spectrometer where the pressure is about
(10° - 10'4 torr) by turbo molecular vacuum pump. The positively charged ion lens
extracts the positive ions from a matrix of neutral species and focuses the ion beam
into the mass spectrometer (Figure 7).
Skimr cone
Figure. 7 Schematic of an ICP-MS sampling and skimmer cones with the extraction
The most commonly used mass separation device in ICP-MS is a quadrupole mass
spectrometer which acts as a mass filter that separates ions according to their
mass/charge ratio. The separated ions pass through the mass spectrometer to the
detector to be measured. Ion signals are measured with an electron multiplier, which
has its inside walls covered with a metal oxide. A negative voltage is applied to the
multiplier to attract the positive ions. When the ions get in contact with the metal
oxide wall they eject further electrons. These secondary electrons, which are
accelerated down the tube by the potential gradient, hit another section of the coating
and more secondary electrons are emitted. This process is repeated many times, so
that in the end one ion collision leads to about 108 electrons. The multiplier can be
operated in the pulse count or in the analogue mode depending on the concentration
of the analytes being measured. In the pulse count mode the negative voltage applied
is higher and more secondary electrons are produced. The electrons are detected as a
single pulse. This mode is used for concentrations ranging from the detection limit up
to 1 mg L '1. The analogue mode (one ion collision leads to about 104 electrons) is
suitable for concentrations between 1 and 100 mg L’1. In this mode the multiplier
does not become saturated. The ion intensity is converted to a pulse counting signal.
The signal is measured as a current which is subsequently converted into counts per
1.8.1 Instrument Optimization and Tuning
The stability o f the signal intensity provided by ICP-MS instruments depends on the
plasma operating conditions. Instrument optimization involves maximizing the
signal-to-noise ratio (usually for the middle of the mass range isotope such as 103Rh)
by finding the optimal nebulizer gas flow rate, ion lens voltages and RF power. At the
same time, care must be taken to minimize the production of doubly charged ions
(increases with decreasing nebulizer gas flow and also depends on the position of the
plasma relative to the interface cones) and of molecular ions such as oxides
(decreases with decreasing nebulizer gas flow and also depends on the position of the
plasma relative to the interface cones).
1.8.2 Interferences
A few interferences do occur in ICP-MS, but these are generally predictable and can
often be corrected for or may be minimized by optimizing instrument operating
conditions. Three types of interferences can occur in ICP-MS measurements:
1.8.2.1 Isobaric Interferences
co co 9 f.A #
They occur for equal mass isotopes of different elements (e.g. Fe on Ni Ni on
64Zn 48Ca on 48Ti) and these are best avoided by choosing alternative isotopes.
1.8.2.2 Molecular (or Polyatomic) Interferences
They occur due to the recombination of sample and matrix ions with Ar or other
matrix components (e.g. O, N, C l,...etc) in the cooler region of the plasma.
(e.g. 40A rl6O on 56Fe 47Ti160 on 63Cu 40Ar35Cl on 75As 40Ar2o n80Se)
They can be avoided using alternative analyte isotopes or by applying correction
eliminated by using more appropriate sample introduction systems such as ultrasonic
nebulization (USN) and electrothermal vaporization (ETV) or optimizing instrument
operating conditions.
1.8.2.3 Doubly- Charged Ion Interferences
They occur due to relatively rare doubly-charged matrix or sample ions with twice the
mass of the analyte and hence the same mass/charge ratio (e.g. 90Zr++ on 45Sc+). It can
generally be minimized by optimizing instrument operating conditions.
The volatile compounds are enriched in the aerosol/vapor stream that enters the
plasma, due to their higher vapor pressure. The presence of those volatile organic
compounds in a crude oil sample will cause signal enhancement thus increasing the
polyatomic ion background [24]. The determination of some elements such as V, Cr
and Fe by ICP-MS is known to suffer from the polyatomic isobaric interferences on
51V caused by 34S 16OH+, on 56Fe caused by 40Ar 160 + and on 52Cr caused by
40A r12C+and 35C1160 + [63]. The deposited carbon on the cooler surfaces of the sample
skimmer cone and ion lenses of ICP-MS, affects the transport efficiencies o f ions and
also carbon-argon species cause polyatomic interferences, which affect the
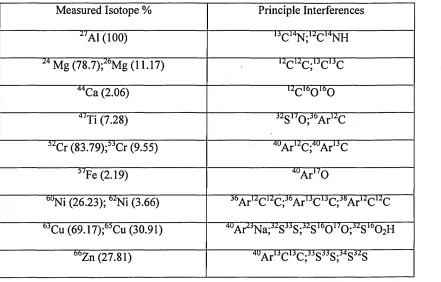
determination of Mg, Cr and some other elements [23,64,65]. Table 2 depicts some
important interferences in quadropole ICP-MS that are expected from organic crude
Table 2. Interferences from organic crude oil that may occur in quadrupole ICP-MS.
Isotopic abundances quoted in brackets [23]
Measured Isotope % Principle Interferences
“ Al (100) u C ‘4N ;“ C ,4NH
Mg (78.7);2<>Mg (11.17) “ C “ C ;UC 'JC
44Ca (2.06) “ C160 l60
4/Ti (7.28) “ S,/0 ;3(>A r“ C
“ Cr (83.79);“ Cr (9.55) 4UA r“ C;4UA r,4C
“ Fe (2.19) 4UA r,/0
0UNi (26.23); “ Ni (3.66) Jt,A r“ C “ C;J0A r,3C13C;J5A r“ Cu C
6JC u(69.17);"C u (30.91) 4UA r^N a;“ S33S;“ S‘0O l/O;“ S 't,O2H
00Zn (27.81) 4UA r'3C '3C;33S33S;34S33S
1.8.3. M atrix Effects
Clogging of the orifices in either or both of the interface cones may be a problem
when samples with high total dissolved solid (TDS) contents or oil samples are
analyzed. The problem may be overcome by sample dilution or using an
alternative sample introduction system (e.g. Ultrasonic nebulizer with a
1.9 Reliable Measurements
1.9.1 Method Validation
Method Validation is the process of proving that an analytical method is acceptable
for its anticipated purpose and it has a direct impact on the quality of the analytical
data. In general, methods for regulatory submission most include studies on
specificity, linearity, accuracy, precision, detection limit and quantification limit.
1.9.1.1 Specificity & selectivity
It is the ability of the method to accurately measure the analyte response in the
presence of all potential sample components [6 6]. Therefore, in order to select a
method for a particular analysis, we should take into consideration its ability to give
accurate and precise results free of interferences and matrix effects especially in
crude oil samples that contain high levels of organic compounds. For example, when
selecting a method to analyze crude oil samples, there are some important points that
should be focused on, such as: the volatiles content o f the crude that may be lost
during some steps in sample preparation techniques, the stability of the analytes of
interest in the specimen solution and choosing the right technique that is most suitable
to measure the concentration of the analytes in the sample accurately, precisely and
with no interferences.
1.9.1.2 Accuracy or Bias
It is the closeness of the measured value to the true value for the sample. Accuracy is
usually determined in one of four ways. First, accuracy can be assessed by analyzing
a CRM and comparing the obtained result to the certified value. The second approach
method. The third approach is a recovery study, which is performed by spiking
analyte in blank matrices. The fourth approach is the standard addition technique,
which can also be used to determine the recovery of spiked analyte
1.9.1.3 Precision
Precision is the closeness of the measured values to each other. An instrument
precision study is performed by analyzing one sample solution 10 times to test the
performance o f the instrument by SD or RSD.
1.9.1.4 Limit of Detection (LOD)
It is the smallest concentration of analyte which can meaningfully be detected. It is
also defined as 3*SD° where SD°is the standard deviation of the blank.
1.9.1.5 Limit of Quantification (LOQ)
It is the lowest amount of analyte in a sample which can be quantitatively determined.
1.10 Characterisation o f Libyan Crude Oils
Giant oil fields were discovered in Libya from 1956 to 1961. Libya started exporting
oil in 1961 and by 1966 it was the 7th largest oil-producing nation in the world. The
extraordinary discoveries in the Sirt basin, where 19 of 21 giant fields were located
with recoverable reserves of 40 billion barrels of oil (bbl) [67], attracted the
international exploration companies all around the world to make further discoveries


![Table 3 Characteristics of Libyan Crude Oils [68,69]](https://thumb-us.123doks.com/thumbv2/123dok_us/760128.581754/55.614.65.503.364.559/table-characteristics-of-libyan-crude-oils.webp)