Analysing splash in competitive diving
DRISCOLL, Heather, GAVIRIA, Samuel and GOODWILL, Simon
<http://orcid.org/0000-0003-0638-911X>
Available from Sheffield Hallam University Research Archive (SHURA) at:
http://shura.shu.ac.uk/8186/
This document is the author deposited version. You are advised to consult the
publisher's version if you wish to cite from it.
Published version
DRISCOLL, Heather, GAVIRIA, Samuel and GOODWILL, Simon (2014). Analysing
splash in competitive diving. Procedia Engineering, 72, 26-31.
Copyright and re-use policy
See
http://shura.shu.ac.uk/information.html
Procedia Engineering 72 ( 2014 ) 26 – 31
1877-7058 © 2014 Elsevier Ltd. This is an open access article under the CC BY-NC-ND license
(http://creativecommons.org/licenses/by-nc-nd/3.0/).
Selection and peer-review under responsibility of the Centre for Sports Engineering Research, Sheffield Hallam University doi: 10.1016/j.proeng.2014.06.008
ScienceDirect
The 2014 Conference of the International Sports Engineering Association
Analysing splash in competitive diving
Heather Driscoll
a*, Samuel Gaviria
aand Simon Goodwill
aaCentre for Sports Engineering Research, Sheffield Hallam University, Collegiate Crescent, Sheffield, S10 2BP, UK
Abstract
Splash size is an important factor in competitive diving and is considered to have a large effect in final judged scores. The aim of this research was to develop a system to determine the splash size during different stages of the dive entry. One diver was recorded during a training session and their dives analysed using the developed system. Three splash metrics were calculated at time of complete entry and maximum splash: (1) width of splash, (2) height of splash and (3) size of splash. Results indicated that there was no relationship between the splash metrics at complete entry and time of maximum splash. This may have implications for the scoring of a dive if the judge is unable to distinguish between these two splash events.
© 2014 The Authors. Published by Elsevier Ltd.
Selection and peer-review under responsibility of the Centre for Sports Engineering Research, Sheffield Hallam University.
Keywords: Diving; Splash; Image Processing
1.Introduction
The judging of sports such as competitive diving can be subjective and subsequently often suffer from unfair results and disappointment for professional athletes (Emerson et al. 2009, McCormick et al. 1982). Although the governing body for diving, Fédération Internationale de Natation (FINA), attempt to minimise the risk of unfairness by ensuring that a minimum of three judges are present, understanding the dive techniques during competition requires high levels of experience. The Diving Official Manual (FINA 2010) recommends that the dive is judged in five components: (1) starting position, (2) approach, (3) take-off, (4) flight and (5) entry. The entry is
* Corresponding author. Tel.: +44 114 225 3987; fax: +44 114 225 4356.
E-mail address: [email protected]
© 2014 Elsevier Ltd. This is an open access article under the CC BY-NC-ND license (http://creativecommons.org/licenses/by-nc-nd/3.0/).
27 Heather Driscoll et al. / Procedia Engineering 72 ( 2014 ) 26 – 31
often given the most emphasis when awarding points for a dive (FINA 2010) and is comprised of factors such as body position, distance from the edge of the springboard and amount of splash.
Splash from diving can be described by three main stages: (1) contact between the diver and the water, (2) from contact until diver is fully submerged (complete entry) and (3) turbulent flow formation following complete entry (Qian et al. 2010). The Diving Official Manual (FINA 2010) highlights that a properly performed dive will result in an entry with minimal splash. However, the judge is further instructed to ignore the diver's movement beneath the surface of the water. As such, it may be concluded that the only splash the judge is instructed to take into consideration is that created from initial contact to the time that the diver's feet are just submerged in the water (splash stages 1 and 2). Splash generated from stage 3 should therefore not be officially judged.
Akin to the hydrodynamic theory of a sphere impacting water (Richardson 1948), an air cavity is created as the diver moves vertically down through the water; stage 3 splash is formed by the surrounding water filling this cavity. Divers are able to minimise this splash by rapidly changing their direction after entry to the water, or by rotating back towards the surface subsequently filling the air cavity with their body. Both these techniques require skill and although may reduce the size of splash after entry, in accordance with the Diving Official Manual (FINA, 2010) should not result in a higher judged score.
Being able to distinguish between the splash at complete entry and the subsequent splash generated by the diver’s movement beneath the water requires skill. The human visual system has been shown to be able to make go/no-go categorisation of an image in 150 ms (Thorpe et al. 1996). The question arises that given more complex visual signals such as a splash, are humans able to identify the splash at complete entry and disassociate it from the splash generated after? In order for this to be investigated, a greater understanding of the splash formed from diving is required.
McCormick et al. (1982) suggested three metrics that could be used to quantify the splash from springboard diving. The metrics the authors advised were: (1) width of splash (or extreme) (2) height of splash and (3) size (or area) of splash (Fig. 1). These metrics were obtained by placing a clear sheet over a monitor displaying a video of the dive and measuring the splash with a tape. Advances in camera equipment and image processing software have the potential to increase the accuracy and efficiency of this type of analysis. For example, a system for identifying splash size was used by the British Broadcasting Corporation (BBC) and National Broadcasting Company (NBC) during the coverage of the 2012 Summer Olympic Games (Red Bee Media Limited, 2012). The splash size was displayed on a dynamic colour bar next to the footage of the diver entering the water; larger splashes were designated red and on the top of the scale, smaller splashes were green and at the lower end of the scale. To date, no peer reviewed work has been published although the system was well received by the broadcasting companies (Dawes 2012).
The aim of this study was to develop a measurement system to quantify the size of splash from time of complete entry to end of splash. Splash metrics suggested by McCormick et al. (1982) were used as the basis for this study (Fig. 1). The relationships between the splash metrics at complete entry and at maximum size were then assessed using video footage from a diving training session.
2.Method
2.1. Experimental set-up
2.2. Image processing
The video footage was converted to individual images allowing post-dive measurement of the splash using the image-processing toolbox provided by MATLAB®. The following method was used to calculate the splash metrics:
User:
1. Selected the image corresponding to time of entry (t1, entry);
2. Identified the point of entry (p1);
3. Selected the image corresponding to the time in which the diver's feet are just underwater (t2, complete entry).
Algorithm:
4. Profile lines were generated, radiating in 10° increments from p1;
5. The red component of the RGB color-space (giving greatest contrast between the blue water and the white splash) was produced along each profile line for the splash image;
6. The same procedure was repeated for a background image in which the water was undisturbed and no divers were in view (t1 – 0.04 s);
7. The difference in the red component from the splash image and background profile lines was calculated; 8. The difference profile was filtered and a distance along the line corresponding to the edge of the splash was
found.
2.3. Splash metrics
Width of splash Height of splash Size of splash
1. The width of splash was calculated by finding the maximum horizontal distance from p1 to the
edge of splash (on a profile line).
2. The height of the splash was calculated by finding the maximum vertical distance from p1 to the
edge of splash (on a profile line).
3. The size of the splash was defined by calculating the area created by the polygon formed by connecting the splash edge point on each profile line.
Fig.1. Splash metrics and method of calculation (figure modified from McCormick et al. 1982).
3.Results
29 Heather Driscoll et al. / Procedia Engineering 72 ( 2014 ) 26 – 31
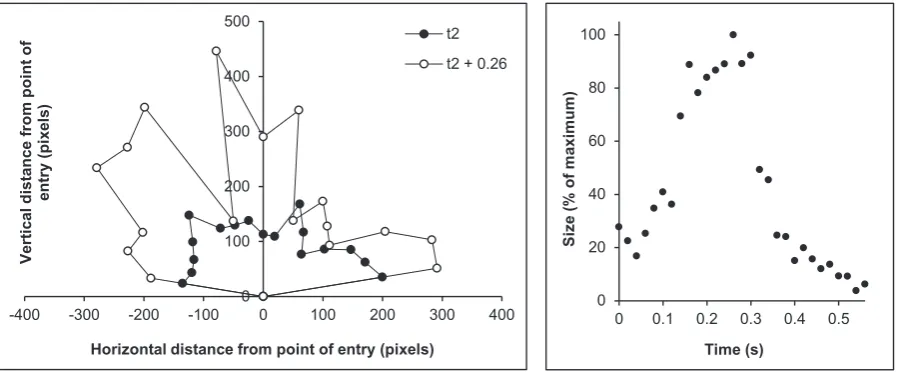
Fig. 3. a) Splash boundary at time of complete entry (t2) and maximum splash (t2 + 0.26 s) relative to point of entry (p1 = 0, 0); b) Size of
splash at 0.02 s increments from t2 to end of splash.
4.Discussion
A semi-automated measurement system has been developed that allows the splash to be quantified from time of complete entry to end of splash. The system calculated the width, height and size of splash using profile lines radiating in 10º increments from the point of entry. Fig. 2 illustrates the elements of splash that are detected by the system. On the far edges of the splash, the water tended to form small droplets (spray), these were often not detected by the system and instead the denser volume of water closer to the point of entry was analysed. Fig. 3a illustrates the difference in shape of the splash at complete entry and at maximum size. The splash had increased in both height and width from time of complete entry and was no longer symmetrical in shape. The splash reached maximum size 0.26 s after complete entry (rate 250 pixels/ms) and returned to a similar size in 0.1 s (rate 650 pixels/ms) (Fig. 3b).
The comparison of the splash metrics for eight dives suggested that the maximum splash was not a reliable indicator for the size of splash at complete entry. Low correlations were seen between all splash metrics for both splash events. The time from complete entry to maximum splash was 0.20 ± 0.04 s, 0.05 s longer than the estimated processing time of the human visual system (Thorpe et al. 1996). Due to the short event time of the splash, it is speculated that a judge will find it difficult to visually process and isolate the size of the splash at complete entry from that which they will subsequently view. The evidence that the splash characteristics change during the duration of the dive highlights a potential concern in the ability of a human to accurately judge a dive in real-time.
4.1. Limitations
The following limitations of the study have been acknowledged:
x The number of profile lines allowed the splash to be discretised into 17 sections; however, reducing the angle between profile lines will allow the splash to be analysed in greater resolution (although increasing processing time) and provide a more accurate measure of splash size.
x Erroneous detection of splash edge by the system was monitored by the user and the threshold manually adjusted to fit the splash; additional logic functions are required to automate this process.
0 100 200 300 400 500
-400 -300 -200 -100 0 100 200 300 400
Ve rt ic al dis ta n ce f rom point of en try (p ixel s)
Horizontal distance from point of entry (pixels) t2
t2 + 0.26
0 20 40 60 80 100
0 0.1 0.2 0.3 0.4 0.5
[image:6.544.47.496.69.255.2]31 Heather Driscoll et al. / Procedia Engineering 72 ( 2014 ) 26 – 31
x The camera view was at a height of 0.3 m from the pool deck generating a perspective error on the view of the splash; the result of this camera view may cause error in the estimated splash metrics although for this study, the variation in point of entry of the diver was minimal.
x Calibration of the camera would enable the splash metrics to be converted to actual measures (m) allowing comparison between different test conditions.
4.2. Future work
To improve the accuracy of the measurement system in detecting the edges of splash, a series of experiments in which a ball is dropped in water in a controlled environment will be undertaken using a high-speed camera to film the impact. Steps will then be taken to develop the image processing algorithms for use in competitive diving environments. It is hoped that the measurement system can then be used to compare the splash metrics with judges’ scores to further the understanding on the role splash plays in competitive diving.
Acknowledgements
The authors would like to thank Mr Adam Sotheran for his assistance in the collection of data for this study.
References
Dawes, R., 2012. Olympic Diving Splashometer [online]. Available from:
http://www.bbc.co.uk/blogs/researchanddevelopment/2012/08/olympic-diving-splashometer.shtml [31 November 2013].
Emerson, J., Seltzer, M., Lin, D., 2009. Assessing judging bias: An example from the 2000 Olympic Games. The American Statistician 63(2), 124–131.
McCormick, J.H., Subbaiah, P., Arnold, H., 1982. A method for identification of some components of judging springboard diving. Research Quarterly for Exercise and Sport 53(4), 313-322.
Qian, J., Zhang, S., Jin H., 2010. Computer simulation of “splash control” and research of the rip entry technique in competitive diving. International Journal of Sport Science and Engineering 4, 165-173.
Red Bee Media Limited, 2012. Splashometer unplugged [online]. Available from: http://www.redbeemedia.com/piero/blog/splashometer-unplugged [31 November 2013].