Antioxidant Potential of Spinach, Peas, and Sweetcorn
in relation to Freezing Period
Daniel BAJČAN
1, Ján TOMÁŠ
1, Gabriela UHLÍŘOVÁ
1, Július ÁRVAY
1,
Pavol TREBICHALSKÝ
1, Radovan STANOVIČ
1and Vladimír ŠIMANSKÝ
21Department of Chemistry, Faculty of Biotechnology and Food Sciences and 2Department
of Pedology and Geology, Faculty of Agrobiology and Food Resources, Slovak University of Agriculture in Nitra, Nitra, Slovak Republic
Abstract
Bajčan D., Tomáš J., Uhlířová G., Árvay J., Trebichalský P., Stanovič R., Šimanský V. (2013):
Antioxidant potential of spinach, peas, and sweet corn in relation to freezing period. Czech J. Food Sci., 31: 613–618.
We evaluated changes in the content of total polyphenols and antioxidant activity of frozen spinach, peas, and sweet corn in relation to the storage period. Total polyphenol content and antioxidant activity in analysed samples were determined by colorimetric methods. Both parameters were analysed in frozen samples monthly and the changes were monitored during storage in a freezing box at a temperature of –18°C for 10 months. Freezing had a different influ-ence on the levels of total polyphenol content and antioxidant activity in individual analysed samples. The greatest decrease in antioxidant activity during the entire period of freezing was recorded in spinach (79.4%), while the lowest decrease was observed in peas (26.8%). A relatively significant decrease in antioxidant activity was also found in sweet corn (62.7%). On the contrary, the greatest decrease of total polyphenol content throughout the period of freezing was found in peas (62.0%), and lowest decrease was recorded in sweet corn (only 5.0%). The total polyphenol content in spinach decreased by 43.1% after 10 months of storage.
Keywords: antioxidant activity; freezed; phenolic content; food raw material
The human diet contains a huge variety of non-nutrient components whose implications in me-tabolism have beneficial health significance. The interest in the investigation of active components, especially phenolic compounds, from natural sourc-es has greatly increased in recent years. Polyphenol compounds are widely diversified, these compounds are classified into different groups as a function of the number of phenol rings and of the structural elements that bind these rings to one another. Dis-tinctions are thus made between the phenolic acids, flavonoids, stilbenes, and lignans (Timoracká et al. 2010a; Juríková et al. 2012).
Vegetables, legumes and some cereals are im-portant sources of phenolic compounds. Maize is particularly rich in phenolic acids and anthocyanins are the primary pigments in coloured maize (del Pozo-Insfran et al. 2006). Timoracká et al. (2010b) mentioned that phenolic acids, flavones, and flavonols are typical polyphenols in peas. Spinach is a rich source of polyphenols. It contains high levels of flavonols unique to spinach. They are mainly quercetagetin derivatives. Other com-pounds in spinach were scarcely studied, although some like p-coumaric acid contribute significantly to its antioxidant activity (Edenharder et al.
2001). Patthamakanokporn et al. (2008) stated that among the factors which can affect the level of phenolic compounds in raw food materials could be the species, size, and texture of raw foods, the prepared form of the samples and mainly the conditions of storage (e.g. time, temperature). Polyphenols are reactive compounds which can be degraded and polymerised through both enzymatic and non-enzymatic reactions during processing. Polyphenols can be oxygenated and degraded by various enzymes that are released when plant cells are broken down. The resulting products are important in determining the organoleptic properties (for example, the appearance and taste) of foods and beverages (Shoji 2007).
A large part of the population cannot eat fresh food every day, and therefore frozen food is often used, mainly for practical reasons, as its preparation is rapid (Ninfali & Bacchiocca 2003). Freezing is considered as one of the best methods of treat-ment of seasonal raw foods, because it maintains biologically important nutrients and original taste during the storage period (Kopec 2002). Freezing has only a minor effect on the nutrient content of foods, but only if they are frozen correctly and at the appropriate time (Fellows 2000). Several operations, such as selection, washing, peeling, and cutting, blanching and other necessary operations influence the actual process of freezing of raw foods. These operations can greatly affect the quality of frozen raw food materials (Bahçeci et al. 2005). Relatively few works investigating the effect of freezing on the polyphenol content and antioxidant activity of raw food materials have been published.
Therefore the aim of this study was to evaluate the content of total polyphenols and antioxidant activity of chosen raw food materials (spinach, peas and sweet corn) in relation to a freezing period.
MATERIAL AND METHODS
Chemicals and instruments. Both studied
pa-rameters – total polyphenol content and anti-oxidant activity were analysed by colorimetric methods (Shimadzu UV/VIS-1240 spectrophoto- meter; Shimadzu, Kyoto, Japan). The chemicals used for all analyses were as follows: Folin-Cio-calteu reagent, monohydrate of gallic acid, p.a., anhydrous sodium carbonate, p.a., ethanol, p.a., methanol, p.a., 1,1-diphenyl-1-picrylhydrazyl (DPPH) radical, p.a., and Trolox (97%).
Samples. Fresh samples of peas (cv. Torda), spin-ach (cv. Matador) and sweet corn (cv. Sundance) were obtained from Vinica a.s., Vinica, Slovakia. Productive parts of crops were washed with distilled water several times, gently dried and immediately stored in plastic bags at –18°C. Only spinach was homogenized by mixing before freezing. Ethanol extracts were prepared after sample defrosting and homogenization by addition of 100 ml of ethanol to 50 g of the fresh sample. The mixture was shaken at room temperature for 8 h at 250 rpm. Samples were then filtered through filter paper (130 g/m2; Filtrak Brandt GmbH, Thermalbad Wiesenbad, Germany) and kept at 8°C for further analysis.
Total polyphenol content determination. Total
polyphenol content (TPC) was determined by a modified method described by Lachman et al.
(2003). 0.2 ml of the sample extract was pipetted into a 50-ml flask and diluted with 5 mlof distilled water. An amount of 2.5 ml Folin-Ciocalteu reagent was added to the diluted mixture and after 3 min 7.5 ml of 20% aqueous solution of Na2CO3 was added. Then the sample was added distilled water to the volume of 50 ml and after mixing left at room temperature for 2 hours. Blank and calibration solutions of gallic acid were prepared using the same procedure. The absorbance of sample solu-tions was measured against the blank at 765 nm. Total polyphenol (TP) content in samples was calculated as the amount of gallic acid equivalent (GAE) in mg/kg of sample fresh weight.
Statistical analysis. Statistical analyses were performed using the Statistica 6.0 software (Stat-Soft, Boston, USA) and the results were evaluated by analysis of variance (ANOVA). Differences in data were evaluated by the post hoc LSD test at a 5% significance level.
RESULTS AND DISCUSSION
Both studied parameters – antioxidant activity and the content of total polyphenols of spinach, sweet corn, and peas in relation to the freezing period are described in Table 1.
The highest level of antioxidant activity of fresh samples was observed in sweet corn (0.970 mmol
[image:3.595.66.531.114.301.2]Trolox/g = 49.3% inhibition of DPPH), while the lowest was found out in peas (0.682 mmol Trolox/g = 34.4% inhibition of DPPH). AA of spinach was 0.834 mmol Trolox/g (42.5% inhibition of DPPH). On the other hand, the highest level of total polyphenol content of fresh samples was found out in spinach (285.1 mg GAE/kg) and the lowest in peas (85.9 mg GAE/kg). TPC in sweet corn was 179.7 mg GAE/kg. Ismail et al. (2004) found out a signifi-cantly higher level of AA in fresh spinach (66.4% inhibition of DPPH). Turkmen et al. (2005) deter-mined TPC in fresh spinach to be 589 mg GAE/kg. Lopez-Martinez et al. (2009) evaluated the AA and TPC of 18 maize varieties. The levels of AA in maize were in the range of 40–100% inhibition of DPPH. The highest value of AA was recorded
Table 1. Antioxidant activity (AA) in mmol Trolox/g and total polyphenol content (TPC) in mg GAE/kg in relation to freezing period in months
Time (h)
Spinach Sweetcorn Pea
AA TPC AA TPC AA TPC
0 0.834 ± 0.016a 285.1 ± 7.2ab 0.970 ± 0.018a 179.7 ± 2.4a 0.682 ± 0.015a 85.9 ± 2.4a
1 0.792 ± 0.009b 293.0 ± 2.4a 0.942 ± 0.021ab 215.6 ± 7.2bc 0.778 ± 0.014b 99.2 ± 2.4bc
2 0.756 ± 0.011c 293.7 ± 4.8a 0.908 ± 0.014bc 224.2 ± 4.8c 0.836 ± 0.029bc 110.5 ± 4.8c
3 0.614 ± 0.024d 282.1 ± 2.4b 0.886 ± 0.017c 213.5 ± 2.4bd 0.802 ± 0.005c 97.2 ± 2.4b
4 0.486 ± 0.015e 271.3 ± 2.4c 0.728 ± 0.011d 206.5 ± 4.8de 0.740 ± 0.031ab 82.5 ± 2.4a
5 0.434 ± 0.013f 270.1 ± 4.8c 0.702 ± 0.010e 201.3 ± 4.8ef 0.694 ± 0.015a 74.7 ± 2.4d
6 0.362 ± 0.015g 270.4 ± 2.4c 0.606 ± 0.013f 195.9 ± 2.4f 0.676 ± 0.016a 59.4 ± 4.8e
7 0.274 ± 0.012h 260.4 ± 4.8d 0.556 ± 0.020g 189.6 ± 2.4g 0.626 ± 0.011d 51.8 ± 2.4f
8 0.238 ± 0.017i 231.3 ± 2.4e 0.494 ± 0.011h 182.7 ± 4.8ag 0.594 ± 0.018de 37.5 ± 2.4g
9 0.173 ± 0.010j* 199.9 ± 2.4f 0.406 ± 0.008i 177.5 ± 2.4ah 0.568 ± 0.017e 35.3 ± 2.4g
10 0.159 ± 0.011j 162.3 ± 2.4g 0.352 ± 0.008j 170.7 ± 2.4h 0.496 ± 0.009f 32.6 ± 2.4g
a–jvalues with different letters denote significant differences (P < 0.05) among times of storage; values of AA and TPS are
expressed as arithmetic mean ± standard deviation; *different storage freezing perion in month of DPPH and total poly-phenol content (TPC) in mg GAE/kg
y = –0.0746x + 0.9134
R² = 0.9741
0.0 0.2 0.4 0.6 0.8 1.0
0 1 2 3 4 5 6 7 8 9 10
Storage time (month)
AA
(mmol
Trolox/g
)
y = -11.072x + 322.76
R2 = 0.7699
y = –0.241x3 + 2.3716x2 – 9.207x + 297.93
R2 = 0.98
0 50 100 150 200 250 300 350
0 1 2 3 4 5 6 7 8 9 10
Storage time (month)
TPC
(mg
GAE
/kg)
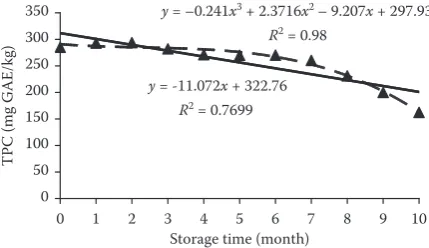
[image:3.595.69.286.590.716.2]Figure 2. Total polyphenol content (mean) of spinach in relation to the storage period
[image:3.595.313.528.592.716.2]in purple varieties (100% inhibition of DPPH) and relatively high values of AA were also found in black and red varieties (69–92% inhibition of DPPH). Non-pigmented varieties exhibited AA in the range of 50–90% inhibition of DPPH. The same authors found out TPC in maize in the range of 170–3400 mg GAE/kg. The lowest TPC was recorded in colourless varieties, which is in cor-relation with our results. Turkmen et al. (2005) determined the AA level in peas as 21.3% inhibi-tion of DPPH, which is significantly less than our result. Halvorsen et al. (2002) also observed that AA in peas was relatively low among legumes and vegetables. Timoracká (2007) determined a much lower average level of TPC (14.5 mg GAE/kg DW) in different varieties of peas.
The AA level in spinach during the freezing period decreased relatively rapidly and linearly (Figure 1). Its value was about 79.4% lower after 10 months of storage (Figure 7). A decrease of the AA value was statistically significant from the beginning of storage until the 9th month.
TPC in spinach increased slightly in the first two months, then a slight decrease was recorded
until the 7th month. Subsequently, a relatively large, statistically significant decrease of TPC was recorded until the end of storage (Figure 2). TPC in spinach decreased about 43.1% after 10 months. The time dependence of TPC had rather a poly-nomial (R2 = 0.980) than linear (R2 = 0.770) char-acter. Analyses of AA and TPC in spinach are the subjects of many research works, but the studies of a long-term effect of freezing on AA and TPC in spinach are missing.
The level of AA in sweet corn during freezing decreased relatively rapidly and linearly, similarly to spinach. A statistically significant decrease of AA was observed from 3rd to 10th month (Figure 3). The recorded decrease of AA in sweet corn (about 62.7%) was less significant compared to spinach.
TPC in sweet corn increased in the first two months, then a slight decrease was recorded until the end of storage (Figure 4). TPC in sweet corn decreased only about 5.0% after 10 months. The time dependence of TPC had rather a polynomial (R2 = 0.881) than linear (R2 = 0.426) character, simi-larly to spinach. AA and TPC in different varieties of maize are the subjects of many research works,
y = –0.066x + 1.0823
R² = 0.9821
0.0 0.2 0.4 0.6 0.8 1.0 1.2
0 1 2 3 4 5 6 7 8 9 10
Storage time (month)
AA (mmol Trolox/g)
y = –3.4573x + 216.85
R² = 0.4255
y = 0.3049x3 – 6.4739x2 + 35.871x + 157.93
R² = 0.8811
0 50 100 150 200 250
0 1 2 3 4 5 6 7 8 9 10
Storage time (month)
TPC
(m
g
G
A
E/kg
[image:4.595.307.531.83.218.2])
[image:4.595.65.284.86.219.2]Figure 4. Total polyphenol content (mean) of sweet corn in relation to the storage period
Figure 3. Antioxidant activity (mean) of sweet corn in relation to the storage period
Figure 6. Total polyphenol content (mean) of peas in rela-tion to the storage period
Figure 5. Antioxidant activity (mean) of peas in relation to the storage period
y = –0.0265x + 0.8399
R² = 0.705
y = 0.0012x3 – 0.0254x2 + 0.1328x + 0.5945
R² = 0.9456
0 0.1 0.2 0.3 0.4 0.5 0.6 0.7 0.8 0.9
0 1 2 3 4 5 6 7 8 9 10
Storage time (month)
AA (mmol Trolox/g)
y = –7.7727x + 116.33
R² = 0.8558
y = 0.3415x3 – 6.7082x2 + 29.766x + 64.442
R² = 0.9834
0 20 40 60 80 100 120
0 1 2 3 4 5 6 7 8 9 10
Storage time (month)
[image:4.595.63.295.590.726.2] [image:4.595.311.527.600.723.2]but the studies of a long-term effect of freezing on AA and TPC in sweet corn are missing.
The time dependence of AA in peas had a dif-ferent trend compared to spinach and sweet corn. The dependence of AA had a significantly polyno-mial character (R2 = 0.947). The AA level in peas increased in the first two months, then a slight decrease was recorded until the end of storage (Figure 5). The recorded decrease of AA level in peas after 10 months of storage (about 26.8%) was not very significant and it was the lowest among all analysed crops. Puupponen-Pimia et al. (2003) observed a higher decrease (41.7–55.6%) of AA in peas during 12 months freezing.
TPC in peas increased significantly in the first two months, then a rapid decrease was recorded until the 8th month. Finally a slight decrease of TPC was found out from the 8th month to the end of storage (Figure 6).
The decrease of TPC in peas (about 62.0%) was the highest among all analysed crops. Puupponen-Pimia et al. (2003) observed a much lower decrease (12.5–33%) of TPC in peas during 12 months freez-ing. The time dependence of TPC had rather a polynomial (R2 = 0.983) than linear (R2 = 0.856) character, similarly to spinach and sweet corn. Timoracká (2007) recorded an even 50% decrease of selected flavonoids in different varieties of peas during 6 months freezing.
CONCLUSIONS
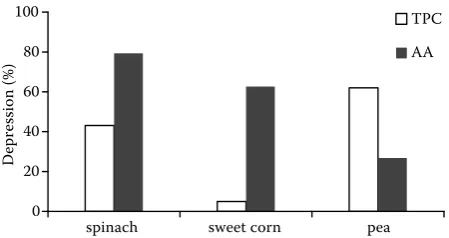
Freezing had a different influence on the levels of TP content and AA in individual analysed samples. A great decrease in AA levels during the period of freezing (10 months) was recorded in spinach (79.4%) and sweet corn (62.7%), while the lowest decrease
was observed in peas (26.8%). On the contrary, the greatest decrease of TP content throughout the period of freezing was found in peas (62.0%), and the lowest decrease of TP content was recorded in sweet corn (only 5.0%). The TP content in spinach decreased by 43.1% after 10 months of storage. The continuous decrease in AA during the storage period (10 months) was found in spinach and sweet corn. For the peas, AA increased in the first two months, then its level fell steadily after 10 months. For all three studied raw food samples, TP content increased in the first two months, then we recorded a continu-ous decrease of TP content. While the decrease in sweet corn was very slight, in peas and spinach it was quite significant. Among the factors which can affect the levels of antioxidant activity and total phenolic compounds in food samples could be the species, size and texture of raw foods, the prepared form of the samples and mainly the conditions of storage (e.g. time, temperature).
References
Brand-Williams W., Cuvelier M.E., Berset C. (1995): Use of a free radical method to evaluate antioxidant activity. LWT-Food Science and Technology, 28: 25–30. Bahçeci K., Serpen A., Gökmen V., Acar J. (2005): Study of lipoxygenase and peroxidase as indicator enzymes in green beans: change of enzyme activity, ascorbic acid and chlorophylls during frozen storage. Journal of Food Engineering, 66: 187–192.
Del Pozo-Insfran D., Brenes C.H., Serna Saldivar S.O., Talcott S.T. (2006): Polyphenolic and antioxidant content of white and blue corn (Zea mays L.) products. Food Research International, 39: 696–703.
Edenharder R., Keller G., Platt K.L., Unger K.K. (2001): Isolation and characterization of structurally novel antimutagenic flavonoids from spinach (Spinacia oleracea). Journal of Agriculture and Food Chemistry,
49: 2767–2773.
Fellows P. (2000): Food Porcessing Technology – Princi-ples and Practice. 2nd Ed. Food Science and Technology.
Woodhead Publishing Ltd., Cambridge.
Halvorsen B.L., Holte K., Myhrstad M.C.W., Barikmo I. (2002): A systematic screening of total antioxidants in dietary plants. Journal of Nutrition, 132: 461–471. Ismail A., Marjan Z.M., Foong C.W. (2004):Total
anti-oxidant activity and phenolic content in selected vegeta-bles. Food Chemistry, 87: 581–586.
Juríková T., Rop O., Mlcek J., Sochor J., Balla S., Szekeres L., Hegedusová A., Hubalek J., Adam V.,
0 20 40 60 80 100
spinach sweet corn pea
Depression (%)
[image:5.595.64.289.84.203.2]TPC AA
Kizek R. (2011): Phenolic profile of edible honeysuckle berries (genus Lonicera) and their biological effects. Molecules, 17: 61–79.
Kopec K. (1997): Zahradnická kvalitologie. MZLU, Brno. Lachman J., Hejtmánková K., Dudjak E. (2003):
Con-tent of polyphenolic antioxidants and phenolcarboxylic in selected parts of yacon. In: Vitamins 2003 – Přírodní antioxidanty a volné radikály, 15.–17. 9. 2003, Univerzita Pardubice: 89–978.
Lopez-Martinez L.X., Oliart-Ros R.M., Valerio-Alfa-ro G., Lee Ch.-H., Parkin K.L., Garcia H.S. (2009): An-tioxidant activity, phenolic compounds and anthocyanins content of eighteen strains of Mexican maize. LWT-Food Science and Technology, 42: 1187–1192.
Ninfali P., Bacchiocca M. (2003): Polyphenols and an-tioxidant capacity of vegetables under fresh and frozen conditions. Journal of Agricultural and Food Chemistry,
51: 2222–2226.
Patthamakanokporn O., Puwastien P., Nititha-myong A., Sirichakwal P.P. (2008): Changes of anti-oxidant activity and total phenolic compounds during storage of selected fruits. Journal of Food Composition and Analysis, 21: 241–248.
Puupponen-Pimia R., Hakkinen S.T., Aarni M., Suortti T., Lampi A.M., Eurola M. (2003): Blanching and long-term freezing affect various bioactive compounds of vegetables in different ways. Journal of the Science of Food and Agriculture,83: 1389–1402.
Shoji T. (2007): Polyphenols as natural pigments: changes during food processing. American Journal of Food Tech-nology, 2: 570–581.
Timoracká M. (2007): Polyphenolic compounds in se-lected legumes. [Dissertation.] SPU, Nitra.
Timoracká M., Vollmannová A. (2010a): Determination of flavonoids content in coloured peas (Pisum sativum L.) in relation to cultivar’s dependence and storage duration under natural conditions. Potravinárstvo, 4(4): 58–61. Timoracká M., Vollmannová A., Bystrická J. (2010b):
Polyphenols in chosen species of legumes – a review. Potravinárstvo, 4(3): 65–72.
Turkmen N., Sari F., Velioglu N.Y.S. (2005): The effect of cooking methods on total phenolics and antioxidant activity of selected green vegetables. Food Chemistry,
93: 713–718.
Received for publication November 30, 2012 Accepted after corrections May 13, 2013
Corresponding author