Grain Boundary Microstructure-Controlled Superplasticity
in Al–Li–Cu–Mg–Zr Alloy
Shigeaki Kobayashi
1;*1, Taichi Yoshimura
1;*2, Sadahiro Tsurekawa
1, Tadao Watanabe
1and Jianzhang Cui
21Laboratory of Materials Design and Interface Engineering, Department of Nanomechanics, Graduate School of Engineering,
Tohoku University, Sendai 980-8579, Japan
2School of Material and Metallurgy, Northeastern University, Shengyang 110006, P.R. China
Grain boundary microstructure-controlled superplasticity in an Al–Li alloy is discussed on the basis of OIM observations using the specimens with different grain boundary microstructures. The specimens having the homogeneous {110} textured grains with a high frequency of low-angle boundaries showed superplasticity, whereas the specimen having a heterogeneous and randomly oriented grains with a high frequency of random boundaries did not yield superplasticity. Cavities were preferentially formed at the triple junctions where two or three random boundaries interconnected. From those results, the optimum grain boundary microstructure for superplasticity is discussed in connection with the relationship between grain boundary character distribution (GBCD) and triple junction character distribution. The strain rate change tests were carried out during deformation in order to rejuvenate initially introduced optimal grain boundary microstructure. The superplasticity can be improved by the strain rate change test resulting in an increase of the frequency of low angle boundaries at the early work softening stage of deformation.
(Received February 17, 2003; Accepted May 28, 2003)
Keywords: grain boundary engineering, grain boundary character distribution, aluminum–lithium alloy, superplasticity, grain boundary microstructure
1. Introduction
Al–Li alloys are expected as a promising structural material for aircrafts,1)because of their low density and high specific strength. However, Al–Li alloys often show so severe intergranular brittleness2,3) that their workability is greatly limited. In order to improve workability in brittle materials, the development of superplasticity has been considered.4–10) For this purpose, deformation behaviour,4) microstructural evolution5–8) and accommodation process associated with grain boundary sliding9,10) have been investigated in Al–Li alloys. Thermomechanical processing of Al–Li alloys is often accompanied by additional deforma-tion after a cold and warm rolling, as other aluminum alloys11,12)and iron alloys,13)because the deformed state was expected to develop the superplasticity at higher strain rate than the fully recrystallized one. In this case, deformation-induced continuous recrystallization seemed to occur during deformation. Subgrains introduced by warm rolling slightly grow, and the misorientation angle of grain boundary increases during deformation.5) From the previous studies using orientation controlled bicrystals, grain boundary slid-ing is known to depend strongly on the grain boundary character and structure.14,15)The random grain boundary can slide more easily than the low-angle andgrain boundaries. Therefore, it is generally believed that an increase in the misorientation angle during deformation makes it possible for grain boundaries to slide more easily, resulting in a large elongation. Numerous investigations have been made to
reveal microstructural evolution during superplastic defor-mation. It is reported that low-angle boundaries are changed into random boundaries during superplastic deformation.8) However, little attention has been paid, particularly to the correlation between grain boundary microstructures and deformation behaviour and/or mechanism.
Grain boundary sliding produces the stress concentration at triple junctions in polycrystals.16–19)It is likely that the propensity to cavity nucleation at triple junctions can vary depending on the grain boundary connectivity, because individual grain boundaries have an inherent resistance to boundary fracture depending on their character.20–23) Low-angle and boundaries show higher resistance to fracture than random boundary. Bollmann classified triple junctions into two types; one where the Burgers vectors of grain boundary dislocations on three boundaries are balanced (I-line) and the other where the Burgers vectors are not balanced (U-line) at the junction.24,25) Randle first evidenced that cavities are hardly formed at I-lines, whereas U-lines become preferential sites for cavitation during superplastic deforma-tion of Al–Li alloy.10)Watanabeet al.34)and Fortieret al.36)
reported that the frequency of I-line triple junctions increases with increasing the frequency ofboundaries.
In the present investigation, we have focused on the effects of the initial grain boundary microstructure on the develop-ment of superplasticity and on the microstructural evolution during deformation in an Al–Li alloy (2091 alloy). To analyze the grain boundary microstructures more quantita-tively, a new microstructural factor ‘‘the grain boundary connectivity’’ was introduced in addition to the grain boundary character distribution (GBCD).26) The optimum grain boundary microstructure for controlling cavitation and improving superplasticity is discussed on the basis of the obtained results. Finally, we demonstrate that the super-*1Graduate Student, Tohoku University. Present address: Graduate School
of Engineering, Yokohama National University, Yokohama 240-8501, Japan.
*2Graduate Student, Tohoku University. Present address: SANYO
electro-nics Co., Japan.
plasticity could be further improved by rejuvenating initially introduced optimal grain boundary microstructure during superplastic deformation in the alloy.
2. Experimental Procedure
2.1 Specimen preparation
Al–2.2Li–2.5Cu–1.2Mg–0.15Zr (in mass%) alloy was used for this work. This alloy was subjected to the following thermomechanical treatment; hot rolling to 80% strain at 723 K, solution treatment at 803 K for 7.2 ks, overaging at 673 K for 115.2 ks, and final cold rolling to 85% strain. Tensile specimens whose dimensions were 10 mm long, 4 mm wide and 1 mm thick were cut with a spark machine. The tensile direction was parallel to the rolling direction. Thereafter, those specimens underwent different annealing processes in order to obtain different grain boundary microstructures; the Type A specimens were annealed at 723 K for 7.2 ks and the Type B specimens at 793 K for 10.8 ks in Ar atmosphere of 1 atm. According to the phase diagrams of Al–Li27)and Al–Zr28)alloy systems, both Al3Li and Al3Zr are expected to precipitate at 723 K, but Al3Zr is probably solutionized at 793 K. Finally, all the specimens were held at 673 K for 21.6 ks in an Ar atmosphere to stabilize precipitated particles.
2.2 High temperature tensile test for superplastic de-formation
Tensile tests were carried out at temperatures ranging from 673 to 723 K and at the initial strain rates of1:0104s1– 5:0103s1, using a Shimadzu Autograph (AG-50kNG model) with a split type electric furnace in air. The testing temperature was controlled by a PID digital program controller within3K. A test was started after holding for 1.8 ks at a testing temperature to remove some effects due to thermal expansion of the tensile testing system.
In order to examine possible changes of grain boundary microstructures during superplastic deformation, a tensile test was interrupted for observations of grain boundary microstructures at different stages of deformation. To freeze the microstructure developed during high temperature de-formation, the specimen deformed to the predetermined strain was rapidly cooled down to room temperature within some 120 s by blowing cold air in unloading conditions.
2.3 Grain boundary microstructure analyses
The orientation imaging microscopy (OIM)29,30) was applied to quantitatively analyze grain boundary microstruc-tures in pre- and post-deformed specimens with a field emission scanning electron microscope (HITACHI S-4200 FE-SEM). For OIM observation, specimen surfaces were electrolytically polished to remove both residual strain and oxide film near surface layer in an electrolytic solution of perchloric acid-ethylene glycol-methyl alcohol with volume fraction1 : 3 : 6at a current density of 0.15 A/cm2 at 280 K for 15 s. Electron beam was scanned stepwise over the area of 60mm60mmon specimen surface by a regular hexagonal grid of 0.7mm at an accelerated voltage of 30 kV. About 10,000 orientation measurements were completed within 4 hours. The area consisted of more than four adjoining steps
with the same orientation was defined as a single grain in order to avoid the ambiguity of orientation determination due to a lower image quality of a captured electron backscattered pattern.
3. Results and Discussion
3.1 Initial grain boundary microstructures
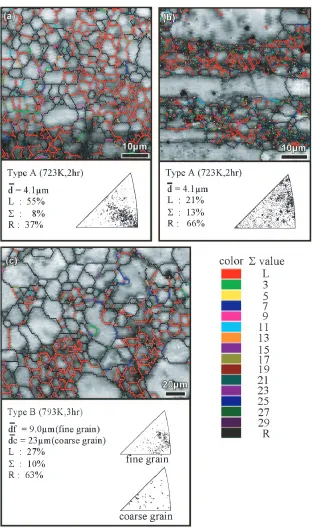
Figures 1(a), (b) and (c) show OIM micrographs for the initial microstructures observed on the rolling surface (a), the cross section parallel to rolling direction (b) of the Type A specimen and the rolling surface of the Type B specimen (c). Here, the boundaries whose misorientation angle ranging from 2 to 15 were defined as low-angle boundaries. The character of individual grain boundaries is indicated by differently colored lines. The average grain size, the grain orientation distribution and the grain boundary character distribution (GBCD) are given in the figures. It has been found that the rolled surface of the Type A specimen has a homogeneous fine-grained structure with the average grain size of 4.1mm, and that the grain orientation distribution spreads between h110i and h112i orientation. The sharply textured grain structure is ascribed to the cold rolling prior to recrystallization. The frequency of low-angle boundaries was as high as 55%. According to the phase diagram of the Al–Zr alloy system,28)0(Al
3Zr) particles form from the Al matrix by overaging at 673 K before cold rolling in Type A specimen. Accordingly Al3Zr particles inhibited grain boundary migration and retarded grain growth during the heat treatment at 723 K. Therefore, the fine sub-grained structure existing at recovery stage of annealing or early stage of recrystallization remained. Nevertheless, as for the cross section parallel to the rolling direction of Type A specimen (Fig. 1(b)), the initial microstructure was con-siderably heterogeneous. Coarse grains elongated to the rolling direction and the clusters of fine grains coexist alternately.
On the other hand, the rolled surface of the Type B specimen (Fig. 1(c)) possessed a heterogeneous duplex grain structure composed of fine grained area of ca. 10mm and coarse grained area of 20–50mm. The coarse grains were randomly oriented, while the fine grains had similar grain orientations to those in the Type A specimen. The frequency of low-angle boundaries in the Type B specimen was lower than that of the Type A specimen. Conversely, the frequency of random boundaries was high (63%). Since the amount of dispersion particles such as Al3Zr was markedly decreased in the Type B specimen due to heat-treatment at higher temperature (793 K),28)grain boundary migration must have been allowed easily, then resulting in significant grain growth.
3.2 Deformation behaviour of differently processed Al– Li alloy specimens
3.2.1 Stress-strain curves at different strain rates
fracture of the specimen. However, plastic deformation tended to go into the steady state after showing the peak as the strain rate decreased lower than5103s1. The strain to fracture increased with decreasing the strain rate, and the maximum strain of 1.25 (253% elongation) was obtained at 2:5104s1. The fracture strain decreased with further decreasing the strain rate.
On the other hand, the flow stress of the Type B specimens also showed a peak at very early stage of deformation and then decreased monotonously within a range of the strain rates used. Moreover, the level of the flow stress was higher than that of the Type A specimen at any strain rates. The true
stress-true strain curves at the beginning of deformation appear similar to those reported for dispersion strengthened alloys,31,32) i.e., showing a very high value of the work hardening rate just after yielding. The strain to the maximum flow stress ("¼0:02) is much smaller by a factor of 10 than that of the Type A specimen. The steady state deformation was not observed at the used strain rates. All the specimens fractured at the strain smaller than 0.65 (91%). The smaller fracture strain was obtained at the lower strain rate. This is a general tendency to high temperature embrittlement. The observed embrittlement was probably caused by the stress concentration at triple junctions produced by grain boundary
[image:3.595.142.455.67.596.2]sliding in a low strain rate region, because the heterogeneous grain structure prevents the relaxation of the stress concen-tration at triple junctions by the rearrangement of grain configuration.
Figures 3(a) and (b) show the temperature dependence of the true stress-true strain curves observed at a strain rate of 2:5104s1for the Type A and B specimens, respectively. For the Type A specimen, the elongation to fracture decreased with increasing temperature, but the elongation recovered with further increasing temperature above 723 K and superplastic flow occurred. The recovery of elongation at higher temperature (723 K) takes place owing to the grain boundary diffusion controlled relaxation for the stress concentration due to grain boundary sliding.
On the other hand, the flow stress of the Type B specimens was much higher than that of the Type A specimens at every temperature. No steady state of deformation was observed at any temperatures and the fracture strain was decreased with increasing temperature and smaller than 0.58.
3.2.2 Strain rate dependence of the flow stress and fracture strain
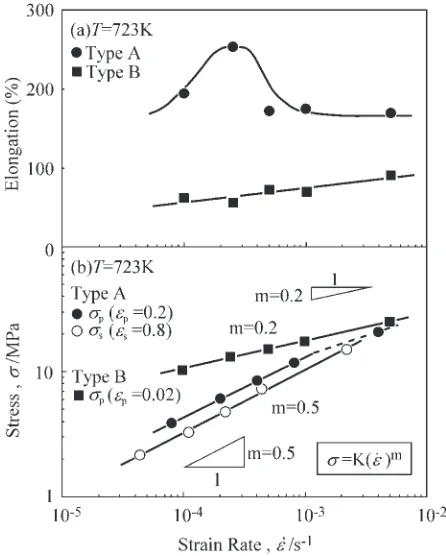
Figure 4(a) shows the strain rate dependence of the maximum value of the elongation to fracture for the Type A and the Type B specimens deformed at 723 K. The fracture strain of the Type A specimen exhibited a peak value 253% at 2:5104s1, and were around 180% at higher or lower Fig. 2 Strain rate dependence of the true stress-true strain curves for
(a) Type A and (b) Type B deformed at 723 K. Fig. 3(a) Type A and (b) Type B deformed at a strain rate ofTemperature dependence of true stress-true strain curves for2:5104s1.
[image:4.595.57.280.70.422.2] [image:4.595.314.538.71.426.2] [image:4.595.314.537.479.757.2]strain rates. In contrast, Type B specimens did not show elongation large enough to produce superplasticity at used strain rates.
Figure 4(b) shows the strain rate dependence of the peak stress at strain"p¼0:2for the Type A and"p¼0:02for the Type B, and the steady state stress ("s¼0:8) for the Type A at 723 K. The strain rate dependence of the peak and steady state stresses can be expressed as,
¼Kð""_Þm; ð1Þ
whereK is a constant depending on temperature and mthe strain rate sensitivity exponent.
The strain rate sensitivity exponents (mvalue) were around 0.5 at the true strain ranging from 0.2 to 0.8 for the Type A specimen, indicating that deformation characteristics is suitable for development of superplasticity. However, the value ofmdecreased to 0.2 at the true strain of 0.2 beyond the higher strain rates than approximately 1103s1, which resulted in non-superplastic deformation. This change in m value suggests that deformation mechanism is different between the low strain rate region and the high strain rate region. In the lower strain rate region (""_¼2:5104s1), grain boundary sliding may play an important role as dominant deformation mechanism,18)while dislocation mo-tion in the grain interior must govern deformamo-tion in the higher strain rate region (""_¼5103s1).
On the other hand, the value ofmfor the Type B specimen having heterogeneous grain structure was as small as 0.2. Thus, the dislocation motion must be dominant deformation mechanism, although a large number of random boundaries existed. The reason for the difficulty in grain boundary sliding in the Type B specimen is attributed to the hetero-geneous grain structure.26)
3.2.3 Temperature dependence of high temperature deformation
The mechanical state of high temperature deformation can be described by the strain rate ""_, flow stress and the absolute temperatureT as the follows,
_
" "¼A
E
n
exp Q
RT
ð2Þ
whereAis constant,nstress exponent,EYoung’s modulus,R gas constant andQthe activation energy for deformation.
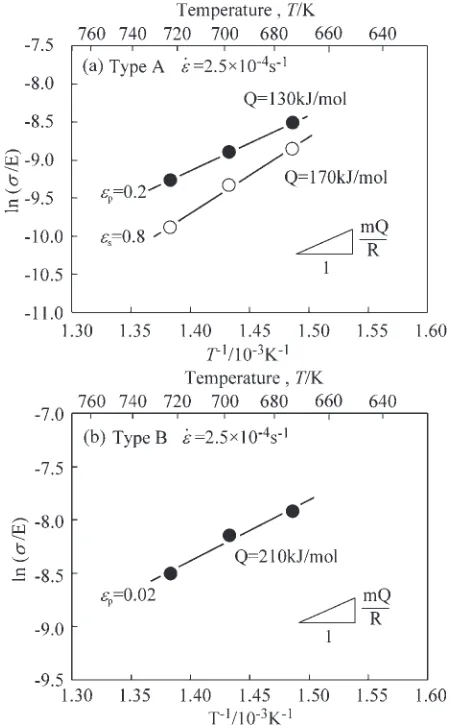
Temperature dependence of the flow stresses compensated by the Young’s modulus4)at strain rate of2:5104s1 is shown by Figs. 5(a) and (b) for the Type A and the Type B specimens, respectively. The stresses were obtained at the peak in the stress-strain curves ("¼0:2for the Type A and
"¼0:02for the Type B) and the steady state ("¼0:8for the Type A). It is seen that a linear relationship exists between the flow stress and the reciprocal of the absolute temperature. As predicted from eq. (2), the slope of the straight lines in Fig. 5 gives mQ=R (m¼1=n) so that we can obtain the activation energyQfor superplastic deformation. Assuming that m value is independent of temperature, the activation energies obtained at the peak stress (m¼0:5) and the steady state stress (m¼0:5) were Qp¼130kJ/mol and Qs¼ 170kJ/mol, respectively, for the Type A specimen. On the other hand, the higher activation energy Qp¼210kJ/mol was obtained at the peak stress (m¼0:2) for the Type B
specimen that showed the stress-strain curves similar to those in dispersion strengthened alloys at the beginning of deformation. The deformation mechanism of the Al–Li alloy will be discussed in consideration of the evolution of grain boundary microstructure in the following section.
3.3 Evolution of grain boundary microstructures during superplastic deformation
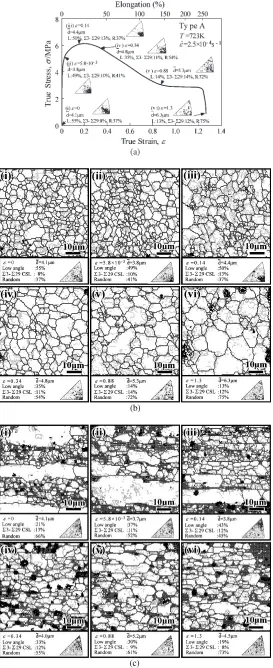
In order to reveal how the optimum grain boundary microstructure can evolve for superplastic behaviour, the changes in the grain boundary microstructures during super-plastic deformation were analysed by the OIM. The Type A specimens were deformed to different strains at the optimal deformation condition for development of superplasticity. Fig. 6(a) shows the changes in the grain size, the grain orientation distribution and the grain boundary character distribution (GBCD) during superplastic deformation. In more detail, Figs. 6(b) and (c) show the OIM micrographs for the rolled surface and the cross section parallel to rolling direction, respectively. Thin lines in the grain interior appeared when the misorientation between adjoining scan-ning steps was in the range from 0.5to 2. Accordingly, the
density of the thin lines in the grain interior reflects the extent of plastic strain (the dislocation density).
On the rolled surface of the specimen, the frequency of
[image:5.595.314.539.72.435.2]random boundaries (37%–41%) did not significantly change until the flow stress showed a peak (Figs. 6(a) and (b) (i)– (iii)), but the dislocation density in the grain interior remarkably increased. However, beyond the peak stress, the dislocations in the grain interior began to be absorbed into grain boundaries so that the frequency of random boundaries increased successively from 37% to 72% in the work softening regime (Figs. 6(a) and (b) (iii)–(v)). The average grain size also increased by a factor of 1.2. In addition, the initially locally oriented grains along the line betweenh110i
and h112i became randomly oriented. The work softening phenomenon must have resulted from deformation-induced continuous recrystallization, because the driving force for grain boundary migration increased owing to the introduction of dislocations (strain) in the grain interior. The deformation-induced continuous recrystallization was previously recog-nized by many investigations in superplastic deformation in Al–Li alloys5–8)and other alloys.11–13)Moreover, a marked change in the grain boundary microstructures in the work softening regime is attributable to the absorption of disloca-tions by grain boundaries and to preferential dynamic migration of random boundaries. When the deformation reaches the steady state, the frequency of low-angle bound-aries remarkably decreased from 55 to 14% and conversely the frequency of random boundaries increased to 72% by a factor of 2. Therefore, grain boundary sliding could be enhanced at the steady state and produced more significant superplastic behaviour. Cingaraet al.investigated the change in GBCD after superplastic deformation in Al–Li alloy and showed that the frequency of129boundary decreased and conversely the frequency of random boundaries in-creased.8) The result of the present work is consistent with their finding. In the present work, furthermore, the change in GBCD is considered in connection with the process of deformation.
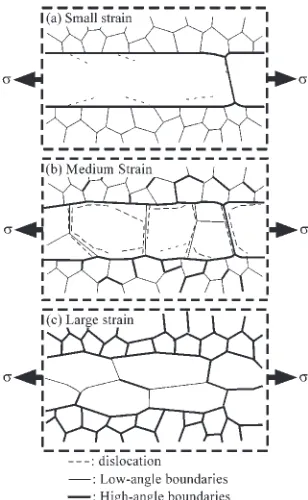
Microstructural observations on the cross section parallel to the rolling direction revealed that the elongated coarse grains and the fine grain cluster coexisted alternately. This duplex microstructure remained until the beginning of the steady state stage (Fig. 6(c) (i)–(v)). However, dislocations which were introduced into the elongated coarse grains by deformation (Fig. 6(c) (ii) and (iii)), were rearranged into sub-boundaries along the direction perpendicular to the tensile direction from the beginning of the work softening (Fig. 6(c) (iv) and (v)), as schematically shown in Fig. 7. It is found from Fig. 6(c) and Fig. 7 that these sub-boundaries changed into high angle boundaries by absorbing dislocations from the grain interior. As the results, the elongated grains were divided into equiaxed grains. In fractured specimen, the elongated coarse grains were not observed over the whole fracture surface.
The Type B specimen, which had initially heterogeneous grain structure consisted of fine grains of 9mm and coarse grains of 23mm, changed into the grain structure with uniform grain size of 25mm during high temperature deformation. On the other hand, the frequency of random boundaries increased from 63% to 72% during deformation to fracture.
3.4 Change in cavity density during superplastic defor-mation
The relative density was measured at different deformation stages during superplastic deformation for the Type A specimen to reveal the relationship between the change in the grain boundary microstructure and cavitation. The density measurements were conducted by the Archimedes method. Figure 8 shows the change in the relative density during superplastic deformation. The relative density little changed until the beginning of work softening ((i)–(iii)), but it decreased from 97.8% to 90.8% approaching the steady state. Thereafter, the density scarcely changes until fracture. Once cavities are formed at the triple junctions, they can significantly reduce the stress concentration due to grain boundary sliding. Thus, the rate of cavity nucleation may have decreased at the steady state as shown in Fig. 8. It is interesting to note that the decrease in the relative density
Fig. 8 Change in the relative density of the Type A specimen during superplastic deformation.
[image:7.595.349.503.70.320.2] [image:7.595.312.542.600.758.2]occurred in the regime where the frequency of random boundaries increased. Therefore, cavities would initiate when the frequency of random boundaries reached at a certain level and interconnected each other by growing along the random boundaries.
3.5 Relationship between the character of triple junc-tion and cavity nucleajunc-tion
Grain boundary sliding inevitably generates the stress concentration at triple junctions in a polycrystal. Unless the stress concentration is accommodated during deformation, extensive cavitation must occur and results in premature fracture. Accordingly, it is important to clarify what is the preferential site for cavity nucleation and to know what kind of microstructure is more resistant to cavitation and crack nucleation for improvement in superplasticity from grain boundary microstructural point of view.
Figure 9 shows a SEM micrograph of cavitated Type A specimen deformed to 253% elongation at 723 K and at 2:5104s1. The character of grain boundaries is indi-cated as L for low angle boundaries, R for random boundaries, plus numeral for CSL boundaries. Most cavities nucleated at triple junctions, though a few cavities were observed in the grain interior. An important finding is that cavities preferentially nucleated at those triple junctions which were composed of more than two random boundaries like L-R-R, -R-R and R-R-R junctions. Thus, random boundaries were confirmed to be preferential sites for cavity nucleation and growth. In the case of particle dispersion strengthened alloy, cavitation often occurs predominantly at particles in grain boundaries.32)However, TEM observation in the present study revealed that dispersion particles rarely situated at grain boundary triple junctions. Moreover, coherent particles such as Al3Zr do not always precipitate at triple junction, as reported by recent work on grain boundary precipitation in Ti–V–Al alloy.33) Therefore, the selectivity of cavity nucleation is correlated with grain boundary connectivity; in other words, the type of triple junction characterized by the manner of connection among different types of grain boundary.
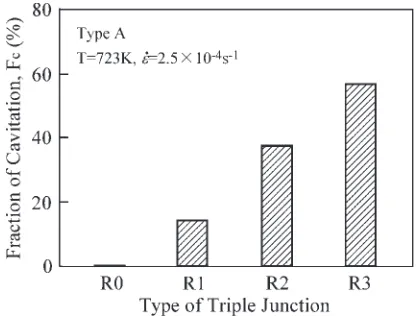
The relationship between the type of triple junction and the propensity to cavitation is shown in Fig. 10 for the Type A specimen deformed at 723 K. The triple junctions were classified into four types in terms of random boundary
connectivity: (1) R0 type with no random boundary at triple junction, (2) R1 type with 1 random boundary, (3) R2 type with 2 random boundaries and (4) R3 type with 3 random boundaries. It is evident that the R2 and R3 type triple junctions become preferential sites for cavity nucleation. In particular, 57% of R3 type triple junctions yielded cavitation. When a higher frequency of random boundaries are con-nected to each other, most of the R2 and R3 type triple junctions are found to be of U-line type junctions.34–36)The results obtained in the present work is in good agreement with the previous work by Randle.10)Assuming that the stress relaxation is predominantly promoted by grain boundary diffusion, the stress concentration at the R2 and R3 type triple junctions are readily accommodated compared to the one at the R0 and R1 type junctions because grain boundary diffusivity along random boundary is much higher than that ofboundary.37)The assumption should lead the R0 and R1 type junctions to be preferential sites for cavitation compar-ing with the R2 and R3 type junctions. However, the experimental evidence is converse. This discrepancy does not show that grain boundary diffusion predominantly contrib-uted to the stress accommodation at triple junctions. Instead, we should consider the contribution of plastic deformation to relaxation of the stress concentration. Grain boundaries act as an effective source and/or sink of lattice dislocations and barriers for dislocation gliding. According to the experi-mental evidence provided by Chou,38) who measured mis-orientation-dependent grain boundary hardening using a microhardness technique, plastic deformation can take place more readily in the vicinity of boundary than random boundary because the boundary showed lower grain boundary hardening and made a cusp on the hardness-misorientation curve. Therefore, it is feasible that the relaxation of the stress concentration at the R2 or R3 type triple junctions is more difficult than other types and then the cavitation preferentially occur. Therefore it is worth to note that the control of the frequency and the connectivity of random boundaries are of great importance to develop superplasticity and prevent from cavitation in polycrystalline material.
[image:8.595.322.530.72.230.2]Fig. 9 SEM micrograph of Type A specimen deformed to 253%, showing cavitation at triple junctions and character of grain boundaries.
[image:8.595.55.285.620.758.2]3.6 High temperature deformation mechanism in the Al–Li alloy
The activation energies for superplastic deformation obtained from the peak stress and the steady state stress were Qp¼130kJ/mol and Qs¼170kJ/mol, respectively, for the Type A specimen. The former value is close to the activation energies for self-diffusion of Al (140 kJ/mol) and for intrinsic diffusion of Li (126 kJ/mol), Cu (135 kJ/mol) and Mg (130 kJ/mol) in Al.39)Moreover, the density of disloca-tions in the grain interior, which were transformed into low-angle boundaries, was rather high at the peak stress shown in Fig. 6(b) (iii). Therefore, the deformation at the peak stress is controlled by grain boundary sliding accommodated by dislocation climb or dislocation slip dragging solute atmo-sphere. The activation energy for the steady state deforma-tion became larger than the energy for deformadeforma-tion at the transient state. At the steady state, about 70% of grain boundaries were random boundary type. It is likely that the larger activation energy obtained at the steady state arose from grain boundary migration to relax the stress concentra-tion due to grain boundary sliding. In fact, it was reported that the activation energy for grain boundary migration often exceeded the energy for bulk self-diffusion.40–42)
Puet al.4)reported the activation energies for superplastic deformation in Al–Li alloy (8090 alloy) as 92 kJ/mol at the lower temperatures region (from 623 K to 723 K), and 141 kJ/ mol at the higher temperature region (from 783 K and 813 K). They supposed that superplastic deformation was controlled by grain boundary sliding and dislocation slip in the lower temperature region and by grain boundary sliding accom-modated by dislocation climb in the higher temperature region. It was also reported that the activation energy for high temperature deformation in dispersion-strengthened alloy was greater than that for diffusion owing to the existence of threshold stress for dislocation motion.43) This is a most probable reason for the origin of high activation energy obtained for the Type B specimen, suggesting that dislocation slip is a rate controlling mechanism.
3.7 The optimization of GB microstructure for cavita-tion control
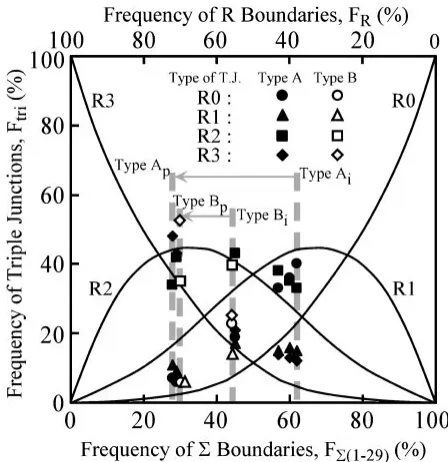
Figure 11 shows the relationship between the GBCD and the triple junction character distribution (TJCD). These data were obtained from the microstructure of rolling surface of the Type A and Type B specimens. The frequencies of boundaries were analyzed by the number of grain boundaries. The suffixes i and p in this figure indicate the initial microstructure and post-deformed microstructure (fractured specimen). The solid lines represent the results from a probability analysis by Fortier et al.35)The experimentally obtained results almost agree with the probability analysis. The frequency of the R0 type triple junctions increased monotonously with increasing the frequency of bound-aries. In contrast, the frequency of the R3 type decreased with increasingboundaries. The frequencies of the R1 and R2 type junctions showed a maximum value at a certain level of boundaries. Strictly speaking, however, the absolute values of experimental results were deviated from the probability analysis to some extent. This discrepancy may come from the heterogeneity of grain boundary character
distribution in a sample. That is, the probability analysis was made on the assumption that boundaries were homo-geneously distributed in a polycrystalline material. In real polycrystalline materials, however, the GBCD are locally different from place to place. Heterogeneity in GBCD causes deformation to be heterogeneous. Therefore, it is required to introduce a homogeneous GBCD for developing superplas-ticity as well.
Furthermore, the GBCDs at the fracture were almost the same, as characterized by the frequency ofboundaries of 30%, in both the Type A and Type B specimens, although the initial GBCDs of the Type A and Type B specimens were different. Moreover, the total frequency of the R2 and R3 type triple junctions which can be preferential sites for cavitation, showed the maximum value of 80%, when the frequency ofboundaries was 30%. This finding means that a large amount of random boundaries does not necessarily lead to superplasticity. Therefore, it is of great importance to optimize the frequencies of random boundaries and of the R2 and R3 type triple junctions for improvement in super-plasticity. Considering these results together, we can con-clude that an increase of the R1 type junction yields an enhancement of superplasticity. The optimal value of the frequency ofboundaries for superplasticity is supposed to be 60%–70%.
3.8 Improvement in superplasticity by strain rate change test
[image:9.595.313.537.70.301.2]From the results of the previous section, we have an insight into the improvement in superplasticity. According to the result shown in Fig. 11, if we can introduce dislocations in grain interior during deformation, particularly in the work-softening regime where low-angle grain boundaries change into random boundaries, the introduced dislocations may form low-angle boundaries, which result in a decrease in the frequency of random boundaries as well as a decrease in the grain size. If this phenomenon happens, damaged grain
boundary microstructure can be rejuvenated to some extent. Thus, further cavitation may be suppressed and an increase in superplastic elongation is expected. In order to confirm the assumption mentioned above, strain rate change tests were carried out during superplastic deformation.
Figure 12 shows the stress-strain curves at 723 K where the strain rates were changed from 2:5104s1 to 1:0 103s1 at a specific duration of deformation. For compar-ison, stress-strain curves of strain rate constant tests are shown by thin broken lines. Bold dotted line shows the result of strain rate change test carried out at1:0103s1 from
"¼0 to"¼0:11in strain and then at2:5104s1 after
"¼0:11. The elongation of 224% was obtained in this case, and this value was smaller than the elongation at strain rate constant test at 2:5104s1 (253%). Bold broken line shows the stress-strain curve at the following condition; initially deformed at 2:5104s1 and then at 1:0 103s1 in the strain ranging from "¼0:34 to "¼0:37 (work softening regime), finally strain rate was returned to 2:5104s1. In this case, the elongation of 258% was obtained, and this value was slightly larger than the elongation at strain rate constant test at2:5104s1. Both of black and gray solid lines show the stress-strain curves at the following condition; the specimens were deformed at initial strain rate of 2:5104s1 and then at a faster rate 1:0103s1 in the strain ranging from "¼0:34 to "¼ 0:50(work softening stage), then the strain rate was returned to2:5104s1. The elongation obtained in this condition were 284% and 278%, and these elongation are about 30% larger than the elongation at the strain rate constant test at 2:5104s1. Those results supported our prediction.
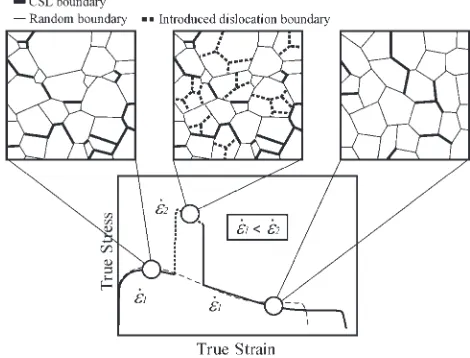
Figure 13 illustrates a probable evolution of grain boundary microstructure by strain rate change during deformation. In the cross head speed constant test as shown in Fig. 6(b) and (c), dislocations introduced in the grain interior before the peak stress are absorbed into grain boundaries, and the frequency of random boundaries in-creases. In the strain rate change test, however, a larger number of dislocations further introduced by an increase of strain rate in the work softening regime are not only absorbed into grain boundaries, but also form low-angle boundaries, and thereby the relative frequency of low-angle boundaries
increases. Accordingly, since the frequency of the R2 and R3 type triple junctions can decrease and the average grain size decreases, the propensity to cavity nucleation and growth are reduced and the larger superplastic elongation can be obtained. Moreover, the longer became the duration of high strain rate deformation in the work softening regime, the larger elongation of the specimen was produced. These results suggest that the existence of the optimum duration of high strain rate deformation.
We have found that the superplastic elongation and the soundness of superplastically deformed material with lower density of cavities can be improved by controlling grain boundary microstructures.
4. Conclusions
The effects of grain boundary microstructures on super-plasticity of an Al–Li based alloy were studied by using the specimens whose grain boundary microstructures were quantitatively analyzed by OIM before mechanical testing. The conclusions obtained are as follows.
[image:10.595.61.278.71.240.2](1) The Al–Li alloy polycrystalline specimen (Type A) which had a uniform grain structure and sharp texture with a high frequency of low angle boundaries showed superplastic behaviour with the total elongation of 253%. Elongated coarse grains which existed in the cross section parallel to rolling direction before defor-mation were found to be divided into equiaxed grains during superplastic deformation. During superplastic deformation, low-angle boundaries changed into high angle random boundaries, and the sharpness of {110} texture became weaker. The frequency of random boundaries increased to almost twice from 37% to 72%. (2) The microstructural evolution in the Type A specimen, which showed superplasticity, primarily occurred in the work softening regime beyond the peak stress. On the other hand, the Type B specimens which had a heterogeneous initial grain structure and a high fre-quency of random boundaries showed small fracture strain at strain rates ranging from 1104s1 to 5103s1 and in the temperature range from 673 to Fig. 13 Schematic illustration for rejuvenation of grain boundary
[image:10.595.308.543.75.254.2]micro-structure for improvement in superplasticity. Fig. 12 Demonstration of the improvement in superplasticity by a strain
723 K.
(3) Cavitation in the Type A specimen which showed more significant superplasticity, occurred markedly in the work softening regime in which the low-angle bound-aries transformed into random boundbound-aries. Cavitation preferentially occurred at triple junctions where two or more random boundaries were connected. Since the frequency of each type of triple junction is predicted by the relationship between the grain boundary character distribution (GBCD) and the triple junction character distribution (TJCD), the possibility of improving super-plasticity can be predicted from a viewpoint of the control of intergranular cavitation by controlling the grain boundary character distribution (GBCD). (4) Superplasticity has been found to be improved by
increasing strain rate in the work softening regime of deformation. This resulted from a decrease in the frequency of triple junctions composed of more random boundary, at which cavities were preferentially formed, through an increase of the frequency of low-angle boundaries formed by rearrangement of dislocations newly introduced by increasing the strain rate.
Acknowledgments
The authors would like to express their hearty thanks to Dr. H. Haji, Kyushu Matsushita Electric Co., Ltd., for the preparation of tensile jigs for mechanical testing. The present work was financially supported by the Grant-in-aid for Scientific Research on the priority area ‘‘Innovation in Superplasticity’’ (08242101), Grant-in-aid for Scientific Research (B) (08405046) and Grant-in-aid for COE Research of the Ministry of Education, Science, Sports and Culture, Japan.
REFERENCES
1) E. A. Starke, Jr., T. H. Sanders, Jr. and I. G. Palmer: J. Metals33(1981) 24–33.
2) F. S. Lin, S. B. Chakrabortty and E. A. Starke, Jr.: Metall. Trans.13A
(1982) 401–410.
3) D. Dew-Hughes, E. Creed and W. S. Miller: Mater. Sci. Tech.4(1988) 106–112.
4) H. P. Pu, F. C. Liu and J. C. Huang: Metall. Trans.26A(1995) 1153– 1166.
5) L. Qing, H. Xiaoxu, Y. Mei and Y. Jinfeng: Acta Metall.40(1992) 1753–1762.
6) W. Fan, M. C. Chaturvedi, N. C. Goel and N. L. Richards: Mater. Sci. Forum243–245(1997) 563–568.
7) H. Garmestani, P. Kalu and D. Dingley: Mater. Sci. Eng.A242(1998) 284–291.
8) G. Avramovic-Cingara, K. T. Aust, D. D Perovic and G. Palumbo: Recent Developments in Light Metals, Proc. of the International
Symposium on Recent Development in Light Metals, (Toronto, Ontario, 1994) pp. 281–291.
9) T. K. Ha and Y. W. Chang: Mater. Sci. Forum243–245(1997) 505– 510.
10) V. Randle: Acta Metall. Mater.43(1995) 1741–1749.
11) S. J. Hales and T. R. Mcnelley: Acta Metall.36(1988) 1229–1239. 12) J. Liu and D. J. Chakrabarti: Acta Mater.44(1996) 4647–4661. 13) T. Yamazaki, Y. Mizuno, T. Furuhara and T. Maki: Mater. Sci. Forum
304–306(1999) 127–132.
14) H. Kokawa, T. Watanabe and S. Karashima: Philos. Mag.A44(1981) 1239–1254.
15) T. Watanabe, S. Kimura and S. Karashima: Philos. Mag.A49(1984) 845–864.
16) M. F. Ashby and R. A. Verrall: Acta Metall.21(1973) 149–163. 17) R. C. Gifkins: Metal. Trans.7A(1976) 1225–1232.
18) D. M. R. Taplin, G. L. Dunlop and T. G. Langdon: Ann. Rev. Mater. Sci.9(1979) 151–189.
19) T. Watanabe: Metal. Trans.14A(1983) 531–545.
20) J. B. Brosse, R. Fillit and M. Biscondi: Scr. Metall.15(1981) 619–623. 21) H. Kurishita, S. Kuba, H. Kubo and H. Yoshinaga: Trans. Japan Inst.
Metals26(1985) 332–340.
22) H. Kurishita, A. Oishi, H. Kubo and H. Yoshinaga: Trans. Japan Inst. Metals26(1985) 341–352.
23) S. Tsurekawa, T. Tanaka and H. Yoshinaga: Mater. Sci. Eng.A176
(1994) 341–348.
24) W. Bollmann: Philos. Mag.A49(1984) 73–79. 25) W. Bollmann: Philos. Mag.A57(1988) 637–649. 26) T. Watanabe: Mater. Sci. Eng.A176(1994) 39–49.
27) C. Sigli and J. M. Sanchez: Acta Metall.34(1986) 1021–1028. 28) M. Hansen:Constitution of Binary Alloys 2nd edition, (Metallurgy and
Metallurgical Engineering Series, McGraw-Hill, 1958) pp. 153. 29) D. J. Dingley and K. Baba-Kishi: Scanning Electron Microscopy Vol. ii
(1986) 383–391.
30) B. L. Adams, S. I. Wright and K. Kunze: Metall. Trans.24A(1993) 819–831.
31) A. M. Hammad and K. K. Ramadan: Z. Metallkde.80(1989) 178–185. 32) H. Yoshinaga: Mater. Trans. Japan Inst. Metals34(1993) 635–645. 33) H. Fujiwara and K. Ameyama: J. Japan Inst. Metals63(1999) 187–195. 34) T. Watanabe, T. Hirano, T. Ochiai and H. Oikawa: Mater. Sci. Forum
157–162(1994) 1103–1108.
35) P. Fortier, W. A. Miller and K. T. Aust: Acta Mater.45(1997) 3459– 3468.
36) P. Fortier, K. T. Aust and W. A. Miller: Acta Metall. Mater.43(1995) 339–349.
37) P. H. Pumphrey: Grain Boundary Structure and Properties, ed. by G. A. Chadwick and D. A. Smith, (Academic Press, London, 1976) pp. 180–184.
38) Y. T. Chou, B. C. Cai, A. D. Roming Jr. and L. S. Lin: Philos. Mag.47
(1983) 363–368.
39) Ed. H. Mehrer:Diffusion in Solid Metals and Alloys, (Numerical Data and Functional Relationship in Science and Technology, Vol. 26, Springer, 1990) pp. 151–153.
40) L. Raymond and J. E. Dorn: Trans. Met. Soc. AIME.230(1964) 560– 567.
41) G. Gottstein and L. S. Shvindlerman: Scr. Metall. Mater.27(1992) 1515–1520.
42) M. Furtkamp, P. Lejcˇek and S. Tsurekawa: Interface Science6(1998) 59–66.