Hydrogen Internal Friction Peak in Amorphous Zr Cu Al Si Alloys
8
0
0
Full text
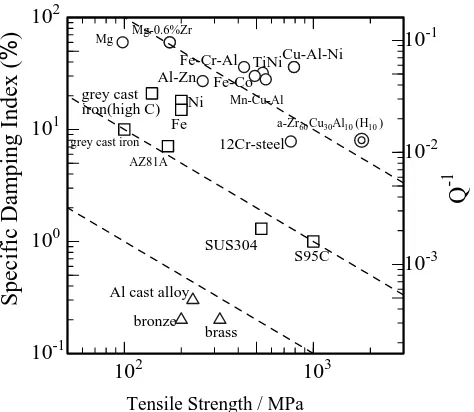
(2) Hydrogen Internal Friction Peak in Amorphous Zr–Cu–Al–Si Alloys. diffusion in a-alloys decreases with increasing hydrogen concentration, C H , for most cases. The fact that the Tp vs. Q −1 p data observed for various a-alloys fall on the limited regions suggest that the local atomic structures observed by a hydrogen atom are not so different among the various aalloys which can store hydrogen in solution as mentioned in Ref. 15). On the other hand, as mentioned in Ref. 15), Tp and Q −1 p of the HIFP in a-Zr50 Cu50 12) and a-Zr40 Cu60 16) are, in general, higher than those found in the high Tp group. A recent work on the hydrogenated a-Ti50 Cu50 and aZr50 Cu50 indicates that the local strain around a hydrogen atom in the a-alloys is highly anisotropic.17) This fact may be responsible for the high-Q −1 p found for the HIFP in Zr50 Cu50 and Zr40 Cu60 a-alloys, and provide the evidence that the stress-induced redistribution of hydrogen atoms gives rise the HIFP in the a-alloys. Then one may expect that the Zr–Cu aalloys are potential materials with the high-strength and high−2 damping performance, because Q −1 p falls in the range of 10 and Tp may be tailored by a control of diffusion rate of hydrogen atoms. As the first step, we investigated the HIFP in one of new metallic glasses, a-Zr60 Cu30 Al10 18) as shown in Fig. 11) and that in a-Zr40 Cu50 Al10 . It is found that Tp is higher for aZr40 Cu50 Al10 than for a-Zr60 Cu30 Al10 . The fact that the HIFP in the a-alloys is observed as a very broad peak indicates that the redistribution of hydrogen atoms for the anelastic relaxation may take place by migrations of hydrogen atoms threading through various tetrahedral sites.19–22) That is, in the latertransition-metal/early-transition-metal a-alloy, a-Az B1−z , the maximum hydrogen content in the Am B4−m tetrahedral sites, ∆C z,m , may be given by, ∆C z,m = f 0 [4!/m!(4 − m)!]z m (1 − z)4−m. (1). where the alloys are assumed to be structurally isomorphic and chemically random and f 0 = 1.6 at z = 0.5.21) Equation (1) predicts that most of hydrogen atoms may occupy the Zr4 sites in the C H range below about 20 at% for a-Zr60 Cu30 Al10 and below about 4 at% for a-Zr40 Cu50 Al10 . After eq. (1), the representative migration path of hydrogen atoms responsible for Tp inevitably threads through the (Cu and Al)4 sites in a-Zr40 Cu50 Al10 but it is not the case in aZr60 Cu30 Al10 at the low C H range. It is reported that the HIFP in a-Pd–Si is associated with reorientation of hydrogen atoms trapped by silicon atoms.10) We surmise that Tp of the HIFP in a-Zr40 Cu50 Al10 may be tailored by addition of silicon to the a-alloy. In the present paper, we pursued this issue. For the anelastic reorientation relaxation of hydrogen in a-alloys, however, the underlying process is only partly understood as yet.2–16) One reason is that the observed relationship between Tp and C H and that between Q −1 p and C H show variety among various a-alloys, suggesting that the detailed anelastic process for the HIFP is a function of the chemical composition of a-alloys. For the later-transition-metal/earlytransition-metal a-alloys, the anelastic reorientation of hydrogen atoms sitting in tetrahedral sites may be responsible for the HIFP.5, 7, 8, 11, 12) Since the HIFP in the later-transitionmetal/early-transition-metal a-alloys is, in general, observed as a very broad peak, the relaxation time, τ , for the anelastic. 2663. process should have a wide distribution. One may, however, define the representative relaxation time which explains Tp of the HIFP as, 1/τ = 1/τ0 exp(−E/kT ),. (2). where 1/τ0 is the frequency factor, E is the activation energy, k is the Boltzmann factor and T is temperature. A value of 1/τ0 reported for the HIFP in a-Zr60 Ni40 ,9) a-Ti50 Cu50 ,11) aZr50 Cu50 ,12) and a-Zr40 Cu60 16) is as high as 1014 –1016 s−1 , suggesting that a migration distance of hydrogen atoms for the HIFP may be the order of atomic distance, and the entropy factor for the migration may not be negligible in the a-alloys. As already mentioned, however, a migration distance of hydrogen atoms for the HIFP in a-Zr40 Cu50 Al10 appears to be longer than that in a-Zr60 Ni40 , a-Ti50 Cu50 , a-Zr50 Cu50 , and aZr40 Cu60 . This issue is also important for tailoring Tp of the HIFP, and pursued here too. 2. Experimental Amorphous (a-) Zr60 Cu40−y Al y (y = 0, 10), a-Zr50 Cu50 , a-Zr40 Cu60 and a-Zr40 Cu50−x Al10 Six (x = 0, 1, 3) alloy ribbons about 30 µm thick and 1 mm wide were prepared by melt spinning in a high-purity Ar gas atmosphere and checked by the conventional θ − 2θ scan X-ray diffraction using the Cu–Kα radiation. The specimen surfaces are polished mechanically in water avoiding heating up during polishing to remove a surface layer and to smooth out. Hydrogen charging was made electrolytically in 0.1 N H2 SO4 at RT. A hydrogen charged specimen was aged for one day to a few days in the temperature range between 300 K and 330 K to homogenize the hydrogen distribution in the specimen. The internal friction, Q −1 , was measured in the temperature range between 80 K and 380 K by means of the vibrating reed method working at about 200 Hz and strain amplitude of 10−6 . The internal friction measurements were conducted for all the aalloy specimens mentioned above in order to pursue the relationship between the anelastic process for the HIFP and the chemical composition of a-alloys. On the other hand, tensile tests of a-alloy specimens were made for a-Zr60 Cu30 Al10 and a-Zr40 Cu50−x Al10 Six (x = 0, 1, 3) specimens to pursue the high-strength performance. Tensile tests were conducted at RT by using a hand made apparatus oriented for a thin tape which is similar to the tensile test apparatus reported in Ref. 23). After the Q −1 measurements or the tensile tests, the specimen was subjected to the thermal degassing in a vacuum to measure the hydrogen concentration, C H , where the calibration of thermal degassing was made by using commercial TiH2 powder. See Ref. 16) for details of the thermal degassing. 3. Results Figure 2 shows examples of the X-ray diffraction (XRD) spectra observed for a-Zr40 Cu49 Al10 Si1 and aZr40 Cu47 Al10 Si3 in the as-quenched state. The detection of the XRD reflections from crystalline (c-) Si, Zr5 Si3 , CuZr2 Si4 and unknown c-phase(s) for the a-Zr40 Cu47 Al10 Si3 specimen indicates that the addition of silicon by 3% decreases considerably the glass forming ability of a-Zr40 Cu50 Al10 . In con-.
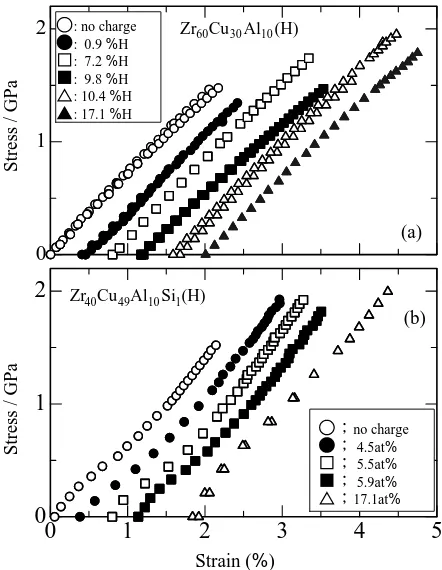
(3) 2664. H. Mizubayashi, Y. Ishikawa and H. Tanimoto. 50000 counts. Stress / GPa. 2 3 2 1. a-Zr40Cu49Al10 Si1. Intensity. 2. 2. 1: c-Si 2: c-Zr5 Si 3 3: c-CuZr2 Si4. : no charge : 0.9 %H : 7.2 %H : 9.8 %H : 10.4 %H : 17.1 %H. Zr60Cu 30 Al10 (H). 1. (a). 0. 2. 2. Zr40Cu 49Al10 Si1(H). (b). 30. 40. 50. 60. 2 Fig. 2 The XRD spectra observed for a-Zr40 Cu49 Al10 Si1 and a-Zr40 Cu47 Al10 Si3 . Vertical arrows 1 to 3 denote the 2θ values of the XRD reflections expected for crystalline Si, Zr5 Si3 and CuZr2 Si4 , respectively.. Stress / GPa. a-Zr40 Cu 47Al10Si 3. 1. 0 0. heating rate = 1 K/s. no charge 4.5at% 5.5at% 5.9at% 17.1at%. 1. 2. 3. 4. 5. -dC H /dt (arbitrary unit). Strain (%) Zr60Cu 30 Al10 CH = 13.2 at%. Fig. 4 Examples of the tensile tests of (a) a-Zr60 Cu30 Al10 1) and (b) a-Zr40 Cu49 Al10 Si1 specimens at RT before or after hydrogen charging.. Zr40 Cu 50 Al10 CH = 13.0 at%. Zr40 Cu 49 Al10 Si1 CH = 13.4 at%. 400. 600. 800. 1000. T/K Fig. 3 Examples of the thermal degassing spectrum observed for the hydrogen charged a-Zr60 Cu30 Al10 , a-Zr40 Cu50 Al10 and a-Zr40 Cu49 Al10 Si1 specimens.. trast, no detection of a crystalline phase for a-Zr40 Cu49 Al10 Si1 can be seen in Fig. 2. Figure 3 shows examples of the thermal degassing spectrum observed for the hydrogen charged a-Zr60 Cu30 Al10 , aZr40 Cu50 Al10 and a-Zr40 Cu49 Al10 Si1 specimens, where C H is about 13 at%. The hydrogen thermal degassing (HTD) from the a-Zr60 Cu30 Al10 specimen with C H of 13.2 at% is observed above about 800 K after the crystallization, where the HTDs from α-Zr and Zr hydrides16) are expected. The thermal degassing spectrum from the a-Zr40 Cu50 Al10 specimen with C H of 13.2 at% and that from the a-Zr40 Cu49 Al10 Si1 specimen with C H of 13.4 at% are similar to that observed for aZr40 Cu60 specimen with comparable C H ,16) where the HTD around 640 K (the HTD around 660 K with the heating rate of 1.4 K/s in Ref. 16) is surmised that from one part of the Zr4. sites in the a-alloys. No HTD around 640 K observed for the a-Zr60 Cu30 Al10 specimen indicates that the site energy for hydrogen of the Zr4 sites in the a-Zr60 Cu30 Al10 specimen with C H of 13.2 at% is comparable with the enthalpy of solution in α-Zr (−64 kJ/mol H).16) It is noted that after eq. (1), the Zr4 sites in a-Zr60 Cu30 Al10 can store hydrogen by 20.7 at%, and the Zr4 and Zr3 (Cu, Al)1 sites in a-Zr40 Cu50 Al10 can store hydrogen by 4.1 at% and 24.5 at%, respectively. Figures 4(a) and (b) show examples of the tensile tests of a-Zr60 Cu30 Al10 and those of a-Zr40 Cu49 Al10 Si1 specimens at RT before or after hydrogen charging, respectively. For aZr60 Cu30 Al10 specimens, strain shows a nonlinear increase with increasing stress and the feature of the stress vs. strain curve remains unchanged after hydrogen charging for C H below 20 at%. The fracture strength, σf , of a-Zr60 Cu30 Al10 specimens increases, in general, with increasing C H . For aZr40 Cu49 Al10 Si1 , the stress vs. strain data show an inverseS like curve and the feature of the stress vs. strain curve remains unchanged after hydrogen charging for C H below 20 at%. It is not shown here but the inverse-S like stress vs. strain curve is commonly observed for a-Zr40 Cu50−x Al10 Six (x = 0, 1, 3). Figure 5 shows σf of a-Zr60 Cu30 Al10 1) and aZr40 Cu50−x Al10 Six (x = 0, 1, 3) as a function of C H . For C H below 20 at%, σf of a-Zr60 Cu30 Al10 , a-Zr40 Cu50 Al10 and aZr40 Cu49 Al10 Si1 are similar to each other, where σf increases from about 1.5 GPa in the as quenched state to about 2 GPa at C H of 20 at%. On the other hand, σf of a-Zr40 Cu47 Al10 Si3 is lower by about 0.5 GPa than σf of other a-alloys mentioned above, probably due to precipitation of c-Si, c-Zr5 Si3 and cCuZr2 Si4 . In other words, dissolved Si of 1% hardly modifies the mechanical property of a-Zr40 Cu50 Al10 . The σf data shown in Fig. 5 indicate that a-Zr60 Cu30 Al10 , a-Zr40 Cu50 Al10.
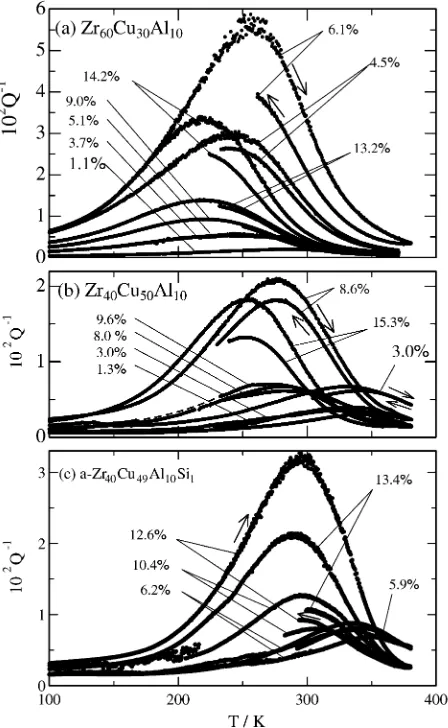
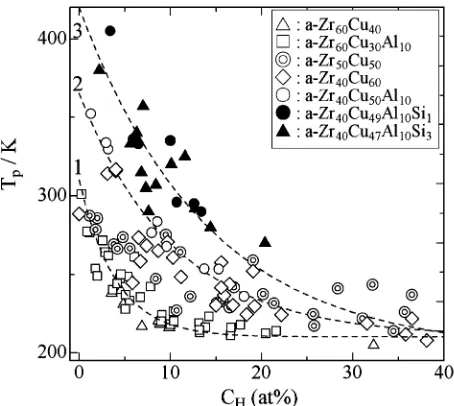
(4) Hydrogen Internal Friction Peak in Amorphous Zr–Cu–Al–Si Alloys. 2665. f. / GPa. 2. 1 Zr 60 Cu30 Al 10 Zr 40 Cu50 Al 10 Zr 40 Cu49 Al 10 Si1 Zr 40 Cu47 Al 10 Si3. 0. 0. 10. 20. C H (at%) Fig. 5 The fracture strength, σf , of a-Zr60 Cu30 Al10 ,1) a-Zr40 Cu50 Al10 , a-Zr40 Cu49 Al10 Si1 and a-Zr40 Cu47 Al10 Si3 observed at RT is plotted against C H .. and a-Zr40 Cu49 Al10 Si1 specimens show the high-strength performance mentioned in Fig. 1 for C H below 20 at%. In other words, the elastic strain attained before the fracture of the specimens is about 2% in the as quenched state and tends to increase after hydrogen charging for C H below 20 at% (see Fig. 4). On the other hand, the elastic strain attained before the fracture of the specimens decreases after hydrogen charging for C H beyond several tens at%, i.e., these a-alloys become brittle for C H beyond several tens at% (not shown here). Figures 6(a) to (c) show examples of the HIFP observed in a-Zr60 Cu30 Al10 ,1) a-Zr40 Cu50 Al10 1) and a-Zr40 Cu49 Al10 Si1 specimens, respectively, where the measurement frequency is about 200 Hz. It is noted that the aging temperature after hydrogen charging was about 330 K for a-Zr60 Cu30 Al10 and aZr40 Cu50 Al10 and about 300 K for a-Zr40 Cu49 Al10 Si1 , respectively. As already mentioned, the HIFP in a-Zr–Cu(Al) is ob−2 served as a very broad peak with Q −1 p of the order of 10 , indicating that the high-damping performance can be expected in a wide temperature range more than 100 K. In Fig. 6(a), for a specimen with C H of 6.1 at%, a heating run from 80 to 380 K after hydrogen charging and a cooling run after heating −2 to 380 K are indicated by arrows, where Q −1 p of 5.5 × 10 observed in the as charged state decreases to about 4 × 10⁻² after heating to 380 K. In contrast, for a specimen with C H of −2 observed in the as charged state 13.2 at%, Q −1 p of 1.4 × 10 remains almost unchanged after heating to 380 K. As seen in Fig. 6(a), the higher the Q −1 p in the as charged state is, the −1 larger the decrease in Q p after heating to about 380 K is. The decrease in Q −1 p for the HIFP in a-Zr60 Cu30 Al10 is not due to degassing of hydrogen but due to the hydrogen induced structural relaxation (HISR) reported for a-Zr40 Cu60 .16) It is noted that an a-Zr60 Cu30 Al10 with C H of 4.5 at% has been annealed at 600 K for 2 hours in a vacuum prior to hydrogen charging. For the pre-annealed specimen with C H of 4.5 at%, although −2 Q −1 p in the as charged state is as high as 3×10 , a decrease in Q −1 p after heating to 380 K is smaller than for the as quenched specimens showing comparable Q −1 p , indicating that an effect of the HISR decreases in the pre-annealed specimen. The observed features for the HIFP in a-Zr40 Cu50 Al10 shown in Fig.. Fig. 6 Examples of the HIFP observed in (a) a-Zr60 Cu30 Al10 ,1) (b) a-Zr40 Cu50 Al10 1) and (c) a-Zr40 Cu49 Al10 Si1 specimens.. 6(b) are similar to those for the HIFP in a-Zr60 Cu30 Al10 except that Tp is higher for the HIFP in a-Zr40 Cu50 Al10 than in a-Zr60 Cu30 Al10 when they are compared at the same C H , −2 are found and no specimens showing Q −1 p beyond 4 × 10 in a-Zr40 Cu50 Al10 . The observed features for the HIFP in aZr40 Cu49 Al10 Si1 shown in Fig. 6(c) are similar to those for the HIFP in a-Zr40 Cu50 Al10 except that Tp is higher for the HIFP in a-Zr40 Cu49 Al10 Si1 than in a-Zr40 Cu50 Al10 when they are compared at the same C H . The decrease in Q −1 p due to the HISR during heating to 380 K is considerably larger for a-Zr40 Cu49 Al10 Si1 than for a-Zr40 Cu50 Al10 , because the aging temperature of about 300 K after hydrogen charging for a-Zr40 Cu49 Al10 Si1 is lower than that of about 330 K for aZr40 Cu50 Al10 . Q −1 p observed after heating to 380 K for aZr40 Cu49 Al10 Si1 is about 1 × 10⁻² for the C H range shown in Fig. 6(c). Figure 7 shows the Tp vs. C H data found for various a-Zr– Cu(Al, Si) alloys. Tp shows variety as a function of the chemical composition of a-alloys in the C H range below 20 at%, and decreases to about 220 K with increasing C H . The Tp vs. C H data shown in Fig. 7 may be classified into three groups, aZr40 Cu49 Al10 Si1 and a-Zr40 Cu47 Al10 Si3 as the high-Tp group, a-Zr40 Cu60 and a-Zr40 Cu50 Al10 as the intermediate-Tp group and a-Zr60 Cu40 , a-Zr60 Cu30 Al10 and a-Zr50 Cu50 as the low-Tp group. It is noted that Tp of the HIFP in a-Zr50 Cu50 is, in gen-.
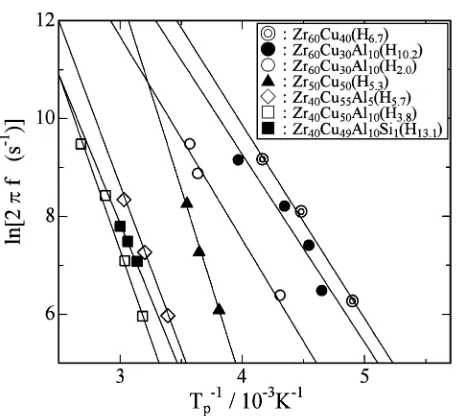
(5) 2666. H. Mizubayashi, Y. Ishikawa and H. Tanimoto Table 1 Relaxation parameters of the hydrogen internal friction peak. Specimen. 1/τ0∗1 (s−1 ). E ∗1 (eV∗2 ). Reference. a-Zr60 Cu40 (H6.7 ) a-Zr60 Cu30 Al10 (H10.2 ) a-Zr60 Cu30 Al10 (H2.0 ) a-Zr50 Cu50 (H5.3 ) a-Zr50 Cu50 (H5 –H20 ) a-Zr40 Cu60 (H5.7 –H20.9 ) a-Zr40 Cu55 Al5 (H5.7 ) a-Zr40 Cu50 Al10 (H3.8 ) a-Zr40 Cu49 Al10 Si1 (H13.1 ). 1.5 × 10¹¹. 0.34 0.33 0.36 0.68 0.72–0.63 0.73–0.58 0.56 0.59 0.47. present present present present (12) (16) present present present. 5.2 × 10¹⁰ 2.9 × 10¹⁰ 6.6 × 10¹⁵ 9 × 10¹⁶ 2.5 × 10¹⁴ 1.8 × 10¹² 1.5 × 10¹² 3.0 × 10¹⁰. ∗1 τ. 0 and E are a pre-exponential factor and the activation enthalpy for the relaxation time. ∗2 1 eV = 1.602 × 10⁻¹⁹ J.. 4. Discussion Fig. 7 The Tp vs. C H data found for various Zr–Cu(Al, Si) a-alloys, where the data found in a-Zr60 Cu40 and a-Zr60 Cu30 Al10 ,1) a-Zr50 Cu50 12) and a-Zr40 Cu60 16) are also shown.. eral, higher than that found in various a-alloys except a-Zr–Cu alloys,15) indicating that Tp of the HIFP in a-Zr40 Cu49 Al10 Si1 and a-Zr40 Cu47 Al10 Si3 shows a breakthrough for an elevation of Tp of the HIFP in a-alloys. Figures 8(a) to (d) show the Q −1 p vs. C H data found for a-Zr60 Cu40−y Al y (y = 0, 10),1) a-Zr50 Cu50 ,12) a-Zr40 Cu60 16) and a-Zr40 Cu50−x Al10 Six (x = 0, 1, 3), respectively. As seen in Fig. 8(a), one part of a-Zr60 Cu40−y Al y (y = 0, 10) speci−2 at the as charged mens show very high Q −1 p beyond 3 × 10 state. On the other hand, no specimens show Q −1 p beyond 3 × 10⁻² after aging at 350 K for 1 day following hydrogen charging (not shown here). In Fig. 8(a), the dashed line 1 is drawn to guide eyes for Q −1 p after the HISR below about appears to increase monotonously with increas380 K. Q −1 p ing C H for C H below 20 at%, where the maximum hydrogen content in the Zr4 tetrahedral sites in a-Zr60 Cu40−y Al y is estimated to be 20.7 at% after eq. (1). In contrast, for a-Zr50 Cu50 shown in Fig. 8(b), the Q −1 p vs. C H data shows a camel’s humps like change as a function of the site occupation mentioned for eq. (1) (see Ref. 12) for details). the Q −1 p vs. C H data for a-Zr40 Cu60 shown in Fig. 8(c) also appear to show a camel’s humps like change as a function of the site occupation mentioned for eq. (1).16) In contrast, the Q −1 p vs. C H data for a-Zr40 Cu50−x Al10 Six (x = 0, 1, 3) shown in Fig. 8(d) are similar to those for a-Zr60 Cu40−y Al y (y = 0, 10) shown in Fig. 8(a) rather than those for a-Zr40 Cu60 shown in Fig. 8(c), except that Q −1 p for a-Zr40 Cu47 Al10 Si3 is, in general, about one half of that for a-Zr40 Cu50−x Al10 Six (x = 0, 1). Figure 9 shows the Arrhenius plot for the HIFP observed in various a-alloys, and the relaxation parameters, 1/τ0 and E, determined are compiled in Table 1, where τ0 and E are a pre-exponential factor and the activation enthalpy for the relaxation time, respectively, and f is a measurement frequency. In Table 1, one can see that values of 1/τ0 found for a-Zr50 Cu50 and a-Zr40 Cu60 are as high as 1014 to 1016 s−1 , and those found for other a-alloys are of a value expected for a simple relaxation process.. Feasibility of the hydrogenated a-alloys as a high-strength and high-damping material will be discussed at first. The tensile test data shown in Fig. 5 indicate that σf increases from about 1.5 GPa in the as quenched state to about 2 GPa at C H of 20 at% for a-Zr60 Cu30 Al10 and a-Zr40 Cu50−x Al10 Six (x = 0, 1). The Q −1 performance required for the high σf range is about 1 × 10⁻² after Fig. 1. In Fig. 8(a) and −2 8(d), the Q −1 may be attained around p of about 1 × 10 C H of 10 at% for a-Zr60 Cu30 Al10 and a-Zr40 Cu50−x Al10 Six (x = 0, 1) specimens after HISR. Referring to Fig. 7, Tp at C H of 10 at% is 310 K, 270 K and 220 K with the measurement frequency, f , of about 200 Hz for a-Zr40 Cu49 Al10 Si1 , a-Zr40 Cu50 Al10 and a-Zr60 Cu30 Al10 , respectively. Since the HIFPs in a-Zr40 Cu49 Al10 Si1 , a-Zr40 Cu50 Al10 and aZr60 Cu30 Al10 are very broad as seen in Fig. 6(a) to (c), the working temperature range is several tens degrees around Tp . For the working frequency, the relaxation parameters listed in Table 1 give that values of Tp expected for f of 10 Hz and 100 kHz are 170 K and 339 K for a-Zr60 Cu30 Al10 (H10.2 ) and 273 K and 506 K for a-Zr40 Cu49 Al10 Si1 (H13.1 ), respectively. Values of Tp for a-Zr40 Cu50 Al10 (H10 ) may be intermediate between those mentioned for a-Zr60 Cu30 Al10 (H10.2 ) and a-Zr40 Cu49 Al10 Si1 (H13.1 ). These parameters indicate that the hydrogenated a-Zr40 Cu49 Al10 Si1 , a-Zr40 Cu50 Al10 and aZr60 Cu30 Al10 are a candidate as a high-strength and highdamping material with a tuned performance. Further, one may expect that a composite material composed of these aalloys can serve a high-damping performance in a wide temperature range or a wide frequency range. The physical properties other than the high-strength and high-damping performance will be discussed below. For most a-alloys, strain shows a nonlinear increase with increasing stress as mentioned for a-Zr60 Cu30 Al10 in Fig. 4(a), reflecting that the stress-induced internal rearrangement of atoms can be allowed.24, 25) It is believed that the amorphous structure of the a-alloy is composed of a low density region and a high density region reflecting the density fluctuation, and the stressinduced internal rearrangement of atoms started in the low density regions proceeds resulting in the nonlinear increase in strain with increasing stress.25) For most a-alloys, it is also believed that the stress-induced internal rearrangement of atoms.
(6) Hydrogen Internal Friction Peak in Amorphous Zr–Cu–Al–Si Alloys. 2667. 6 : a-Zr 50 Cu 50. : a-Zr60 Cu40 : a-Zr60 Cu30 Al10. 5. 3. 2'. -1. 10 Q p. 3. 2. 2. 2. 2. 10 Q p. -1. 4. 2 1. 1. (a). 1 0 0. 10. 20. (b) 0 0. 30. 10. 20. 30. C H (at%). C H (at%). : a-Zr 40 Cu 50 Al 10 : a-Zr 40 Cu 49 Al 10 Si 1 : a-Zr 40 Cu 47 Al 10 Si 3. 2. 2. 10 Q p. -1. 3. 1. 4 5 0 0. 10. (d) 20. 30. C H (at%) Fig.. Fig. 9. 8 The Q −1 vs. C H data p a-Zr40 Cu50−x Al10 Six (x =. observed for (a) a-Zr60 Cu40−y Al y (y = (b) a-Zr50 Cu50 ,12) (c) a-Zr40 Cu60 16) and (d) 0, 1, 3). The dashed lines 1, 4 and 5 are drawn to guide eyes. See Ref. 12) for the dashed lines 2 and 2 , and Ref. 16) for the dashed lines 3, 3 and 3 .. The Arrhenius plot for the HIFP observed in the various a-alloys.. proceeds to the shear band for further elevated stresses resulting in the plastic deformation.26) On the other hand, one may expect the saturation of the nonlinear increase in strain be-. 0, 10),1). low the elastic limit when the low density regions are isolated from each other. The inverse-S like stress vs. strain curves observed for a-Zr40 Cu50−x Al10 Six (x = 0, 1, 3) (see Fig. 4(b)) possibly suggest that the low density regions are embedded in the high density matrix for the amorphous structure of the alloys. Further speculation is, however, premature without more extended data. As mentioned for Fig. 7, Tp of the HIFP for a-Zr50 Cu50 and that for a-Zr40 Cu60 are, in general, higher than those found in the high Tp group compiled in Ref. 15), here aZr60 Cu40−y Al y (y = 0, 10) may be classified into the high Tp group in Ref. 15). On the other hand, Tp of the HIFP for a-Zr40 Cu50−x Al10 Six (x = 0, 1, 3) is higher than Tp for a-Zr50 Cu50 and a-Zr40 Cu60 . That is, one can see the following order, (Tp for a-Zr40 Cu50−x Al10 Six (x = 0, 1, 3))>(Tp for a-Zr50 Cu50 and a-Zr40 Cu60 )>(Tp for a-Zr60 Cu40−y Al y (y = 0, 10)), in the low C H range, and that Tp decreases to about 220 K with increasing C H . For the relaxation parameters in the low C H range listed in Table 1, 1/τ0 is comparable between a-Zr40 Cu50−x Al10 Six (x = 0, 1, 3) and a-Zr60 Cu40−y Al y (y = 0, 10) and E is higher for a-Zr40 Cu50−x Al10 Six (x = 0, 1, 3) than a-Zr60 Cu40−y Al y (y = 0, 10). We surmise that the characteristic amorphous structure supposed for a-.
(7) 2668. H. Mizubayashi, Y. Ishikawa and H. Tanimoto. Zr40 Cu50−x Al10 Six (x = 0, 1, 3) is responsible for the higher value of E, where the migration of hydrogen atoms for the HIFP around Tp takes place through the high density regions. For the effect of Si addition to a-Zr40 Cu50 Al10 , it is observed that 1/τ0 found for a-Zr40 Cu49 Al10 Si1 (H13.1 ) is lower than that for a-Zr40 Cu50 Al10 (H3.8 ). It is observed for the HIFP in a-Zr50 Cu50 12) and a-Zr40 Cu60 16) that 1/τ0 remains almost unchanged and E decreases with increasing C H . We surmise that the increase in Tp found for a-Zr40 Cu49 Al10 Si1 is mainly associated with the decrease in 1/τ0 . Such a decrease in 1/τ0 can be expected when trapping of hydrogen atoms occurs during migration of hydrogen atoms for the HIFP. However, a simple trapping of hydrogen atoms by Si atoms in solution may not explain the decrease in 1/τ0 observed, because C H of 10 at% is considerably higher than Si content of 1%. On the other hand, it can be seen that in Fig. −1 8(d), Q −1 p for a-Zr40 Cu47 Al10 Si3 is about one half of Q p for a-Zr40 Cu49 Al10 Si1 , and in Figs. 6(b) and (c), the HIFP is sharper for a-Zr40 Cu49 Al10 Si1 than a-Zr40 Cu50 Al10 . It is suggested that the amorphous structure of a-Zr40 Cu50−x Al10 Six (x = 0, 1, 3) is modified as a function of Si content. vs. C H data are a function of the chemical The Q −1 p composition of a-alloys as already reported,3–16) here aZr60 Cu40−y Al y (y = 0, 10) and a-Zr40 Cu50−x Al10 Six (x = 0, 1, 3) are birds of a feather, and a-Zr50 Cu50 and a-Zr40 Cu60 are another birds of a feather. For the HIFP due to the Snoek relaxation process,27) the relaxation strength, SH , may be given by, SH = (Ω M/9 kT ) · [(λ1 − λ2 )2 + (λ2 − λ3 )2 + (λ3 − λ1 )2 ] · C H,S ,. (3). where Ω is the mean atomic volume of an a-alloy, M denotes the Young’s modulus, and λ1 , λ2 and λ3 are the principal values of the strain ellipsoid for the elastic distortion around a hydrogen atom. C H,S denotes the hydrogen concentration associated with the HIFP, where C H,S ≤ C H . The = SH /2 is known for a single relaxrelationship of Q −1 p ation process. For a multiple or distributed relaxation pro−1 cess, the relationship of Q −1 p < SH /2 is expected, and Q p measures the constituent relaxation strength for a predominant process. As already mentioned for Fig. 8(a), one part of a-Zr60 Cu40−y Al y (y = 0, 10) specimens show very high −2 Q −1 at the as charged state, and the dashed p beyond 3 × 10 −1 line 1 drawn for Q p after the HISR below 380 K shows a moderate increase to about 1.5 × 10⁻² at C H of 20 at%. It is reported that a decrease in the specific volume due to the crystallization is as low as 0.3% for a-Zr60 Cu30 Al10 ,28) where interstices for the hydrogen sitting sites in for a-Zr60 Cu30 Al10 may be small. For such a case, one may expect that an elastic distortion around a hydrogen atom is as strong as resulting in very high Q −1 p , and brings about the HISR at an elevated temperature. The Q −1 p vs. C H data for a-Zr60 Cu30 Al10 after the HISR show that C H,S increases with increasing C H for C H below 20 at%. It is noted that a maximum hydrogen content in the Zr4 sites in a-Zr60 Cu30 Al10 is estimated as 20.7 at% after eq. (1), suggesting that most of hydrogen atoms are associated with the HIFP in the a-alloy. In contrast, as seen in −2 at the Fig. 8(b), Q −1 p for a-Zr50 Cu50 remains below 3 × 10. as charged state, and the Q −1 p vs. C H data shows a camel’s humps like change, where C H,S in eq. (3) is assumed to vary as a function of the site occupation.12) That is, the site energy of, e.g. the Zr4 sites, shows a distribution reflecting the fluctuation in the atomic structure, i.e. a Gaussian distribution, which hydrogen atoms occupy under nearest neighbor blocking. The camel’s humps like change can be explained by assuming that only hydrogen atoms sitting the sites with the site energy near the chemical potential can contribute to the HIFP. The Q −1 p vs. C H data for a-Zr40 Cu60 shown in Fig. 8(c) also appear to show a camel’s humps like change,16) except that one part of the specimens show very high Q −1 p be−2 −1 yond 3 × 10 . On the other hand, the Q p vs. C H data for aZr40 Cu50−x Al10 Six (x = 0, 1, 3) are similar to those found for a-Zr60 Cu40−y Al y (y = 0, 10) rather than those observed for aZr50 Cu50 and a-Zr40 Cu60 . It is suggested that the amorphous structure for a-Zr50 Cu50 and a-Zr40 Cu60 is different from that for a-Zr60 Cu40−y Al y (y = 0, 10) and a-Zr40 Cu50−x Al10 Six (x = 0, 1, 3). As already mentioned for Table 1, very high values for 1/τ0 are found for the HIFP in a-Zr50 Cu50 and aZr40 Cu60 , suggesting that the entropy factor in the hydrogen diffusion coefficient should be very high. We surmise that very high values for 1/τ0 and the camel’s humps like change found for a-Zr50 Cu50 and a-Zr40 Cu60 reflect the characteristics of the amorphous structure in the a-alloys. Further work is now in progress to pursue this issue. 5. Conclusion We investigated the HIFP in a-Zr60 Cu40−y Al y (y = 0, 10), a-Zr50 Cu50 , a-Zr40 Cu60 and a-Zr40 Cu50−x Al10 Six (x = 0, 1, 3). The tensile strength, σf , of a-Zr60 Cu40 Al10 , aZr40 Cu50 Al10 and a-Zr40 Cu49 Al10 Si1 increases from about 1.5 to 2 GPa with increasing C H to 20 at%. One part of aZr60 Cu40 Al10 , a-Zr40 Cu50 Al10 and a-Zr40 Cu49 Al10 Si1 speci−2 in the as hydromens show very high Q −1 p beyond 3 × 10 gen charged state, where the HISR proceeds above RT, suggesting that the elastic strain around hydrogen atoms is very large in the a-alloys in the as-charged state. Q −1 p after the HISR shows a moderate increase with increasing C H , about 1 × 10⁻² at C H of 10 at%, suggesting that a-Zr60 Cu30 Al10 (H), a-Zr40 Cu50 Al10 (H) and a-Zr40 Cu49 Al10 Si1 (H) after the HISR are potential materials with a high-strength and high-damping performance. Tp at 10 at%H is 310 K, 270 K and 220 K with the measurement frequency of about 200 Hz for aZr40 Cu49 Al10 Si1 , a-Zr40 Cu50 Al10 and a-Zr60 Cu30 Al10 , respectively. It is indicated that Tp found for a-Zr40 Cu49 Al10 Si1 shows a breakthrough for an elevation of Tp of the HIFP in a-alloys, and that a composite material composed of these aalloys can serve a high-damping performance in a wide temperature range or a wide frequency range. The Q −1 p vs. C H data shows a camel’s humps like change for a-Zr50 Cu50 and a-Zr40 Cu60 , suggesting that only one part of hydrogen atoms can contribute to the HIFP. In contrast, Q −1 p shows a monotonous increase with increasing C H for C H below 20 at% for a-Zr60 Cu40−y Al y (y = 0, 10) and aZr40 Cu50−x Al10 Six (x = 0, 1, 3), suggesting that most of hydrogen atoms are associated with the HIFP in the a-alloys. For the relaxation parameters of the HIFP, values of 1/τ0.
(8) Hydrogen Internal Friction Peak in Amorphous Zr–Cu–Al–Si Alloys. fall in the range expected for a simple relaxation process for a-Zr60 Cu40−y Al y (y = 0, 10) and a-Zr40 Cu50−x Al10 Six (x = 0, 1, 3), but are extremely high for a-Zr50 Cu50 and aZr40 Cu60 . As already mentioned, the addition of 1 at% Si to a-Zr40 Cu50 Al10 causes a drastic increase in Tp . These results are discussed in the light of the amorphous structures in the a-alloys. Acknowledgments This work is partly supported by “New Protium Function in sub-nano Lattice Matters” research project of a Grant in Aid for Scientific Research from the Ministry of Education, Science and Culture of Japan, and High Damping Materials Project of “Research for the Future” of Japan Society for the Promotion of Science. REFERENCES 1) H. Mizubayashi, S. Murayama and H. Tanimoto: J. Alloys Comp. 330– 332 (2002) 389–392. 2) B. S. Berry, W. C. Pritchet and C. C. Tsuei: Phys. Rev. Lett. 41 (1978) 410–413. 3) B. S. Berry and W. C. Pritchet: J. de Physique 42 (1981) C5–1111– 1122. 4) O. Yoshinari, M. Koiwa, A. Inoue and T. Masumoto: Acta Metall. 31 (1983) 2063–2072. 5) U. Stolz, M. Weller and R. Kirchheim: Scr. Metall. 20 (1986) 1361– 1366. 6) B. S. Berry and W. C. Pritchet: Hydrogen in Disordered and Amorphous Solids, Ed. G. Bambakidis and R. C. Bowman, Jr. (Plenum Press, 1986) pp. 215–236. 7) U. Stolz: J. Phys. F 17 (1987) 1833–1845.. 2669. 8) H. Mizubayashi, Y. Katoh and S. Okuda: Phys. Status. Solidi (a) 104 (1988) 469–485. 9) B. S. Berry and W. C. Pritchet: Mater. Sci. Engng. 97 (1988) 419–425. 10) B. S. Berry and W. C. Pritchet: Z. Phys. Chem. Neue Folge 163 (1989) 381–390. 11) H. Mizubayashi, H. Agari and S. Okuda: Phys. Status. Solidi (a) 122 (1990) 221–233. 12) H. Mizubayashi, T. Naruse and S. Okuda: Phys. Status. Solidi (a) 132 (1992) 79–90. 13) H.-R. Sinning: Phys. Status. Solidi (a) 140 (1993) 97–108. 14) V. A. Khonik and L. V. Spivak: Acta Metall. 44 (1996) 367–381. 15) H.-R. Sinning: J. Alloys Comp. 310 (2000) 224–228. 16) M. Matsumoto, H. Mizubayashi and S. Okuda: Acta Metall. Mater. 43 (1995) 1109–1117. 17) H. Mizubayashi, M. Shibasaki and S. Murayama: Acta Mater. 47 (1999) 3331–3338. 18) T. Zhang, A. Inoue and T. Masumoto: Mater. Trans., JIM 32 (1991) 1005–1110. 19) R. Kirchheim, F. Sommer and G. Schluckebier: Acta Metall. 30 (1982) 1059–1068. 20) R. Kirchheim: Acta Metall. 30 (1982) 1069–1078. 21) R. Kirchheim, W. Kieninger, S. Y. Huang, S. M. Filipek, J. Rush and T. Udovic: J. Less-Common Met. 172/174 (1991) 880–889. 22) J. H. Harris, W. A. Curtin and M. A. Tenhover: Phys. Rev. B 36 (1987) 5784–5797. 23) H. Mizubayashi and T. Okamoto: Mater. Sci. Forum 304-306 (1999), 355–360. 24) T. Hashimoto, S. Kobayashi, K. Maeda and S. Takeuchi: Strength of Metals and Alloys, Ed. R. C. Gifkins (Pergamon Press, Oxford and New York, 1982) pp. 173–178. 25) D. Weaire, M. F. Ashby, J. Logan and M. J. Weins: Acta Metall. 19 (1971) 779–788. 26) S. Takeuchi and K. Maeda: Tech. Rep. A-1730, 1986 (Institute of Solid State Physics, University of Tokyo, Tokyo) and references cited therein. 27) A. S. Nowick and B. S. Berry: Anelastic Relaxation in Crystalline Solids, (Academic Press, New York, 1972) p. 301. 28) A. Inoue: Acta Mater. 48 (2000) 279–306..
(9)
Figure
+2
Related documents
This study will show how family cohesion, family flexibility and family communication as family dynamics are related to family functioning and how family life cycle affects this
And new regional agreements seem unlikely to give much added benefit on the access side to OECD markets (since barriers are low), and may serve to fragment global markets...
Having established the relation between competitive dynamics and competitive actions (section 3.1), and described both frameworks, Chen and Miller’s
Maar het hoeft niet zo te zijn dat een neuraal netwerk de kosten voor een nieuw project projectspecifiek kan bepalen.. De werking van een neuraal netwerk is hieronder
Teachers' professional development is conceptualized in three ways: in relation to change in the education system, to the place of teaching as a profession, and in terms
Grote verandering: Meerdere onderdelen zijn gewijzigd en er is een duidelijke verandering zichtbaar, maar het nieuwe logo houdt nog wel verband met het oude logo. Nieuw logo:
Thus, to better understand the relationship between statins and the risk of cirrhosis in hepatitis B or C patients, we conducted a systematic review and meta-analysis of
