Nanoscale Phase Separation in an Fe
70Nb
10B
20Glass
Studied by Advanced Electron Microscopy Techniques
Takeshi Hanada
1, Yoshihiko Hirotsu
1and Tadakatsu Ohkubo
21
Institute of Scientific and Industrial Research, Osaka University, Ibaraki 567-0047, Japan
2National Institute for Materials Science, Tsukuba 305-0047, Japan
Advanced techniques of electron microscopy were employed for analyzing a local structure of an as-formed Fe70Nb10B20metallic glass.
From nano-diffraction with an electron probe size of 1 nm, diffraction patterns of bcc-Fe and Fe-boride were observed which indicated an occurrence of nano scale phase separation in the glass. Atomic pair distribution function (PDF) analysis of the glass was also performed by means of precise electron diffraction intensity analysis taking advantage of energy-filter and imaging plate techniques. An atomic structure model was constructed using reverse Monte-Carlo calculation followed by Voronoi polyhedral analysis in order to know local atomic arrangements in the glass structure. The Voronoi analysis revealed atomic arrangements with bcc-Fe-like and B-centered trigonal prism polyhedral structures in this glass, which is consistent with the local structural study by nano-diffraction.
(Received November 7, 2003; Accepted January 13, 2004)
Keywords: nanoscale phase separation, advanced electron microscopy, electron energy-spectroscopic diffraction, imaging plate
1. Introduction
In recent years, much attention has been paid to structural details of metallic glasses, focusing especially on the atomic medium range order (MRO)1) and local atomic density or compositional fluctuation in a spatial range beyond the MRO range. For these structure studies, the diffraction technique with synchrotron,2,3)electron,4)and the small angle scattering technique with neutron5)or X-ray scattering6)are often used. The former technique is to know the atomic correlation length in MROs and the latter one to know spatial length of density or compositional fluctuations. More direct and local observation of the MRO structures can be attained using high resolution electron microscopy (HREM). A direct observa-tion of clear MROs as a structural component of metallic glasses, taking advantage of the lattice imaging technique, was first performed in a-Fe-B and a-Pd-Cu-Si alloys by a careful examination of defocus-conditions.7,8) It was also
demonstrated that a combination of HREM and nano-diffraction is effective to study atomic arrangement of extended-MRO structures.8) Recently, we have performed atomic pair distribution function (PDF) analysis of a-Pd-Si by electron diffraction by taking advantage of strong electron scattering from lighter atoms and also of scattering informa-tion from a wide special frequency range, and a structure model of ‘‘nanoscale phase separation’’ was constructed referring to the fcc-MRO structure observed by HREM.9)
Among the Fe-based metallic glasses, Fe-Nb-B glasses are known to exhibit good soft magnetic properties after annealing, which ascribes to fine and high dense dispersion of nano sized-Fe precipitates in amorphous matrix.10)The
fine dispersion of-Fe nano precipitates is understood to be closely related to the as-formed atomic structure. Especially, the MRO structure and the nano scale phase separations are thereby important for the formation of such a fine structure on annealing. In order to understand the as-formed glass structure in detail, we have employed advanced techniques of electron microscopy. For a specimen an Fe70Nb10B20glass
structure was chosen. Nano-diffraction technique with an
electron probe-size as small as 1 nm was used to examine local extended MRO structures in addition to HREM. In precise electron diffraction structure analysis, energy-filter was used to remove inelastic electrons and the intensity was recorded on imaging plate (IP).
2. Experimental Procedure
2.1 Specimen preparations and TEM experiments The Fe70Nb10B20 glass used in this study was made by
single-roll rapid quenching technique. The width of ribbon specimen was 0.8 mm, and the thickness is 20mm. Specimens for TEM observation and electron diffraction studies were prepared using low angle Ar ion milling (Gatan, PIPS and LINDA, IV3/L). HREM and nano-beam electron diffraction studies were performed using a 300 kV TEM (JEM-3000F with a field emission gun). Selected area electron diffraction (SAED) intensity profiles were collected for amorphous structure analysis using TEM (LEO 922) equipped with an in-column-type energy filter. The inelastic part of intensities was removed in recording electron diffraction intensities using energy-filter with an energy slit width of 20 eV. Energy filtered electron diffraction patterns were recorded on IPs and were read using an IP reader (FDL-5000). The camera-length was corrected by using reference diffraction patterns from fine gold particles. To decrease the multiple scattering, thin specimen areas were selected. In the PDF analysis the intensity recorded was divided into 16384 gray levels and was digitized using a computer. Direct local structural observations like extended-MRO was carried out by HREM using the defocus-method11,12) which provides the high
contrast imaging condition of MROs into consideration with respect to the phase-contrast transfer function in HREM imaging. For the examination of local structures of extended-MROs, nano-diffraction was performed using field-emission TEM (JEM-3000F) with an electron-probe as small as 1 nm. The nano-diffraction patterns were recorded from site to site continuously using a TV-rate CCD-camera.
2.2 Electron diffraction structure analysis
In the electron diffraction structure analysis, an interfer-ence functioniðQÞand a reduced interference functionQiðQÞ
were obtained by way of subtracting background intensity BGðQÞfrom the observed elastic scattering intensity,IobsðQÞ,
whereQis the scattering vector (Q¼4sin=;is the half scattering angle andthe electron wave length. The function QiðQÞis related to the reduced distribution functionGðrÞby the Fourier transforms as (1)
GðrÞ ¼ ð=2Þ
Z1
0
QiðQÞsinðQrÞdQ¼4r½ðrÞ 0 ð1Þ
whereðrÞis the atomic density,rthe atomic radial distance and 0 the average atomic density obtained from the
specimen density. The atomic PDF, gðrÞð¼ðrÞ=0Þ, and
the RDF, 4r2ðrÞ, can be obtained by GðrÞ. In a precise
electron diffraction PDF analysis the most important proce-dure is to obtain diffraction intensity profiles as close as that of kinematical intensity with less inelastic scattering and multiple scattering, in addition to good linearity in intensity recording.
2.3 Reverse Monte-Carlo simulation
In making a final plausible structure model which can explain the experimental PDF profile very well, the reverse-Monte-Carlo (RMC) simulation6) was applied for the
Fe70Nb10B20 glass. It is noted that the RMC-simulation can
be an effective procedure to obtain partial PDFs for constituting atoms (in electron diffraction there is no way to obtain partial PDFs experimentally). As an indication for a convergence of the simulation, the2criterion14)was taken:
2 ¼ðgexpðrÞ gcalðrÞÞ2=N; ð2Þ
wheregexpðrÞis the experimental total PDF,gcalðrÞthe
RMC-calculated total PDF and N the number of data points. To minimize the2 value at least105 iterations were necessary for a model of 2500 atoms. After obtaining a preferable structure model, Voronoi polyhedral analysis14) was also performed for the local structure analysis of the structure model.
3. Results and Discussion
3.1 observations of crystalline atomic clusters
In our previous HREM observation of Fe84B167) and
Fe90Zr7B312)glasses, local lattice fringe images extending as
small as 1 to 2 nm have been observed, in spite of appearances of halo-patterns in SAED. These local lattice fringe regions were judged to be those of bcc-Fe clusters (bcc-MROs) from the fringe spacings and crossed-lattice fringe geometries. In this study, such local lattice fringe images were also observed, but the image regions of the bcc-clusters in the Fe70Nb10B20specimen were always less than
1 nm.
For detecting local crystalline atomic clusters in the Fe70Nb10B20 glass, nano-diffraction has been performed in
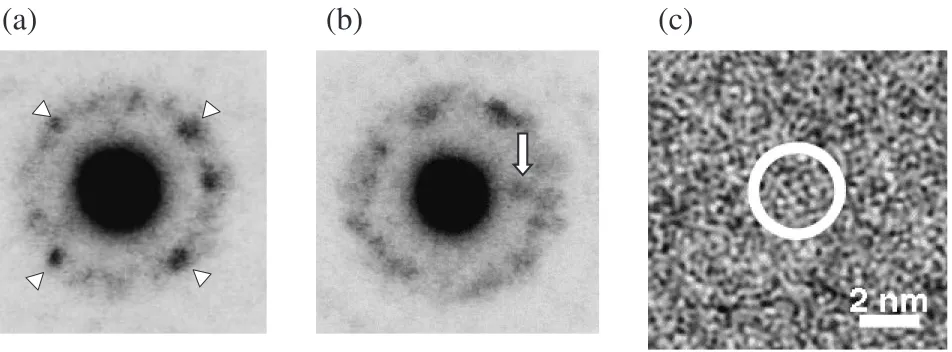
the present study. Nano-diffraction patterns recorded on TV-camera were examined carefully, and diffraction patterns with clear diffraction spots were chosen. Figures 1(a) and (b) are examples of nano-diffraction patterns taken from the as-formed Fe70Nb10B20 glass. Zone-axish100i pattern from a
bcc-Fe cluster is shown in Fig. 1(a). In Fig. 1(b), on the other hand, a diffraction spot (indicated by an arrow) from a cluster with an interplaner spacing of about 0.25 nm is clearly observed, which is presumably from an Fe-boride cluster. There are several interplaner spacings close to 0.25 nm with strong scattering intensities in Fe2B, Fe3B, Fe3Nb2 and
Fe2Nb, though their crystal structures are supposed to be
deformed and not perfect for such clusters with sizes as small as 1 nm (Fig. 1(c)). According to the examination of video-camera of nano-diffraction patterns, there are few chances of observation of such a clear diffraction spot (Fig. 1(b)) from the second-phase nano-clusters in comparison with a rather frequent chances of observation of diffraction spots from bcc-Fe clusters. This means that the second-phase clusters as large as 1 nm are formed locally but their formation is not frequent in Fe70Nb10B20. From Figs. 1 it has been directly
demonstrated that similar to the case in Pd-Si9) glass a
‘‘nanoscale phase separation’’ is occurring in the present Fe70Nb10B20 glass.
(a)
(b)
(c)
Fig. 1 Nano-diffraction patterns and HREM from Fe70Nb10B20. A zone-axish100ipattern of bcc-Fe is visible in (a), and in (b) a spot
[image:2.595.65.541.73.249.2]3.2 Electron diffraction PDF profiles
In studying glass structure, atomic PDF analysis is generally performed using diffraction technique to obtain averaged information of atomic coordination and inter atomic distances. It is interesting to know how the structures of nanoscale phase separation in Fe70Nb10B20 glass is
correlated to the averaged atomic structure information deduced from PDF. Therefore, electron diffraction PDF analysis was performed using the same Fe70Nb10B20
speci-men as used in taking HREM images and nano-diffraction patterns.
Averaged electron diffraction intensities hIðQÞi were obtained along the radial direction in reciprocal space. In recording the halo diffraction intensity profiles, the zero loss diffraction intensity profiles were used up to theQvalues of 120 nm1. Zero loss pattern which removed the inelastic contribution of plasmon and core loss components in the electron diffraction was collected with an energy window width of 20 eV. And the SAED intensity profiles fromQ¼ 120 to 200 nm1 taken without energy filter were used for
higher frequency part ofhIðQÞi. This is because the second-order aberration of the energy filter causes a diffraction intensity dumping in higher scattering angle in the energy filtering. Electron diffraction intensities were thus collected up to a scattering vectorQ200nm1using an energy-filter
to remove the inelastic intensities. In order to estimate a thickness limit beyond which we have a multiple scattering effect on the intensity analysis, we obtained electron diffraction patterns from thin regions to thicker regions using a small electron beam (beam-size 100 nm) and their interference functions were compared. With this procedure, we also measured EELS spectra from these regions for electron diffraction, and their local thicknesses were esti-mated taking advantage of the elastic to total intensity log-ratio method.15)The multiple scattering is almost negligible
in the interference function when the specimen thickness is less than about 20 nm (where the MRO images in HREM become visible).
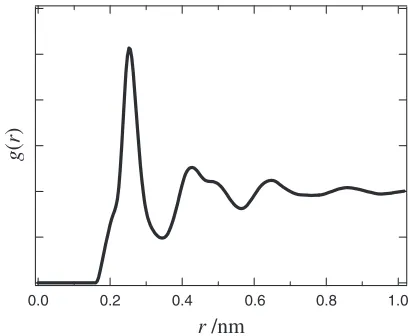
Figure 2 represents the reduced interference function QiðQÞ obtained from the Fe70Nb10B20 spaecimen. Also
shown in Fig. 3 is the PDF calculated from Fig. 2. In this PDF, an Fe-B correlation distance at about 0.21 nm was
observed as a subsidiary rising of the first PDF peak. It should be noted that the correlation peak can only be obtained when the diffraction intensity profiles up to high scattering angles as high as Q170nm1 are obtained correctly. It is
important to consider how the structural information from these PDF is related to the nanoscale phase separation. It is well presumed that in the case of atomic arrangements with nanoscale phase separation in this glass there must be strong atomic correlations especially between B and Fe, and between Fe atoms, since the glass-phases disintegrate into
-Fe and Fe-boride as the main components in crystalliza-tion. In Fig. 3, however, the separation of atomic correlations between Fe-Fe and Fe-Nb is difficult, because of their close atomic sizes.
Electron diffraction technique does not enable us to obtain atomic partial correlation functions (partial PDFs) differently from the anomalous X-ray scattering and neutron diffraction techniques.1) In order to evaluate the partial coordination
numbers and to analyze the glass structure more in detail in electron diffraction structure analysis, we have performed the ‘‘RMC simulation’’ for the Fe70Nb10B20 glass. With this
technique, we can realize both the structure model and also the partial atomic coordination numbers through the model.
3.3 Reverse Monte-Carlo simulation and Voronoi-anal-ysis
After the electron diffraction PDF analysis, RMC simu-lation was performed for the structure modeling of the Fe70Nb10B20 glass. In the simulation 2500 atoms were
distributed in a cubic cell under the defined atomic composition and density. During the calculation, the periodic boundary condition was kept. The RMC calculation to realize the experimental PDF was started after setting an initial structure model. As the initial structure model a DRP structure was adopted, since the bcc-Fe clusters are thought to be rather deformed and are not frequently observed in number in HREM, and also, they are not extended beyond 1 nm in most cases. The cell size of the structure model was (3.007 nm)3. The initial structure was then relaxed statically using Lennard-Jones atomic potentials according to the manner used in our previous study of Fe-Zr-B glass.12)
Figure 4 shows the RMC-PDF fitting to the experimental
Qi
(
Q
)
200 160
120 80
40 0
Q nm
-1Fig. 2 Reduced interference functionsQiðQÞfor Fe70Nb10B20.
g
(
r
)
1.0 0.8
0.6 0.4
0.2 0.0
r /nm
[image:3.595.324.529.71.239.2] [image:3.595.67.269.599.768.2]PDF for the Fe70Nb10B20glass. The fitting ofgcalðrÞtogexpðrÞ
is very good, and the partial PDF for the metal-metal and nonmetal-metal correlations can be seen. In Table 1, aver-aged coordination numbers are shown for each element. These values are in good agreement with those obtained from X-ray diffraction using synchrotron radiation2,3)for the same Fe70Nb10B20 specimen.
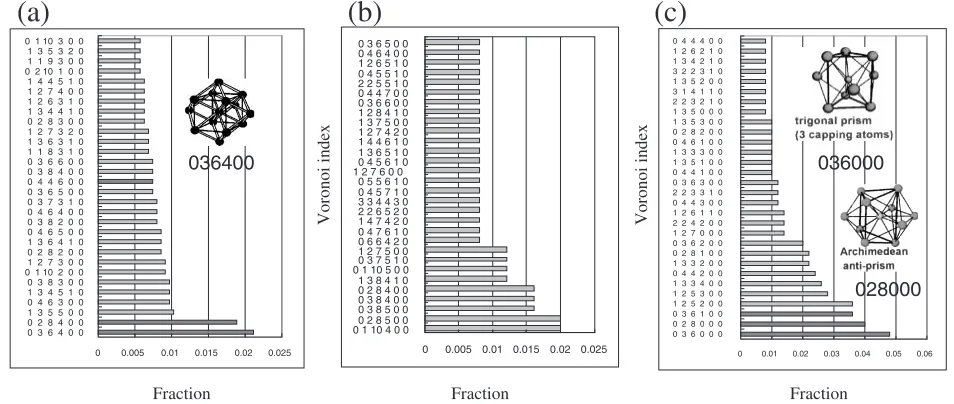
In order to investigate local atomic arrangements in the Fe70Nb10B20glass, the Voronoi polyhedral analysis has been
made for the final RMC-simulated structure. Fractions of the Voronoi polyhedral structures with central Fe, Nb and B are shown in Figs. 5(a), (b) and (c), respectively. In Fig. 5(a), deformed-bcc Fe polyhedra with indices such as ‘‘036400’’ and ‘‘028400’’ are frequently observed. Though the frequen-cy is not high, icosahedral index ‘‘00 12 000’’ and the related indices like ‘‘01 10 2 00’’ are found. In Fig. 5(b), the polyhedra with central Nb atoms have a larger coordination number compared with those of Fe-centered polyhedra (the sum of the index corresponds to the coordination number) as in the case of Zr-coordinated polyhedra in the Fe-Zr-B glass.13,14)It is understood that the circumstance around Nb atoms is similar to that found in the Fe-Nb compounds
(Laves-phases) with large coordination numbers. In Fig. 5(c), it is noted that trigonal prism-related polyhedra like 9-coordinated and Archimedian-anti-prisms are predominantly found around B atoms, as is well expected from our previous study of Fe-Zr-B glass.12) These polyhedra were the components of metasable crystal Fe3B. In both of the prisms,
the number of nearest metal atoms is six, in good corre-spondence with the coordination number for central B atom in Table 1.
From the Voronoi polyhedral analysis based on the RMC-simulated Fe70Nb10B20 glass structure model, it has been
demonstrated that the structure has atomic correlations reflecting the nanoscale phase separation observed by HREM and nano-diffraction: Namely, a large Fe-Fe(Nb) correlations with bcc-Fe related Voronoi-indices means a tendency of the bcc-Fe cluster formation, and also, a predominant trigonal prism formation of B-centered polyhedra means a tendency of the Fe-boride formation. Nb-centered polyhedra are responsible for the local SRO or MRO structures intercon-necting the nanoclusters. It is strongly suggested that the bcc-Fe clusters are responsible for the formation of nucleation sites for Fe-nanocrystals on annealing.
g
(
r
)
1.0 0.8 0.6 0.4 0.2 0.0r /nm
Fe-B Fe-Fe Fe-Nbg
exp(r)
g
cal(r)
[image:4.595.69.274.69.240.2]Fig. 4 Experimental and RMC-calculatedgðrÞfor Fe70Nb10B20.
Table 1 Atomic coordination numbers obtained from the RMC simulation for Fe70Nb10B20.
Coordinated Coordination Total
Centerd atom coordination
m atom number number
n Zmn
Ztotal
Fe 10.13
Fe Nb 1.59 13.38
B 1.66
Fe 11.10
Nb Nb 1.64 14.96
B 2.21
Fe 5.82
B Nb 1.11 6.93
B 0.00
0 0.005 0.01 0.015 0.02 0.025 0 3 6 4 0 0
0 2 8 4 0 0 1 3 5 5 0 0 0 4 6 3 0 0 1 3 4 5 1 0 0 3 8 3 0 0 0 1 10 2 0 0 1 2 7 3 0 0 0 2 8 2 0 0 1 3 6 4 1 0 0 4 6 5 0 0 0 3 8 2 0 0 0 4 6 4 0 0 0 3 7 3 1 0 0 3 6 5 0 0 0 4 4 6 0 0 0 3 8 4 0 0 0 3 6 6 0 0 1 1 8 3 1 0 1 3 6 3 1 0 1 2 7 3 2 0 0 2 8 3 0 0 1 3 4 4 1 0 1 2 6 3 1 0 1 2 7 4 0 0 1 4 4 5 1 0 0 2 10 1 0 0 1 1 9 3 0 0 1 3 5 3 2 0 0 1 10 3 0 0
0 0.01 0.02 0.03 0.04 0.05 0.06 0 3 6 0 0 0
0 2 8 0 0 0 0 3 6 1 0 0 1 2 5 2 0 0 1 2 5 3 0 0 1 3 3 4 0 0 0 4 4 2 0 0 1 3 3 2 0 0 0 2 8 1 0 0 0 3 6 2 0 0 1 2 7 0 0 0 2 2 4 2 0 0 1 2 6 1 1 0 0 4 4 3 0 0 2 2 3 3 1 0 0 3 6 3 0 0 0 4 4 1 0 0 1 3 5 1 0 0 1 3 3 3 0 0 0 4 6 1 0 0 0 2 8 2 0 0 1 3 5 3 0 0 1 3 5 0 0 0 2 2 3 2 1 0 3 1 4 1 1 0 1 3 5 2 0 0 3 2 2 3 1 0 1 3 4 2 1 0 1 2 6 2 1 0 0 4 4 4 0 0
0 0.005 0.01 0.015 0.02 0.025 0 1 10 4 0 00 2 8 5 0 0
0 3 8 5 0 0 0 3 8 4 0 0 0 2 8 4 0 0 1 3 8 4 1 0 0 1 10 5 0 00 3 7 5 1 0 1 2 7 5 0 0 0 6 6 4 2 0 0 4 7 6 1 0 1 4 7 4 2 0 2 2 6 5 2 0 3 3 4 4 3 0 0 4 5 7 1 0 0 5 5 6 1 0 1 2 7 6 0 0 0 4 5 6 1 0 1 3 6 5 1 0 1 4 4 6 1 0 1 2 7 4 2 0 1 3 7 5 0 0 1 2 8 4 1 0 0 3 6 6 0 0 0 4 4 7 0 0 2 2 5 5 1 0 0 4 5 5 1 0 1 2 6 5 1 0 0 4 6 4 0 0 0 3 6 5 0 0
Fraction Fraction Fraction
Voronoi index
Voronoi index Voronoi index
(a)
(b)
(c)
036400 036000
028000
[image:4.595.305.550.93.260.2] [image:4.595.65.542.285.487.2]4. Conclusion
In this manuscript, application of advanced electron microscopy techniques was presented for local and average structure analysis of Fe70Nb10B20 glass. It has been shown
that the combination of these techniques can contribute to understand the local atomic structure considerably. By mean of nano-diffraction and also from electron diffraction intensity analysis, local atomic structural fluctuation forming nano-scale phase separation was intensively studied in the Fe70Nb10B20 glass. It was concluded that the glass structure
has a ‘‘nanoscale phase separation’’ where bcc-Fe clusters and boride-like clusters are randomly distributed. For the stability of glass structure, a formation of icosahedral or highly coordinated atomic clusters (found in Laves phases) in glasses has been argued recently.16)It is interesting that the atomic circumstance of Nb is highly coordinated one (Fig. 5(b)). The strong Nb-Fe correlations presumably form Nb-Fe compound-like clusters. A more detailed nano-diffraction study is necessary to understand the structure of local cluster formed with Nb and Fe atoms.
Acknowledgments
These investigations were partly supported by Special Coordination Funds for Promoting Science and Technology on ‘‘Nanohetero Metallic Materials’’ from the Science and Technology Agency. The authors express their thanks to professor E. Matsubara and A. Makino for supplying the specimen.
REFERENCES
1) S. R. Elliott,Physics of Amorphous Materials, (Longman Sci. & Tech., 1990), Sec. 3, pp. 71–184.
2) E. Matsubara, S. Sato, M. Imafuku, T. nakamura, H. Koshoba, A. Inoue and Y. Waseda: Mater. Sci. Eng.A312(2001) 136–144.
3) M. Imafuku, S. Sato, E. Matsubara and A. Inoue: J. Non-Cryst. Solids
312–314(2002) 589–593.
4) M. Tewes, J. Zweck and H. Hoffmann: J. Phys.: Condens. Matter.6
(1994) 835–848.
5) M. Ohnuma, K. Hono, H. Onodera, J. S. Pedersen and S. Linderoth: Nanostructured Materials12(1999) 693–696.
6) P. A. Duine, J. Sietsma B. J. Thijsse and L. Pusztai: Phys. Rev. B50
(1994) 13240–13249.
7) Y. Hirotsu and R. Akada: Jpn. J. Appl. Phys., Part 223(1984) L479– L418.
8) Y. Hirotsu, M. Uehara and M. Ueno: J. Appl. Phys.59(1986) 3081– 3086.
9) T. Ohkubo and Y. Hirotsu: Phys. Rev. B67(2003) 094201-1-9. 10) A. Makino, T. Bitoh, A. Inoue and T. Masumoto: Scr. Mater.48(2003)
869–887.
11) Y. Hirotsu, T. Ohkubo and M. Matsushita: Microsc. Res. Tech.40
(1998) 284–312.
12) M. Matsushita, Y. Hirotsu, K. Anazawa, T. Ohkubo and T. Oikawa: Mater. Trans., JIM36(1995) 822–827.
13) T. Ohkubo, H. Kai and Y. Hirotsu: Mater. Sci. Eng.A304-306(2001) 300–304.
14) T. Ohkubo, H. Kai, A. Makino and Y. Hirotsu: Mater. Sci. Eng.A312
(2001) 274–283.
15) R. F. Egerton, Electron Energy-Loss Spectroscopy in the Electron Microscope, (Plenum Press, New York, 1996) pp. 302.