Evaluation Method of Surface Texture by Surface Roughness
based on Geometrical Product Specifications (GPS)
*Makiko Yonehara
1, Tsutomu Matsui
2, Koichiro Kihara
3, Hiroaki Isono
4,
Akira Kijima
3and Toshio Sugibayashi
31Mechanical System Engineering, Graduate School of Engineering, Takushoku University, Hachioji 193-0985, Japan 2R&D Engineering department, FUNAI ELECTRIC CO., LTD., Tokyo 101-0021, Japan
3Department of Mechanical System Engineering, Faculty of Engineering, Takushoku University, Hachioji 193-0985, Japan 4Department of Precision Mechanical System Engineering, Polytechnic University, Sagamihara 229-1196, Japan
This paper describes a quantitative evaluation method for metal surface texture. We used surface roughness and glossiness as parameters to describe surface texture. Specimen surface roughness was evaluated based on geometrical product specification data taken from japanese industrial standards. The effects of surface roughness on glossiness were investigated by aluminum alloys. The relationship between the glossiness and the roughness height, the period of the roughness profile and the slope for the surface roughness processed by a vertical milling machine were studied for determining if the topography of the surface roughness affects the glossiness. The surface of the specimens were polished using abrasive paper and blasted, so that the arithmetical mean deviation,Ra, was less than 1.00mm. The effects of roughness on glossiness were investigated on polished surfaces and blasted surfaces. The results show that the surface roughness shape and the glossiness prove to be effective indices for evaluating the surface textures of aluminum alloys.
(Received December 11, 2003; Accepted February 2, 2004)
Keywords: surface texture, roughness, glossiness, geometrical product specifications
1. Introduction
The sensory factors that characterize the surface of an object can be described as, ‘‘roughness,’’ ‘‘glossiness,’’ ‘‘transparency,’’ ‘‘sense of depth,’’ ‘‘feeling,’’etc. The total effect of these factors is referred to as ‘‘texture,’’ the attribute of visual sensation related to the surfaces of objects that is formed by the materials and the surface structure. The term ‘‘texture’’ is used to describe the inherent texture of a material.
Generally speaking, the appearance of manufactured products comprises ‘‘color,’’ ‘‘shape,’’ and ‘‘texture’’.1) Quality control practices keep these factors uniform. Re-cently, growing attention has been given to developing ways of using the inherent texture of a material to characterize the products made from it.2)
If we consider the textures of aluminum alloy as an example, in general, there is not only the hairline finish, but also by processing and finishing. It is possible to obtain additional textures that take full advantage of the feel of a material, such as the glossiness and softness possessed by aluminum.3–6)However, under present conditions, specimens are the main medium used to communicate texture in the manufacturing process. It is particularly difficult to convey accurate texture information in this way.
At ISO (International Organization for Standardization), an attempt is being made to unify the evaluation of surface properties (textures), such as surface roughness and geo-metrical tolerances, with ‘‘Geogeo-metrical Characterization Specification for Products’’ (GPS Standards): 2005 has been set as the target date for this unification. Already several types of JIS (Japanese Industrial Standards) have been
established.7)It has been estimated that the establishment of GPS Standards will offer a very important verification method from the standpoint of guaranteeing the quality of products that use materials such as stainless steel, aluminum alloys, and magnesium alloys for home appliances and building materials.8)
Conventional studies of textural properties can be roughly divided into evaluations based upon visual or tactile sense intensity, and those made by quantitatively evaluating the shape of the surface and the reflective characteristics of light. The first type of studies evaluates texture by mainly correlating colored surfaces and the gloss of coated surfaces, or by characterizing materials, such as metal, wood, stone, plastic,etc., by making visual comparisons.9–11)
The second type of studies uses restricted materials most of the time. By changing the surface processing conditions, correlations of the reflective light intensity are studied, such as degree of gloss, scattered light, and speckle pattern versus the surface roughness.12–15)
The above discussed methods have been mainly used to control the quality of manufactured products. They are applied only in those cases where a single evaluation factor and the same measuring conditions and materials are used. As a result, there have not been many studies which evaluate the factors that can be used to make relative textural comparisons for various materials.16)
Thus, the objective of this study is to establish a method of quantitatively evaluating the texture of metal surfaces. Of the various optical properties we chose the mirror surface glossiness (hereinafter referred to as ‘‘glossiness’’) as a critical parameter to measure, and we chose aluminum alloys for their properties of high surface reflectance and achromatic material color. Aluminum alloys have high reflectance, and it is believed that their glossiness depends on the amount of diffused and reflected light which is a function of surface
*Parts of This Paper were Originally Published in Japanese in J. Japan Inst.
Light Metals53(2003) 163–168.
Special Issue on Frontiers of Smart Biomaterials
roughness.
Therefore, aluminum alloy specimens having different surface roughness were prepared. The relationship between the glossiness and the surface roughness height, period, and slope angles was studied, and an investigation was made of the shape of the surface roughness that affected the glossi-ness.
2. Experiment Method
2.1 Processing method
Aluminum alloys (A2017 and A5052) were used as test specimens in the present study. The dimensions of the test
specimens were 70 mm70 mm5 mm, and the surfaces
were machined by milling, polishing and blasting.
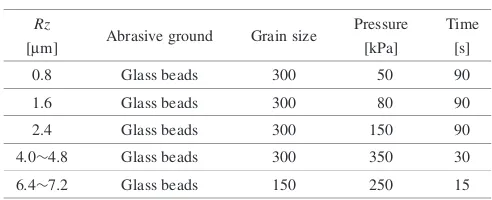
[image:2.595.319.536.75.197.2]The surface of the aluminum alloy A5052 was milled. A vertical milling machine was used to cut the specimen as well as to form irregularities on its surface. A single high-speed steel blade was used to cut the irregularities. The blade revolved at 790 rpm, and the depth of the cut was set at 0.1 mm. Moreover, by adjusting the feeding speed of the table, four types of test specimens having different stepwise irregularities were prepared. Table 1 shows the processing conditions for the respective test specimens.
The surface of the aluminum alloy A2017 specimens were polished using abrasive paper so that the arithmetical mean roughness, Ra, was in the range of 0:03<Ra<1:00mm. During the polishing process, two types of polishing directions were used: unidirectional and free directional.
The surface of the aluminum alloy A5052 was blasted. The surface was blasted using a profile with the maximum height Rzshown in Table 2. In this process, the processing pressure and time were set in such a way that the arithmetical mean roughness,Ra, was less than 1.0mm.
2.2 Measuring method
The roughness curves were obtained using a stylus profilometry-type instrument (SV-624 Mitutoyo Corpora-tion). The shape of the stylus tip and the taper angle were in accordance with JIS B 0651:2001 and ISO 3274:1996
standards. A 90 cone having a 5mm radius of curvature
was used. The cut-off value at the time of measurement was 0.8 mm, with a length of 4 mm, and a pitch of 0.5mm. The direction and number of measurements were as follows. The center portion of the test specimen was measured three times, each in a direction orthogonal to the cutting direction. The average surface roughness value was then calculated.
Glossiness measurements were carried out in accordance with JIS Z 8741:1997 standards. A Mirror-TRI-gloss (BYK-Gardner) measuring device was used. Figure 1 shows a schematic diagram of the instrument used to measure specular glossiness. The light source shown is white-type light, and its spectral characteristic conform to CIE standard light source C. The light reflected from the specular is collected by a silicone photo-diode receptor. The spectral characteristics from the CIE standard light source C were equivalent to average daylight having the UV portion removed.
In this case, glossiness is relatively expressed by indicating the reflectance of a glass surface having a refractivity of 1.567 by 100(%). For instance, in the case where the incident angle is expressed by i¼60, and the reflective angle by
r¼60 the reflectance of the same glass would be about
10%, hence, this value would be defined as glossiness Gs
(60) = 100.
In the present study, the glossiness of the test specimen was measured at incident angles ofi¼20, 60, and 85. As for the measurement position, the direction and number of measurements were as follows. The center portion of the test specimen was measured five times, each in a direction orthogonal and parallel to the cutting direction. The respec-tive average values were calculated for the surface roughness in each direction. In order to remove the stains and oil on the surface, the test specimens were cleaned with acetone prior to taking the surface roughness and glossiness measurements.
3. Results and Observations
3.1 Milled surface
3.1.1 Roughness height and glossiness
The surface roughness height and the glossiness were studied for aluminum alloy A5052. Figure 2 shows the relationship between the glossiness and the arithmetical mean deviation,Ra, (hereinafter referred to as ‘‘Ra’’) which is a measure of height variation. For each test specimen, the Table 1 Cutting conditions for the vertical milling machine.
Specimen No. 1 2 3 4
Feed rate of the table
50 100 150 200
(mm/min) Feed
0.06 0.13 0.19 0.25
(mm/tooth)
Table 2 Blasting conditions.
Rz
Abrasive ground Grain size Pressure Time
[mm] [kPa] [s]
0.8 Glass beads 300 50 90
1.6 Glass beads 300 80 90
2.4 Glass beads 300 150 90
4:04:8 Glass beads 300 350 30
6:47:2 Glass beads 150 250 15
Light source
i
Receptor
L1
S1
L2
S1’ S2
O
T 1
α
1
α
2
α
1
β
θ θr
1
α L3 2
α
β1’
β2 α1’
[image:2.595.46.290.584.653.2] [image:2.595.45.291.686.786.2]Rawas measured perpendicular to the cutting direction. In the diagram, the reverse printing marks and the black marks show glossiness values measured both parallel and perpen-dicular to the cutting direction respectively. The marks were
made to correspond to the Ra of each test specimen.
Furthermore, the solid lines in the figure indicate the dispersion of Ra. This dispersion was calculated from the
root mean square deviation, Rq, shown in eq. (1), in
accordance with JIS B 0561:2001 standards.
Rq¼
ffiffiffiffiffiffiffiffiffiffiffiffiffiffiffiffiffiffiffiffiffiffiffiffiffiffi l
1
Z1
0
Z2ðxÞdx s
ð1Þ
where
l: Sampling length of the assessed profile
ZðxÞ: Height of the assessed profile at an arbitrary positionx With the exception of the incident angle 20, a trend is
seen in Fig. 2 whereRabecame smaller and the glossiness gradually increased. This trend was significant where the incident angle was 85.
The JIS standards take this into account, i.e. the corre-spondence between the glossiness measured by physical means and the glossiness based on sensory perception: The standard specifies that in the case of a high gloss surface, the incident angle shall be 20, and in the case of a low gloss surface the incident angle shall be 85. In other words, in
cases where the glossiness measured at 60is larger than 70,
the glossiness should be measured at 20, and in cases where
it is smaller than 10, it should be measures at 85.
Based on the results obtained in this experiment, the glossiness measured orthogonal to the cutting direction was distributed in the 50 to 125 range when the incident angle was 60. Thus, the results for an incident angle of 85 did not
correspond to sensory gloss. If we are to follow JIS standards, the glossiness value must be measured at incident angles of
20 and 60. However, to keep the measuring conditions
constant in the present experiment, the values obtained from the incident angle of 60 were used.
Figure 2 shows that asRabecame larger, the dispersion of Raitself increased, and the glossiness of test specimens No. 3 and No. 4 became approximately constant. In the case of surfaces having large irregularities, the specular reflection
components that indicate glossiness disappeared, and only the diffused reflection components remained. In other words, for completely rough surfaces, the incident light was uniformly reflected in various directions. Therefore, it is believed that for the glossiness values of specimens No. 3 and No. 4, among the uniformly diffused reflection rays, those reflected from the direction of the specular were being measured.
Furthermore, from Fig. 2 it is evident that when deter-mined the glossiness values for the same surface, the values obtained parallel to the cutting direction were higher than those measured orthogonally. One of the reasons for this was deemed to be the effect caused by the shape of the gloss meter receptor. For instance, as see Fig. 1, if the incident angle is
i¼60, according to JIS standards, the opening angle of the receptor will be 2¼4:40:1 within the incident plane,
and 2¼11:70:2 within the vertical plane. Therefore,
the shape of the receptor will be a rectangle having a side ratio of 1:2.7. In other words, since the glossiness values measured in the parallel direction will also include the diffused reflection light spreading in the longitudinal direc-tion against the shape of the gross meter, the resulting values will be different depending on the direction from which the light is received.
In the case where the incident angle is i¼60, the glossiness measured in the parallel direction will be about 2.7 times the value of the orthogonal direction. Similarly, in the case ofi¼20, it will be about two times of the value, and in the case ofi¼85, it will be about 1.5 times the value of the orthogonal direction.
Since the receptor surface is a rectangular shape, reflected light cannot be received by an isotropic manner. In particular, for glossiness measurements taken from surfaces that are anisotropic, the resultant values will differ based upon the orientation of the receiving surface. Based on the above, it is desirable that the projection surface shape of the incident light be a circle. Furthermore, in the present experiment, the glossiness values obtained from the orthogonal direction to the cutting direction—by which the diffused reflected light is influenced to a lesser degree—were made the glossiness of the test specimen surface.
3.1.2 Roughness cycle and glossiness
A frequency analysis of the roughness curve was per-formed to investigate the effect that the roughness intervals has on the glossiness. Fast Fourier transformations (FFT) were conducted on the roughness curve data, and frequency, f, (Spatial frequency) per 1 mm and power spectral density (PSD) were obtained as the average energy per unit length. In
this case, PSD indicates Ra, that is, the difference in
roughness height, and spatial frequency, f, indicates the inverse of the roughness cycle.PSDwas calculated from eq. (2).
PSD¼PxðkÞ ¼ 1 KU
XK
r¼1
jXrðkÞj2 ð2Þ
whereKis the partition number at partial sequencexrðnÞin
the data number M (¼1024) of the N (¼8000) point
sequence, and the partitioning of xðnÞ is conducted by overlapping each M=2(¼512).U is the energy of the data windowdðnÞ(Hamming Window) obtained from eq. (3).
0.5 1.0 1.5 2.0 2.5 100
200 300 400 500 600
0
Arithmetical mean roughness, Ra/µm
Glossiness (%)
No.1
No.2 No.3
No.4 P O
: Gs(20°) : Gs(60°) : Gs(85°)
[image:3.595.68.271.74.221.2]U¼X
M1
n¼0
d2ðnÞ ð3Þ
Furthermore, XrðkÞ expresses each partial sequence xrðnÞ multiplied by the data windowdðnÞ.
Figure 3 shows the relationship between the spatial frequency,f, and thePSD. Details of the analysis results is shown in Table 3, and the measured values of the surface roughness and glossiness are shown for comparison purpos-es. The maximumPSDvalue is expressed asPSDmaxand the respective values of spatial frequencies that becamePSDmax are shown in Table 3 asfm.
From Table 3, as the glossiness became low, a tendency for
the PSDmax value to increase was observed. On the other
hand, if we observe the relation between the spatial frequency fm and glossiness, in spite of the spatial frequencyfmof test specimen No. 1 being smaller than that of test specimen No. 2, No. 1’s glossiness became higher. It is believed that for
the spatial frequency value, fm, shown in Table 3, the
glossiness is an area average whereas for thePSD, it is a local value that takes the maximum value. This can be confirmed
from the relationship between the PSD and the spatial
frequency,f, shown in Fig. 3. From Fig. 3, if we observe the FFT analysis result for test specimen No. 1 (indicated by solid lines in the diagram), the value of the spatial frequency, f, is about 7.8 and thePSD is the maximum value, but the
PSD value at the time the spatial frequency was about 32.5 was also comparatively high. Thus, it is believed that it is difficult to evaluate the roughness cycle by using the value for the local spatial frequency,f.
As a result, the value of the parameter for the roughness
cycle specified in the JIS B 0651:2001 standard was for the roughness cycle of a test specimen. The relationship for the roughness cycle with glossiness was thus investigated.RSm
is the mean width of the profile elements in the sampling length:RSmis obtained using eq. (4).
RSm¼ 1 m
Xm
i¼1
XSi ð4Þ
where
m: Number ofXs contained in the assessed profile of the sampling length
XSi: Length Xs measures the peaks and valleys in the
assessed profile for the sampling length.
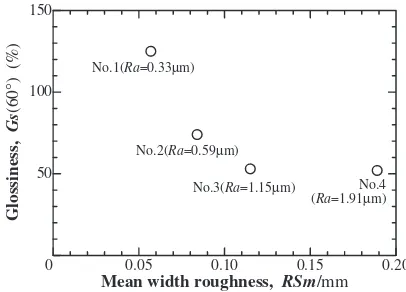
Figure 4 shows results for the relationship betweenRSm
and glossiness. Furthermore, the details of RSm shown in
Table 1 became a value close to the feed amount per tooth. Thus, the roughness period can be evaluated by using the value ofRSm. We believe that the reason of theRSmbecome slightly smaller when compared with the feed amount was due to the second cutting (feed mark) made by the rear blade. From results of Fig. 4 and Table 1, it was observed that there was a tendency for the glossiness to become higher as theRSmbecame smaller. That is the surface having the high glossiness has a roughness of relatively short wavelengths.
3.1.3 Reflection angle distribution and glossiness
The aluminum surface has the characteristic of reflecting almost all the light that falls on it, and it is believed that the greater the amount of diffused light reflected by the effect of the inclination angle of the roughness, the less the specular reflection light amount. Thus, the effect that the roughness inclination angle on the surface of the test specimen has on the direction of light reflection was investigated.
Figure 5 shows theRq, which is given as the relationship between the inclination of the roughness curve and the glossiness measured orthogonally to the cutting direction. The value ofRqis the root mean square slope of the local slope in the sampling length, and it was obtained in accordance with JIS B 0651:2001 standards given in eq. (5).
Rq¼
ffiffiffiffiffiffiffiffiffiffiffiffiffiffiffiffiffiffiffiffiffiffiffiffiffiffiffiffiffi 1
l
Z1
0 dZ dX
2
dx s
ð5Þ
where
0 10 20 30 40 50
Spatial frequency, f /mm-1
PSD
1
0.1
0.01
0.001
Specimen [mm/tooth] No.1 0.06 No.2 0.13 No.3 0.19 No.4 0.25 No.4
No.3
No.2
No.1
Feed
[image:4.595.324.527.73.219.2]Fig. 3 PSDversus spatial frequency, f, for specimens calculated from surface profile data. (orthogonal to cutting direction)
Table 3 Results of surface roughness (RaandRSm), glossiness,PSDmax
and spatial frequency, fm, by FFT analysis. (orthogonal to the cutting direction)
Specimen Gs(60) Surface roughness FFT
No. Ra RSm fm
PSDmax
(mm) (mm) (mm1)
1 125 0.33 0.06 7.81 0.02
2 74 0.59 0.08 9.77 0.10
3 53 1.15 0.12 5.86 0.32
4 52 1.91 0.19 3.91 1.21
0.05 0.10 0.15 0.20 50
100 150
0
Mean width roughness, RSm/mm
Glossiness,
Gs
(60
°
) (%) No.1(Ra=0.33µm)
No.2(Ra=0.59µm)
No.3(Ra=1.15µm) No.4 (Ra=1.91µm)
[image:4.595.68.270.73.217.2] [image:4.595.45.291.303.395.2]l: Sampling length of the assessed profile dZ
dX: Local slope in the sampling length of the assessed profile
From Fig. 5, as the Rq became larger, the glossiness became smaller. Since theRqof test specimens No. 3 and No. 4, which had rather close glossiness values, are approximately the same, it is believed that the roughness inclination angle has a strong influence on the glossiness. Thus, the reflection light distribution on each test specimen was investigated.
From the slope angle of the roughness,s, calculated from the obtained roughness curve data, the reflection angle, r, was calculated according to the reflection law, and the relative degree was obtained. Figure 6 shows a schematic
diagram of the reflection angle, r, calculated from the
roughness curve.
From Fig. 6, we can see that if the measured pitch of the roughness curve is expressed by dx, the slope, s, can be expressed as follows:
s¼tan1 dz
dx ð6Þ
For the case where light is irradiated to the portion that has the inclination anglei, the normalnwill rotateiand move ton0. At this time, the reflection angle,
r, can be obtained with eq. (7).
r ¼t2s ð7Þ
where i is the incident angle of light. Furthermore, the reflection angle r shall be within the range of þ90 in the
clockwise direction and 90 in the counterclockwise
direction, when the normalnof the test specimen surface is made equal to 0
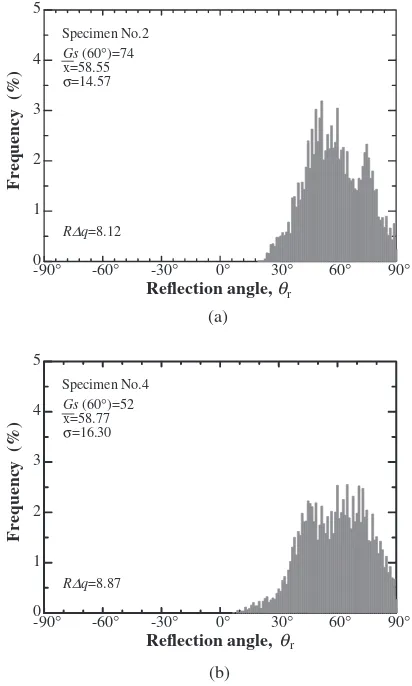
Figures 7(a) and (b) show the relative frequency distribu-tions of reflection anglerwhen light was irradiated from the
60 direction for test specimens No. 2 and No. 4. The
difference at this time was made to be 1.
Figures 7(a) and (b) show that the average value, XX, of
reflection angle, r, became approximately equal to the
specular reflection direction þ60. When these figures are
observed macroscopically, using the vicinity ofþ60as the
center as it spreads toward the periphery, the relative frequency is seen to decrease. In addition, the frequency of test specimen No. 1, which Fig. 7(a) shows had the highest gloss, is concentrated nearþ60.
Next, the distribution of reflected light for the incident anglei¼60 (r ¼ 60direction) was measured, and the state of the diffused reflection was investigated. For the measurement, a Goniophotometer GP-200 (Murakami Color Research Laboratory) was used. The spectral characteristics of the light source used (CIE standard light source C) were the same as those of the gloss meter. The cross-section
5 6 7 8 9 10
0 50 100 150
Root mean square slope, R
Glossiness,
Gs
(60
°
) (%) No.1(Ra=0.33µm)
No.2(Ra=0.59µm)
No.3 (Ra=1.15µm)
No.4(Ra=1.91µm)
q ∆
Fig. 5 Relationship between root mean square slope,Rdq, and glossiness. (Incident angle:i¼60, Orthogonal to cutting direction)
n
θ n’
Specular beam
beam
Point of measurement
Roughness profile i
r θ
θs
s dz
dx Incident
θ
Fig. 6 Schematic diagram of reflection angler.
-90° -60° -30° 0° 30° 60° 90° 0
1 2 3 4 5
Reflection angle, r
Frequency (%)
Specimen No.2 Gs (60°)=74 x=58.55 σ=14.57
R∆q=8.12
θ
(a)
-90° -60° -30° 0° 30° 60° 90° 0
1 2 3 4 5
Reflection angle, r
Frequency (%)
Specimen No.4 Gs (60°)=52 x=58.77 σ=16.30
R∆q=8.87
θ
(b)
Fig. 7 Histograms of the reflection angler. (Incident angle:i¼ 60).
[image:5.595.68.278.73.222.2] [image:5.595.323.529.74.417.2]diameter of the incident light was 3 mm. Figures 8(a) and (b) show typical examples of the reflection light distribution obtained for test specimens No. 2 and No. 4.
Figure 8 shows data collected which was centered around the þ60 of the specular reflection direction. As it spreads
towards the periphery, the reflectance is gradually lowered. Furthermore, in a comparison of test specimen No. 2 with test specimen No. 4 which had low glossiness, it was found that
No. 4 had a lower reflectance in the þ60 direction.
Furthermore, within the range of þ40 to þ70, the
distribution is approximately uniform. From the above results, it is suggested that the reflection light of test specimen No. 4 was easily diffused compared with that of test specimen No. 2, and that the directivity of the light was weak.
The shapes of the relative frequency distribution diagram for the reflection angler shown in Fig. 7(a) and Fig. 7(b), and the reflection light distribution diagram shown in Fig. 8(a) and Fig. 8(b) are similar to those of test specimens No. 2 and No. 4 when observed macroscopically. Thus, the larger the dispersion of the roughness slope angle, the lower the glossiness value. Therefore, it is believed that the slope angle distribution of the roughness has a great influence on the glossiness.
One of the reasons in Fig. 7 and Fig. 8 do not conform quantitatively is that the diagram shown in Fig. 7 was
calculated from a roughness curve based on mechanical contact, whereas, the results of Fig. 8 were expressed using the average value for the whole light receiving area. As a result, an effective means for measuring glossiness has been shown to be a combination of a laser light as a source having directivity and a receptor element that can display light intensity distribution.
3.2 Polished and blasted surfaces
First, to study the roughness parameter on the test specimen surface, the relationships among the height, slope, and period of roughness of the assessed profile were investigated.
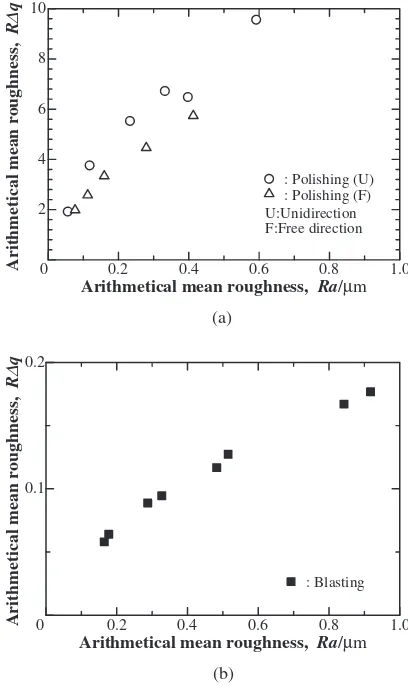
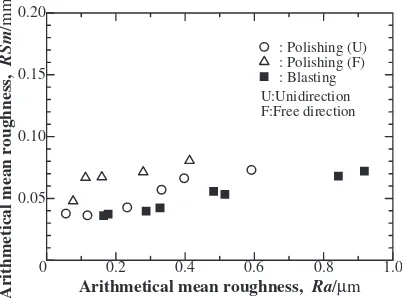
Figures 9(a) and (b) show the relationship between the arithmetical mean roughness,Ra, and the root mean square
slope, Rq. Figure 10 shows the relation between the
arithmetical mean roughness,Ra, and the mean width,RSm, of the profile elements indicating the arithmetical mean deviation of the roughness period. From Fig. 9, it can be seen that regardless of the type of material used for the test specimen, as the value of Raincreased, the value of Rq increase almost linearly. Although there is a slight dispersion from Fig. 10, we see a tendency in which as the value ofRa andRSm. Thus, in order to check the multiple correlation of RaversusRqandRSm, multiple regression equations were obtained.
-90° -60° -30° 0° 30° 60° 90° 0
10 20 30 40 50 60 70
Receiving angle, r'
Relative directional reflectance factor
Specimen No.2
(a)
θ
-90° -60° -30° 0° 30° 60° 90° 0
10 20 30 40 50 60 70
Receiving angle, r'
Relative directional reflectance factor
Specimen No.4
θ
(b)
Fig. 8 Distribution of the relative reflectance. (Incident angle:i¼ 60,
Light source: CIE standard illuminant C). (a) Specimen No. 2 (Feed: 0.13 mm/tooth). (b) Specimen No. 4 (Feed: 0.25 mm/tooth)
0.2 0.4 0.6 0.8 1.0 2
4 6 8 10
0
Arithmetical mean roughness, Ra/µm
Arithmetical mean roughness,
R
∆
q
: Polishing (U) : Polishing (F) U:Unidirection F:Free direction
(a)
0.2 0.4 0.6 0.8 1.0 0.1
0.2
0
Arithmetical mean roughness, Ra/µm
Arithmetical mean roughness,
R
∆
q
: Blasting
(b)
[image:6.595.324.528.416.759.2]^ y
yP.U.¼0:043x1þ5:565x20:248 ð8Þ
^ y
yP.F.¼0:102x11:665x20:052 ð9Þ
^ y
yB.¼3:708x1þ8:793x20:394 ð10Þ
In eq. (8) to eq. (10), the multiple regression equations for polished and blasted surfaces are shown, respectively. The values x1 andx2 indicate the Rq andRSm values for the
respective materials.
From eq. (8) to eq. (10), the multiple correlation coefficients of Ra versus Rq and RSm are RP.U.¼0:997, RP.F.¼0:996 and RB.¼0:996 for polished and blasted surfaces, respectively. A high value was calculated for each material. Therefore, the surface roughness of the present experiment will be evaluated usingRa.
3.2.1 Arithmetical mean roughness and glossiness
Figure 11 shows the relationship between the arithmetical mean roughness,Ra, and glossinessGs(60). From Fig. 11, it is observed that there the glossiness became higher as theRa become smaller, regardless of the type of material, the direction of the roughness and processing methods. In
particular, when Ra becomes less than about 0.2mm the
glossiness increases rapidly. As one of the factors for this, the following can be considered. For the cases where the intervals of the roughness are small compared with the wavelength of the light, diffused reflection based on the
roughness does not occur to incident light at the roughness plane. The Rayleigh criterion which is defined as surface smoothness was showed in eq. (11).17)
h< =8 cos ð11Þ
In eq. (11),his roughness,is wavelength andis incident angle to the specimen.
The wavelength range for the experiment was
0:38mm550:78mm, and the incident anglei was 60. According to this condition and the criterion, the surface was estimated as ‘‘smooth,’’ and incident light was reflected in ideal conditions when the roughness,h, was in the condition of 0:095mm5h50:195mm. Therefore, when Ra is less than 0.2mm, glossiness increased exponentially.
4. Conclusions
This report presented the results of a study to devise a quantitative evaluation index of the textures possessed by metal surfaces. Glossiness was studied for determining its relationship to the roughness shapes of cutting processed aluminum alloy surfaces at first in this research. The following results were obtained.
(1) For the milled surfaces, as the arithmetical mean deviation, Ra, becomes smaller, there is a tendency for the glossiness to become gradually higher.
(2) For the milled surfaces, as the arithmetical mean deviation,Ra, becomes smaller,RSm, which indicates the roughness period, also decreases, which corre-sponds to a high value for the glossiness. In other words, if the amplitude is small and the surface is composed of short wavelength roughness, the glossi-ness will be high.
(3) For the milled surfaces, the slope of the surface roughness has such an effect that if the light intensity of the diffused reflection increases, the light intensity of the specular reflection will be decreased and the gloss will be lower. In other words, the effect that the roughness slope angle has on the glossiness is signifi-cant.
(4) For the polished and blasted surfaces, the root mean square slope, Rq, showing roughness slope, and the multiple correlation coefficient of arithmetical mean deviation,Ra, which shows roughness height versus the mean width of the profile elements,RSm, indicating the arithmetic mean deviation of roughness period, showed high values.
(5) For the polished and blasted surfaces, the glossiness of all specimens increased exponentially as the arithmet-ical mean deviation,Ra, is less than 0.2mm.
The above results show that the surface roughness shape and the glossiness prove to be effective indices for evaluating the surface textures of aluminum alloys.
REFERENCES
1) I. Koike and K. Seike: Engineering Science Course 36 Industrial Design, (Kyoritsu Shuppan Co., Ltd, Japan, 1978) pp. 36–40. 2) Nikkei design, (Nikkei Business Publications. Inc., Japan, 5, 2003)
66–71.
0.2 0.4 0.6 0.8 1.0 0.05
0.10 0.15 0.20
0
Arithmetical mean roughness, Ra/µm
A
rithmetical mean roughness,
RSm
/mm
[image:7.595.69.270.74.223.2]: Polishing (U) : Polishing (F) : Blasting U:Unidirection F:Free direction
Fig. 10 Relationship between arithmetical mean roughness,Ra, and mean width,RSm.
0.2 0.4 0.6 0.8 1.0 100
200 300 400
0
Arithmetical mean roughness, Ra/µm
Glossiness Gs(60
°
) (%)
[image:7.595.67.277.612.758.2]: Polishing (U) : Polishing (F) : Blasting U:Unidirection F:Free direction
3) T. Suzuki: Annual Design Review of JSSD.7–7(2001) 24–29. 4) Nikkei design, (Nikkei Business Publications. Inc., Japan, 4, 2001)
pp. 60–61.
5) T. Ikeda, T. Terasawa, A. Maemura and T. Tamura: Design Review of JSSD.6–6(2000) 36–39.
6) eg,Alumi Keikan Seihin News, (Japan Aluminum Association, Japan,9, 1996).
7) TR B 0007; 1998 Geometric Products Specification, (Japanese Stand-ards Association, Japan, 1998).
8) GPS Specification Standardization Exploratory Committee: Survey Research Report for New Data Standard of Product Design and Manufacture, (Mitsubishi Research Institute, Inc., Japan, 2001). 9) I. Naito, Y. Fujii, S. Yasutake, M. Iioka and K. Kaneko: Bulletin of
JSSD.47-1 (2000) 25–34.
10) J. J. Kim, I. Naito, N. Suzuki and K. Kaneko: Bulletin of JSSD.46-3
(1999) 1–8.
11) T. Okajima, I. Tanahashi and Y. Takeda: Transactions of the Architectural Institute of Japan.261-11 (1977) 1–5.
12) M. Adachi, Y. Kitagawa, T. Matsumoto and K. Inabe: Jpn. J. JSPE.
65-3 (1999) 418–422.
13) L. Cao, T. V. Vorburger, G. Lieberman and T. R. Lettieri: Appl. Opt.
30-22 (1991) 3221–3227.
14) T. Nishikawa, T. Takayasu and K. Iwata: Jpn. J. JSPE.57-9 (1991) 1633–1638.
15) A. Azushima, T. Kishi and M. Miyagawa: Jpn. J. JSTP.25-284 (1984) 765–771.
16) A. Duparre´, J. F. Borrull, S. Gliech, G. Notni, J. Steinert and J. M. Bennett: Appl. Opt.41-1 (2002) 154–171.