Grain Boundary Diffusion in Metals: Recent Developments
Christian Herzig and Sergiy V. Divinski
Institut fu¨r Materialphysik, Universita¨t Mu¨nster, Wilhelm-Klemm-Str. 10, D-48149Mu¨nster, Germany
An overview on recent progress in grain boundary (GB) diffusion study is presented with emphasis on physical phenomena encountered in GB diffusion experiments such as the linear and non-linear segregation effects. Systematic investigations on pure and alloyed poly- and bicrystals gave conclusive information on the solute segregation behavior and allowed to extract the segregation isotherm solely from GB diffusion studies. Recent progress in fundamental understanding of diffusion processes in two-scale materials with two types of short-circuit diffusion paths is discussed on the basis of GB self-diffusion experiments and Monte-Carlo simulations in powder sintered nanocrystalline material.
(Received August 28, 2002; Accepted October 10, 2002)
Keywords: grain boundary diffusion, grain boundary segregation, non-linear segregation, nanocrystalline material
1. Introduction
Knowledge of grain boundary (GB) diffusion character-istics of structural materials is important for many techno-logical applications. For example, the durability of interconnections in microelectronics is often limited by electromigration of impurities along the GBs. GB segrega-tion and/or co-segregasegrega-tion of solute atoms involved in solute GB diffusion are very important processes for understanding
e.g. GB decohesion, Coble creep, and phenomena such as prewetting and wetting of GBs.1)
The fundamentals of GB diffusion are at present well elaborated and were outlined e.g. in.1) The experimental results on GB diffusion existing in the literature up to the end of 80th were collected and critically reviewed in the handbook of Kaur, Gust, and Kozma.2)
Since the latest reviews on this subject,3,4)some new and important results were obtained, both concerning experi-mental results and fundaexperi-mental understanding of GB diffu-sion and linear and non-linear segregation. The present ’state of the art’ in GB diffusion study was presented in a recent textbook5)with an emphasize on the orientation dependence of the GB diffusivityPin bicrystals.
In the present review we put highlight into the segregation behavior and especially into the appearence of non-linear segregation of solutes derived and quantified by GB diffusion experiments. In Chapter 2 this problem will be analyzed for Ag GB diffusion in pure and alloyed Cu poly- and bicrystals. In Chapter 3 the fundamentals of GB diffusion in a two-scale material will be outlined on the grounds of new GB diffusion experiments and Monte-Carlo simulations in such material and a classification of possible diffusion regimes will be reviewed for the case of coexistence of differently fast diffusion paths.
2. GB Diffusion and Linear and Non-linear Segregation
Typically, GB diffusion experiments are performed in Harrison’sBregime.6)In this case the so-called triple product Pcan be determined from the experimental solute penetration profiles, P¼sDgb. Here s is the solute segregation factor, the GB width, and Dgb the GB diffusivity. This
determination of P from GB diffusion penetration profiles assumes that the segregation factors, which is defined as the ratio of the solute concentration in the GBcgband in the bulk cvð0Þjust near the GB,
s¼ cgb
cvð0Þ
; ð1Þ
does not change along the corresponding (deepest) part of the penetration profile. This means that in the case of solute GB diffusion in a pure metal the tracer concentrations cgb and cvð0Þhave to be sufficiently small to satisfy the dilute limit conditions. In Ref. 7) the absolute concentrations of the Ag tracer atoms in GBs of polycrystalline Cu, cgb, were calculated from the measured specific radiotracer activity of the layer sections along the GB diffusion profiles. It was shown that cgb 1 at the penetration profile depths where the GB diffusivityPwas evaluated.
The value of the GB widthseems to be well-defined and existing estimates indicate that can be approximated as ’51010m in FCC metals, e.g. Ag.8,9) Therefore, the
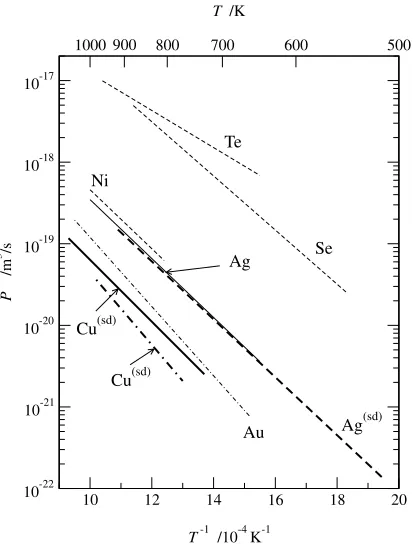
measurements in the B regime kinetics yield the product sDgb (supposing that is known) but not these values separately. Since the segregation factorsvaries remarkably with temperature and can be very large (see below), one can conclude practically nothing about the GB diffusivity Dgb itself from the measurements of theP values. In Fig.1the data onPin Cu and Ag matrices are collected for the solutes, for whichsandDgbwere determined separately (see below). Excluding Te and Se in Ag, other solutes show P values similar to those for self-diffusion in Ag or Cu. Thus, it is of fundamental importance to determine separatelysandDgbin thermodynamical equilibrium conditions.
The segregation characteristics can be determined from the direct Auger measurements.14,15)In this case the sample has to be fracturedin situalong a GB. This procedure limits the application of the method only to brittle materials, ase.g.to Fe or Fe alloys.16,17)No such data exist for ductile materials
e.g.Cu. Furthemore the sensitivity of the Auger technique is limited and a considerable fraction of a monolayer of segregated solute is required for detection.
On the other hand, the equilibrium segregation factor s, eq. (1), can be determined by specially designed GB diffusion experiments.
Special Issue on Diffusion in Materials and Its Application —Recent Development—
#2003 The Japan Institute of Metals
2.1 Essence ofB–Ctype diffusion measurements
Investigation of solute GB diffusion presents an elegant way to determine equilibrium segregation characteristics in the dilute limit by applying the Harrison6) BandC regime GB diffusion measurements in the same material.1) This approach has already been successfully applied to several Cu- and Ag-based systems, seee.g.7,11–13)The GB diffusivity Dgbcan be directly determined inCregime conditions, when the tracer is exclusively allocated in GBs. The type C measurements require extremely high sensitivity of the counting facilities and the use of radiotracer with a high specific activity. Then, measuring also the triple productP¼
sDgb in theB regime and taking ’51010m,9)the segregation factorscan be determined as
s¼ P
Dgb
; ð2Þ
usually by extrapolating thePvalues to low temperatures of the C-type measurements of Dgb.12) Consequently the segregation enthalpyHs therefore is obtained as the differ-ence of the activation enthalpies of theBandCregime data: Hs¼QgbHgb.
The results on solute segregation and directly measured GB diffusivitiesDgb in Cu and Ag matrices are presented in Figs. 2and3, respectively. In dependence on the solute and the matrix the segregation factors varying from about 2 to105 were measured, Fig.2. Although the triple products P of solute diffusion are generally larger than those of self-diffusion, Fig.1, smallerDgbvalues are typically observed in comparison with self-diffusion, Fig. 3. The most pronounced retardation in solute diffusivity was observed for Ni GB
10 12 14 16 18 20
T -1 /10-4 K-1
10-22
10-21
10-20
10-19
10-18
10-17
P
/m
3 /s
1000900 800 700 600 500
T /K
Ag(sd) Se Te
Ag Ni
Au Cu(sd)
Cu(sd)
Fig. 1 Arrhenius plot of the productPof self-9,10)and solute diffusion in Ag (Ni,11)Te,12)and Se,11)dashed lines) and Cu of two purity levels, 5N (Au,13) dotted lines) and 5N8 (Ag,7) solid lines). Self-diffusion data (superindex ‘sd’) are presented by thick lines.
12 14 16 18 20 22 24 26 28
T -1 /10-4 K-1 101
102 103 104 105
s
700 600 500 400 800
T /K
Ni in Ag
Te in Ag
Ag in Cu
Se in Ag
Au in Cu
Fig. 2 Solute segregation factorssof Ag7)and Au13)in Cu (solid lines) and of Ni,11) Te,12) and Se11) in Ag (dashed lines) determined by the radiotracer GB diffusion measurements.
12 14 16 18 20 22 24 26 28
T -1 /10-4 K-1
10-17
10-16
10-15
10-14
10-13
10-12
10-11
10-10
Dgb
/m
2 /s
800 700 600 500 400
T /K
Ag(sd)
Se
Te
Ag Ni
Au Cu(sd) Cu(sd)
Fig. 3 Arrhenius plot of directly measured GB diffusivitiesDgbof Ag7)in
[image:2.595.68.277.72.344.2] [image:2.595.326.530.75.354.2]diffusion in Ag, which was explained by the segregation of Ni atoms not directly in the GB core, but to the adjacent lattice plane(s).11,18)While analyzing Figs.1and3one has to take into account that Cu matrices of two different purity levels were investigated in 7) and 13) and that the content of residual sulfur impurity influences remarkably GB self-diffusion in high-purity Cu.10)
2.2 C-type measurements of AgGB diffusion in Cu
Recently the Hwang-Balluffi method was successfully applied to study Ag GB diffusion in Cu in the C regime conditions.19)This permeation method does not yield the GB diffusivityDgb but the product!0¼sDgb=sss, where s is the width of the segregated layer andss is the surface segregation factor.19)The comparison with the results of the B-type measurements of P¼sDgb yielded the surface segregation enthalpy of about34kJ/mol.19)Unfortunately, one cannot extract the GB segregation factor and the corresponding segregation enthalpy from such measure-ments.
On the other hand the Ag GB diffusivity Dgb in Cu was directly measured in Ref. 7). The activation enthalpy Hs of Ag GB segregation in Cu was deduced to be 39:5kJ/mol. The results of the two investigations are compared in Fig. 4. It is obvious that the values of!0are systematically smaller
than Dgb by about two orders of magnitude, although the corresponding activation enthalpies are very similar.
2.3 Additional interferingeffects in theB-type measure-ments
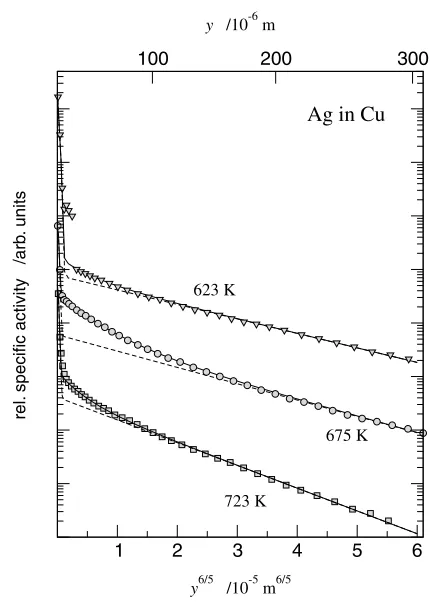
It is common practice to consider the most deep tails of the GB diffusion penetration profiles for deducing P or Dgb values. Very often however the penetration profiles measured in theBregime conditions turn out to be remarkably curved, see e.g. the penetration profiles of Ag GB diffusion in polycrystalline Cu, Fig.5. A variety of different factors may affect the profile shape. For example, if the GB concentration of the solute is increased above the dilute limit level andcgb approaches a saturation level, non-linear solute segregation behavior has to be taken into account.21)The effect of non-linear segregation on the GB diffusion profile shape has already been analyzed.22,23)Moreover, motion of a fraction of GBs during the diffusion anneal24)and/or the existence of a spectrum of GBs with different diffusional characteris-tics,25,26)may result in a curvature of the penetration profiles. To establish reliably the physical nature of the processes coming into play in given experimental conditions, supple-mentary experiments are required, which involve the inves-tigations of the temperature dependence of the profile curvature, effects of alloying on GB diffusion and segrega-tion, and specially designed experiments on bicrystals. Especially the experiments on pure and alloyed bicrystals will provide an decisive answer in some situations, as will be shown below.
10 12 14 16 18 20 22 24 26
T -1 /10-4 K-1
10-30
10-29
10-28
10-27
10-26
10-25
10-24
10-23
10-22
10-21
10-20
10-19
P
=
s
δ
Dgb
/m
3 s
-1
1000 800 600 500 400
T /K
δ
Dgb
,
δω
’ /m
3 s
-1
s
P=sδDgb
P=δDgb
P=δω’
Fig. 4 Arrhenius plot of GB diffusion parameters measured in the B (P¼sDgb(circles)7)and (dotted line)20)) andC(P¼Dgb(squares)7)
andP¼!0(triangles)19) ) regimes.
1 2 3 4 5 6
y6/5 /10-5m6/5
rel.
specific activity /arb
. units
100 200 300
y /10-6m
623 K
675 K
723 K
Ag in Cu
[image:3.595.317.532.413.715.2] [image:3.595.61.274.445.713.2]2.4 Influence of movingboundaries on GB diffusion
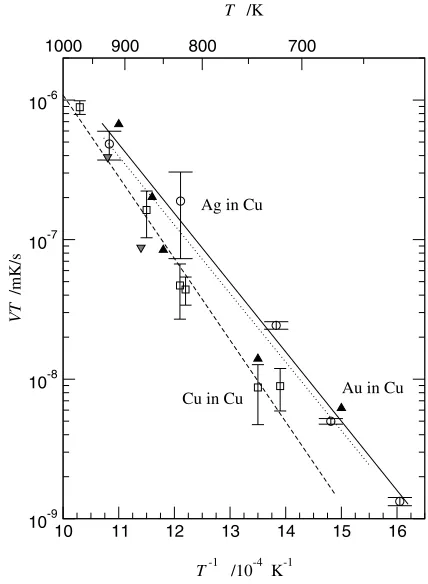
The effect of moving boundaries was systematically studied using different tracers in Cu matrices of different purities.27)If a fractionfðmovÞ6¼0of GBs moves during the
diffusion anneal, the GB diffusion-related part of the penetration profile can be presented by a sum of two exponentials:24)
cðy;tÞ ¼q1exp q2y
þq3exp q4y6=5
: ð3Þ
The first term with the parametersq1andq2describes the contribution of the moving GBs, whereas the second term represents diffusion in stationary GBs in type Bconditions (q3andq4). Using the fitted values of the parametersqi, the average GB velocityV and the fraction of the moving GBs fðmovÞ can be evaluated as24)
V ¼Pq22 ð4Þ
and
fðmovÞ¼ 1
1þ0:3205q3 q1
Vt ffiffiffiffiffiffiffi Dvt
p
3=2;
ð5Þ
respectively. Here,Pis the GB diffusivity calculated fromq4. The quantitiesV andf are the matrix related properties and should be mostly independent of the nature of the solute tracer in the dilute limit.
Our quantitative analysis of a larger series of type B diffusion profiles in Cu indeed yields reproducible results for a strongly segregating solute, like Ag, a slightly segregating solute, e.g. Au, and for GB self-diffusion experiments in polycrystalline Cu, Fig.6. We conclude that it is GB motion that dominantly influenced the penetration profiles in Ref. 7). Therefore, non-linear segregation plays no distinct role in our experiments on polycrystalline Cu,7)since the absolute tracer concentrations definitely range within the dilute limit in these experiments.
2.5 GB diffusion in alloys (Agin Cu)
To provoke non-linear segregation effects one can alloy inactive solute element to the matrix. Subsequent solute radiotracer GB diffusion experiments will proceed under the boundary condition that the segregation factor in the alloy,
salloy¼c
alloy gb
calloyv
; ð6Þ
is not changed along the GB penetration profile,salloy¼const for the given conditions and depends on the total concentra-tion of the solute in the matrix.28,29) Equation (6) can be applied, since the isotope equilibrium with respect to radiotracer and inactive solute atoms is expected to be maintained between the GB and the adjacent lattice at any depth.29)
Generally, when changing the volume concentration of a solute, a non-linear dependence of cgb on cv is expected30) andsalloywill differ from the corresponding segregation factor spuremeasured in pure metal (salloyspure).
Bernardiniet al.20)used eq. (6) to determine the segrega-tion behavior of Ag in an Cu(Ag) alloy. As a result they measured the enrichment factorbappearing in the McLean
isotherm30)(for the difference betweenband the segregation factorssee Ref. 7)). Measurements only performed in theB kinetic regime were required in that approach. The segrega-tion enthalpy was found to be 37kJ/mol20) in agreement with theB–Ctype GB diffusion measurements.7)
A closer inspection of the profiles measured for the Cu– 0.09 at%Ag alloy20) however reveals that they are partly curved (especially at the two highest temperatures). These features were not analyzed so far. Moreover, no direct measurements ofDgb in an alloy existed untill very recently. 2.5.1 Cregime GB diffusion measurements in an alloy
GB diffusion measurements in the Cu–0.2 at%Ag alloy in theCregime were carried out for the first time in Ref. 31). In Fig.7, the results of Ag GB diffusion in the Cu–0.2 at%Ag alloy are plotted together with the previous data on Ag GB diffusivityDgb7)in high-purity Cu. Both data sets are almost identical. The following Arrhenius dependence is established for Ag GB diffusion in the Cu(Ag) alloy:
Dalloygb ¼2:5104exp 108:8 kJ/mol
RT
m2/s: ð7Þ
Very similar values of the pre-exponential factor Dpure0 ¼
1:73104m2/s and the activation enthalpy Qpure gb ¼ 108:6kJ/mol were found for Ag GB diffusion in pure Cu.7) Thus,directmeasurements show that the Ag GB diffusivity in pure Cu and in the Cu–0.2 at%Ag alloy is the same within the limits of the experimental errors.
10 11 12 13 14 15 16
T -1 /10-4 K-1 10-9
10-8 10-7 10-6
VT
/mK/s
700 800
900 1000
T /K
Ag in Cu
Cu in Cu Au in Cu
[image:4.595.319.533.73.365.2]2.5.2 Bregime measurements in an alloy
The penetration profiles measured for Ag GB diffusion in the Cu–0.2 at%Ag alloy turned out to be remarkably curved, Fig.8, and this curvature does not monotonically depend on the temperature: at low and high temperatures the profiles are almost perfectly linear (e.g.atT ¼970and 668 K, Fig. 8), whereas the curvature is well pronounced at intermediate temperatures (e.g.atT ¼710, 762, and 892 K, Fig.8).
The profile curvature cannot be explained by direct bulk diffusion since the volume penetration depths amount to only a few micrometers. As it was already mentioned, several factors can potentially give rise to the curvature of penetra-tion profiles:e.g.(i) GB motion;24)(ii) existence of a wide spectrum of GBs with different diffusivities;25,26)(iii) non-linear segregation of solute atoms.21,22)
Careful analysis proved that a hypothetically assumed motion of GBs does not dominate the curvature of penetra-tion profiles in the Cu–Ag alloy, since the corresponding fractions of moving GBs would increase with decreasing temperature, a result which is physically unreasonable.
Furthemore it was hypothetically supposed31) that the curvature of the penetration profiles in Fig. 8originates from the presence of GBs with very different diffusivitiesPin the Cu(Ag) alloy. Although the GB diffusivities Pmay form a continuous spectrum, for simplicity the profiles were fitted by a sum of two Suzuoka solutions:32)
cðy;tÞ ¼Aexpqy6=5þAfastexp qfasty6=5
: ð8Þ
In this approximation it is assumed that only two classes of GBs with different diffusivities dominate the GB diffusion penetration, with ‘‘regular’’ (Aandq) and fast (Afastandqfast)
diffusivities. The parametersqandqfast determine the triple productsPalloyandPalloyfast , respectively, whereas the fractionf of the GBs with a regular diffusivity can be calculated as
f ¼ 1
1þAfast
A
ffiffiffiffiffiffiffiffiffiffiffi Palloyfast
Palloy
s :
ð9Þ
The temperature dependencies of Palloy and Palloy fast are plotted in Fig.9. It is seen that in spite of the crude approximation introduced by eq. (8), Palloy and Palloy
fast vary systematically with temperature and the following Arrhenius dependencies can be established:
Palloy¼3:241015exp 82:4 kJ/mol
RT
m3/s ð10Þ
and
Palloyfast ¼1:311015exp 67:1 kJ/mol
RT
m3/s: ð11Þ
The difference between Palloy and Palloy
fast may result from the difference in the respectivesand/orDalloygb values, since it is reasonable to assume thatis almost constant.
In Ref. 25) the curvature of the penetration profiles of Zn GB diffusion in Al was explained by the presence of large-angle GBs with remarkably different diffusivitiesDgb. This effect is not relevant in the present case, since the fraction of GBs showing different diffusivities does not remain inde-pendent on temperature but changes regularly with tempera-ture. The key arguments which lead to the conclusion that the variations inPare due to variations inshowever come from GB diffusion experiments on Cu bicrystals.
17 18 19 20 21 22 23
T -1 /10-4 K-1
10-16
10-15
10-14
Dgb
/m
2 /s
550 500 450
T /K
Fig. 7 Temperature dependence of Ag GB diffusion in the Cu–0.2 at%Ag alloy (filled circles, dashed line) in comparison with the Ag GB diffusivity in high-purity Cu7)(open circles, solid line). All data were measured under Cregime conditions.
0 2 4 6 8
k6/5⋅y6/5 (10-5m6/5)
Relati
v
e specif
ic acti
vity (arb
. units)
0 100 200 300
k⋅y (10-6 m)
762 K
710 K
668 K
892 K
k= 1.5
k= 1
k= 1
k= 1
970 K
k= 1
[image:5.595.67.273.72.347.2] [image:5.595.327.529.73.353.2] [image:5.595.307.548.567.641.2]2.6 GB diffusion in bicrystals (Agin Cu)
Cu bicrystals with orientations close to the ¼
5ð310Þ½001 GB were used.31) The tilt angle ¼36:0 is
reasonably far away from the exact 5 misorientation (¼36:9) to result in a GB diffusivity being similar to that
of random large-angle grain boundaries in polycrystalline Cu.33)
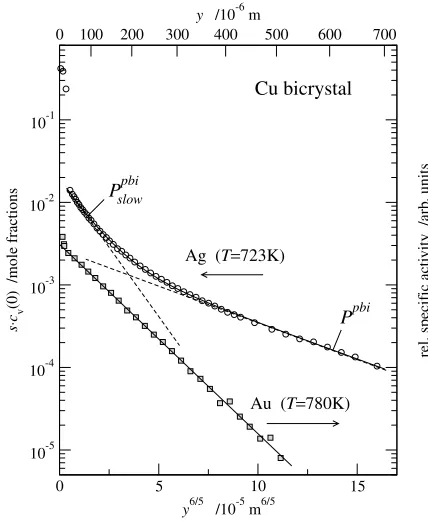
An Ag penetration profile measured on the bicrystal at T ¼723K is shown in Fig.10. From the Ag concentration in a layer section — known from the specific rediotracer activity — the absolute Ag concentration in the bulk adjacent to the GB, cvð0Þ, was deduced.31)Multiplying this value by the known segregation factor s for the dilute limit (deter-mined in7)), an upper estimation of the Ag tracer concentra-tion within the GB was obtained as scvð0Þ, Fig.10. (The real Ag GB concentration can be smaller thanscvð0Þin the case of non-linear segregation.) The amount of Ag tracer in the single boundary of the bicrystal was found to be remarkably higher than that in high-purity polycrystalline Cu when applying the same initial surface activity. This fact was explained31) by surface diffusion which drives a significant amount of tracer atoms to the single GB in case of a bicrystal versus a distribution over a large number of GBs in a polycrystal. As a result, the penetration profile in the bicrystal is substantially curved, a circumstance which becomes especially pronounced due to the large depth of profile detection (up to 700mm). If the profile in Fig. 10is processed according to eq. (8), the values of the GB
diffusivityPbislowandPbi(corresponding to the slow and fast diffusivity parts, respectively) can be determined. These values are shown in Fig.9 by filled (Pbislow) and open (Pbi) squares. Good agreement is observed with the data measured in the polycrystalline Cu–Ag alloy and in the pure Cu bicrystal, which indicates that the origin of the complex profiles in the Cu–Ag alloy and in the pure Cu bicrystals is the same. Measurements at other temperatures and in pre-alloyed Cu bicrystal supported this conclusion, Fig.9.
This common cause cannot be due to a multiplicity of GB structures, because Au GB diffusion in the same Cu near 5 bicrystal33) produces a nearly perfect type B penetration profile (Fig. 10). The profile curvature for Ag diffusion therefore originates from the much larger segregation factor for Ag in Cu than for Au in Cu (Fig.2).
Thus, the curvature in the Ag penetration profile in Fig.10 results from non-linear segregation.
2.7 Segregation isotherm of Ag in Cu
Having measured the Ag penetration profile of the quality given in Fig.10, one can determine the segregation isotherm for Ag in Cu atT¼723K from the GB diffusion measure-ments only. This has been done in the following steps:
1. The segregation factor for the deepest part of the profile (representing Henry type conditions) was calculated from the Arrhenius dependence established in pure Cu.7) 2. Since the specific activity of the tracer was fairly precisely known, the absolute bulk concentration of the Ag tracer adjacent to the GB, cvðyÞ, was estimated as function of the depthy.
10 11 12 13 14 15
T -1 /10-4 K-1 10-21
10-20 10-19
P
,
Ps
/m
3 /s
1000 900 800 700
T /K
P
fastalloyP
alloyP
pbiP
slowpbiP
abiFig. 9 Temperature dependence of Ag GB diffusivitiesPalloyfast (open circles) andPalloy(filled circles) in the polycrystalline Cu–0.2 at%Ag alloy and Ag
GB diffusivityPin pure Cu (dashed line). The solid lines represent the Arrhenius fits. For comparison, the GB diffusivitiesPpbi(open squares)
andPpbislow(filled squares) measured in a Cu near 5ð310Þ½001bicrystal are shown. The GB diffusivity Pabi of pre-alloyed Cu bicrystal is also
presented (triangle).
0 5 10 15
y6/5 /10-5m6/5
10-5
10-4
10-3
10-2
10-1
s
⋅
cv
(0) /mole fractions
0 100 200 300 400 500 600 700
y /10-6m
rel. specif
ic acti
vity /arb
. units
Au (T=780K)
Cu bicrystal
Ag (T=723K)
Ppbi
[image:6.595.318.532.73.334.2]Ppbi slow
Fig. 10 Penetration profiles of Ag (circles, left ordinate) and Au (squares, right ordinate) GB diffusion in a Cu near ¼5ð310Þ½001bicrystal. The Ag concentration is given in mole fractions,sandcvð0Þare the segregation
factor and the concentration in the volume adjacent to the GB, respectively. The solid line presents the four-parameter fit according to eq. (8), from whichPpbiandPpbi
[image:6.595.66.277.73.351.2]3. BecauseDalloygb ¼Dpuregb for Ag GB diffusion (Fig.7) and because there exists no variation of P along the Au penetration profile in the same bicrystal (Fig.10), it is reasonable to assume that Dgb¼const along the Ag penetration profile.
4. When applying the Fisher model34)and introducing the segregation isothermcgb¼gðcvÞ, the GB concentration of the Ag tracer follows the equation:
@2c gb
@y2 ¼L 2c
v¼L2g1ðcgbÞ: ð12Þ
HereLis the reduced depth,L¼ ffiffiffiffiffiffiffiffiffiffiDgb p
ð4Dt
vÞ 1=4.
5. Since the solution of eq. (12) is known at large depths in terms of the Fisher model, cvðyÞ ¼c0vexpðy=Ls
1=2Þ
andcgbðyÞ ¼scvðyÞ, one can integrate eq. (12) and the relation
cgbðyÞ ¼L2 Zy
1 dv
Zv
1
cvðuÞdu ð13Þ
yields the segregation isotherm (withvandubeing the integration variables).
The result,i.e.cgbas a function ofcv, is presented in Fig.11. We note as important progress that one can determine the segregation isotherm already starting from very small GB concentrations by using very sensitive radiotracer GB diffusion measurements with a suitable tracer on bicrystals.
2.8 GB segregation of Ag in pure and alloyed Cu
In Fig.9 the data on Ag GB diffusion in Cu–0.2 at%Ag alloy are compared with the results on Ag GB diffusion in high-purity Cu.7) It is seen that the diffusivity Palloyfast ¼
salloyfast alloyDalloy
gb of the ‘‘fastest’’ GBs in the Cu–0.2 at%Ag alloy practically coincides with the data on Ppure¼spure
pureDpuregb in high-purity Cu.7)Since the direct (Cregime) measurements of the GB diffusion coefficients in pure Cu and in the Cu–0.2 at%Ag alloy gave the same results, Dalloygb ¼Dpuregb (cf. Fig. 7), one can conclude that the segregation factors of Ag in pure Cu,spure, and in the fastest GBs of the Cu–0.2 at%Ag alloy,salloyfast , are also similar since it is reasonable to assume that alloy¼pure. The fact that salloyfast ¼spureindicates that in the studied temperature interval
and for the given alloy composition, the Ag GB concentration in a part of the GBs corresponds to the dilute limit of segregation and diffusivities of such GBs are the same as in pure Cu. Other GBs contain a relatively high concentration of Ag atoms, and these are those GBs that reveal the slower diffusivitiesPalloy.
Since Dalloygb ¼Dpuregb , the difference between Palloyfast and Palloyis mainly related to the difference in the corresponding segregation factors, meaning that salloy<salloy
fast and thus salloy<spure.
It is not unusual that segregated atoms do not cover uniformly all GBs in a polycrystalline sample. In Ref. 35), a broad distribution of the amount of Bi atoms segregated at GBs in polycrystalline Cu was reported using high-resolution transmission electron microscopy. While part of the Cu GBs was covered by Bi atoms, it was impossible to detect Bi segregation in other GBs.35) Furthermore, in an Auger Electron Spectroscopy study a sample has to be fractured
in situ along GBs to determine the segregation character-istics. The sample is more likely to brake along GBs with a higher concentration of segregated atoms (which usually induce GB brittleness), while less segregated GBs cannot be studied.
Having determined the Cu(Ag) alloy diffusivity in theC kinetics, Dalloygb , and in theBkinetics,Palloy, it is possible to calculate the segregation factor in the alloy, salloy, as a function of temperature using eq. (2). According to the Cu– Ag phase diagram,36)0.2 at% of Ag in Cu corresponds to the solid solubility limit at T550K. This means that the B regime measurements31)were completely performed in the interval of Ag solid solution in Cu.
In order to determinesone cannot, as usual, extrapolate the Pvalues to low temperatures, since the bulk solubility limit would be approached and the precipitation enthalpy may become involved. Thus, theDalloygb values were extrapolated to higher temperatures having in mind thatDalloygb corresponds to the solid solution of Ag in Cu (Fig.12). The segregation of Ag in Cu–0.2 at%Ag alloy can be presented by the following Arrhenius dependence:
salloy¼ 3:4þ4:5 1:9
102
exp ð25:76ÞkJ/mol
RT
:
ð14Þ
These values correspond to the GBs significantly covered with segregated Ag atoms.
3. Classification of Diffusion Kinetics in Two-scale Materials
Harrison’s classification6)of diffusion processes in GBs is based on the classical Fisher’s model.34)Three regimes are introduced,A,B, andCin dependence on the given diffusion parameters.6)Two of them (BandC) were partially described above. This classification was refined introducing subregimes A0, B1, B2, B3, B4, and C0 for GB diffusion in poly- and bicrystals.1)
However, in real materials different types of short-circuit diffusion paths can co-exist, a fact which modifies diffusional transport. For example, in presence of a dislocation network
0 0.05 0.1 0.15 0.2 0.25 0.3
cv /at.% 0.0
0.2 0.4 0.6 0.8 1.0 1.2
cgb
/at.%
sHenry
[image:7.595.57.285.582.767.2]T= 723K
tracer outdiffusion from GBs can occur at first along adjacent dislocation pipes with subsequent outdiffusion into bulk. Or, if each grain consists in a number of subgrains, the existence of both large-angle and small-angle boundaries should be taken into account. This was recognized by Klinger and Rabkin and they introduced newDiregimes.37)
Recently, a new, more transparent classification was introduced which explicitely reflects the existence of two types of short-circuit diffusion paths in the material.38–40) This classification refers to the microstructure which is presented in Fig. 13(a) and is sketched in Fig. 13(b). This microstructure was observed in the nanocrystalline -FeNi material produced by compacting and sintering the powders of Fe and Ni oxides.39,41) The individual nano-scale grains (d’80{100nm) are arranged in micrometer-size clusters or agglomerates (da’30{50mm). Accordingly, nanocrystal-line GBs (intra-agglomerate boundaries) exist along with the inter-agglomerate boundaries.
3.1 Basic equations of GB diffusion in a two-scale material
Three diffusion fluxes generally coexist in such two-scale nanocrystalline material, Fig.13(b): (i) direct bulk diffusion from the external surface into grain interior,c1, (ii) diffusion along nanocrystalline boundaries with subsequent outdiffu-sion into bulk, c2, and (iii) fast diffusion along inter-agglomerate boundaries with subsequent outdiffusion in the adjacent nanocrystalline GBs, diffusion along these GBs, and final outdiffusion into bulk of the grains,c3.
The flux c3 is specific for such two-scale structure. To
describe the term c3ðy;tÞ the Fisher model34) was re-formulated for inter-agglomerate boundary diffusion from a constant source.40)The tracer concentrationscvðx;y;tÞin the bulk, cgbðx;y;tÞ in nanocrystalline grain boundaries, and caðx;y;tÞin inter-agglomerate boundaries are to be consid-ered. The analytic solution was derived under following approximations (see Fig.13(c)):
1. Diffusion in the nanocrystalline grains (bulk diffusion) occurs primarily normal to the local position of the GB,
i.e.in theydirection in Fig.13(c),cvðx;y;tÞ ¼cvðy;tÞ. The direct bulk diffusion from the surface into the grain is assumed to be negligible.
2. The relationship
DaDgb Dv ð15Þ
is supposed to be valid. Here Da is the diffusion coefficient of the inter-agglomerate boundaries,Dgbthe diffusivity of nanocrystalline GBs, and Dv the bulk diffusivity. Thus, the tracer atoms enter the GB slabs only by leaving the inter-agglomerate boundary along the x direction, while direct GB diffusion along the nanocrystalline GBs from the surface is neglected. Thus, cbðx;y;tÞ ¼cbðx;tÞ. Moreover, the condition @cbðx;tÞ=@t0is assumed when describing bulk diffu-sion. The latter means that outdiffusion from the
12 14 16 18 20 22
T -1 /10-4 K-1
10-26
10-25
10-24
10-23
10-22
10-21
10-20
10-19
P
alloy
/m
3 /s
600
800 700
900 500
T /K
10-26
10-25
10-24
10-23
10-22
10-21
10-20
10-19
δ⋅
Dgb
alloy
,
δ⋅
D
gb
pur
e /m 3 /s
C regime
B regime
[image:8.595.306.545.71.399.2]s
alloyFig. 12 Determination of Ag segregation factorsalloyin the Cu(Ag) alloy
by combined GB diffusion measurements in theB(Palloy, circles) andC
[image:8.595.50.287.73.345.2](Dalloygb , squares) kinetics. The filled squares represent the productDalloygb calculated by using the directly measured Dalloygb values and the open squares correspond to the results evaluated by usingDpuregb .
Fig. 13 Microstructure of the nanocrystalline-Fe–40 mass%Ni alloy39) (a) and its schematic presentation (b, c). The squares represent individual nano-grains with the bulk diffusivityDv. The inter-agglomerate
bound-aries with a relatively larger fraction of the associated free volume (the diffusivityDaand the widtha) and regular nanocrystalline boundaries
nanocrystalline GBs into the bulk occurs in nearly constant-source conditions.
3. With respect to GB diffusion, the tracer distribution within the inter-agglomerate boundaries is established within a very short period of time and the relations
caðx;y;tÞ ¼caðy;tÞand@caðy;tÞ=@tjt>0is assumed. Considering the interfaces as homogeneous slabs with the given diffusivities and the given widths, Fig. 13(b), the following equations can be written for the concentrationsca, cb, andcv:
@caðy;tÞ
@t ¼Da @2c
aðy;tÞ @y2 þ
2 a
Jb jxj¼
a=2 þ2 a Jv j j¼x
a=2
; j jx <a
2 ; ð16Þ
@cbðx;tÞ @t ¼Dgb
@2cbðx;tÞ @x2 þ
2Dv
@cvðy;tÞ @y
y
j j¼=2
; j jx >a
2 ; y <
2; ð17Þ
@cvðx;y;tÞ @t ¼Dv
@2cvðx;y;tÞ
@x2 þ
@2cvðx;y;tÞ @y2
; j jx > a=2; y > =2: ð18Þ
HereJbandJvare the fluxes of tracer atoms leaving the inter-agglomerate boundary through adjacent nanocrystalline GBs and the bulk, respectively. The factor takes into account that outdiffusion from an inter-agglomerate boundary takes place only through regions where nanocrystalline boundaries (of the width ) cross the inter-agglomerate boundary. For cubic grains¼2=d, while in a general case of a polyhedral grain shape¼2d.
A nomenclature combining two symbols, each one for the given type of boundaries, was introduced, for example aC–B regime. The first letter (in this example, C) indicates the diffusion regime in nano-GBs while the second one (B) diffusion regime in inter-agglomerate interfaces. The com-bined diffusion regimes depend on the standard parameters, , and%for nano-GB diffusion,
¼
2 ffiffiffiffiffiffiffiDvt
p ; ¼ Dgb
2Dv ffiffiffiffiffiffiffi Dvt
p ; %¼ dffiffiffiffiffiffiffi Dvt
p ; ð19Þ
and new parameters a, a, and %a for inter-agglomerate boundary diffusion (see below).
Generally, the segregation factor s also enters these expressions, but the case of self-diffusion is considered here, s¼1. Large values of( >1) correspond to the conditions of negligible volume diffusion in which the diffusion process is confined to the interfaces of the thicknesses and a. Otherwise, if <0:1, bulk diffusion is strongly involved in the overall diffusion process.
3.2 TheC–Cdiffusion regime
To satisfy the conditions of this regime very low temperatures and short diffusion times should be chosen that would suppress any outdiffusion from both types of inter-faces. The conditions of theC–Cregime are:
>1;
a¼ a
2 ffiffiffiffiffiffiffiffiffiDgbt
p >1: ð20Þ
These conditions mean that tracer atoms do not leave both nanocrystalline and inter-agglomerate boundaries. For the instantaneous source conditions, the overall diffusion profile cðy;tÞis represented by a sum of two Gaussians
cðy;tÞ ¼q3exp q4y2
þq5exp q6y2
ð21Þ
which define the diffusivities Dgb and Da by standard expressions:
Dgb¼ 1 4tq4
and Da¼ 1 4tq6
: ð22Þ
3.3 TheC–Bdiffusion regime
As the temperature increases, tracer atoms can leave inter-agglomerate boundaries by outdiffusion along adjacent nanocrystalline boundaries. Since bulk diffusion is still frozen out, the tracer will then diffuse only along nanocrys-talline GBs. The conditions of theC–Bdiffusion regime are:
>1;
a<0:1; a¼ Pa
2Dgb ffiffiffiffiffiffiffiffiffi Dgbt
p 2; da
Lgb
>4: ð23Þ
Here Lgb is the diffusion length along the nanocrystalline GBs, Lgb¼
ffiffiffiffiffiffiffiffiffi Dgbt p
. The condition da=Lgb >4 limits the B regime.38)The diffusion process is confined to nano-GBs and inter-agglomerate boundaries.
The overall diffusion profilecðy;tÞis:
cðy;tÞ ¼q3exp q4y2
þq5exp q6y6=5
: ð24Þ
The first term,c2ðy;tÞ ¼q3expðq4y2Þ, corresponds to direct diffusion from the surface into nanocrystalline GBs, which occurs in the C regime, while the second term, c3ðy;tÞ ¼q5expðq6y6=5Þ, represents a faster diffusion mode from the surface into inter-agglomerate boundaries with subsequent outdiffusion into adjacent nanocrystalline GBs. Since this outdiffusion is quite significant, ffiffiffiffiffiffiffiffiffiDgbt
p
a=,
the formal B-type conditions of interface diffusion are fulfilled for the termc3ðy;tÞ.39) The parameterq4 allows to calculate the diffusivity of nano-GBs, Dgb, and the inter-agglomerate boundary diffusivity Pa¼aDa= is defined as solution of eqs. (16)–(18) in the given conditions:42)
Pa¼0:661 4Dgb
t
1=2
q65=3: ð25Þ
3.4 TheB–Bdiffusion regime
If temperature increases further, the bulk diffusion flux becomes more significant and cannot be neglected. As a result, three diffusion modes contribute to the overall penetration profilecðy;tÞ:
cðy;tÞ ¼q1exp q2y2
þq3exp q4y6=5
þq5exp q6y
:
ð26Þ
Here c1ðy;tÞ ¼q1expðq2y2Þrepresents the contribution of direct volume diffusion from the sample surface into the nano-grains, c2ðy;tÞ ¼q3expðq4y6=5Þ corresponds to the tracer which comes into the bulk through GB diffusion along nanocrystalline boundaries with subsequent outdiffusion into the grain interior, andc3ðy;tÞ ¼q5expðq6yÞrepresents the amount of tracer which diffuses along inter-agglomerate boundaries with subsequent outdiffusion to nano-boundaries and then into the grains. Since the bulk diffusion length is smaller than grain size, ffiffiffiffiffiffiffiDvt
p
<d’100nm, the first term cannot be measured by the conventional radiotracer method and the experimental profiles should be fitted with four unknown parametersq3,q4,q5, andq6.
The termc2ðy;tÞin eq. (26) corresponds to GB diffusion in the Bregime. The last termc3ðy;tÞyields the productPa¼ aDa=for inter-agglomerate boundary diffusion in theB–B kinetic regime as it was derived by solving eqs. (16)–(18):40)
Pa¼1:798 ffiffiffiffiffiffiffiffi Dgb r
Dv t
1=4
q6 2
: ð27Þ
The parameters 0
a and 0a, which characterize the B–B regime have to be redefined as40)
0a¼ a
ffiffiffiffiffiffiffiffiffiffiDgb
p 4Dv
t
1=4
; 0a¼ Pa
Dgb ffiffiffiffiffiffiffiffiffiffi Dgb
p 4Dv
t
1=4
:
ð28Þ
The formal conditions of the B–B diffusion regime are determined by the relations:
<0:1; 2; dffiffiffiffiffiffiffi Dvt
p >4;
0
a<0:1; 0 a2;
da
Lgb >4:
ð29Þ
HereLgb¼ ffiffiffiffiffiffiffiffiffiffi Dgb p
=ð4Dv=tÞ1=4is the diffusion length along nano-GBs. Monte-Carlo simulation of combined inter-ag-glomerate boundary, nanocrystalline GB, and bulk diffusion in the case of cubic grains resulted in almost linear dependence of lnc against yn with n¼1:050:02.40)
Therefore n can be well approximated by unity and the diffusivity Pa of the inter-agglomerate boundaries can be reliably calculated from eq. (27).
Typical penetration profiles measured for Ni diffusion in nano--Fe–Ni along with the fits according to eq. (26) are presented in Fig.15.
3.5 TheA–Bdiffusion regime
As the annealing temperature increases further, the bulk diffusion flux increases until the condition ffiffiffiffiffiffiffiDvt
p
>d is established and the regime of diffusion along nanocrystalline GBs changes. In this new regime the clusters of the nano-grains as a whole are characterized by an effective diffusivity Deff, which according to Hart43)is given by
0 0.5 1 1.5 2 2.5 3
y6/5 /10-5m6/5
rel. specif
ic acti
vity /arb
. units
0 50 100 150
y /µm
702 K
664 K
[image:10.595.319.533.75.369.2]609 K
Fig. 14 Penetration profiles of Ni GB diffusion in nano--Fe–Ni in theC– Bregime.40)
0 1 2 3 4 5
y6/5 /10-5m6/5
rel. specif
ic acti
vity /arb
. units
941 K 881 K 844 K
0 100 200
y /µm
[image:10.595.66.277.78.369.2]Deff ¼fgbDgbþ ð1fgbÞ Dv: ð30Þ
Herefgb is the volume fraction of the nanocrystalline GBs, which isfgb¼gd (wheregis a geometrical factor of about unity). Taking into account that in typical case Deff Dv, eq. (30) becomes
Deff¼fgbDgb: ð31Þ
Then, the penetration profile is composed of two parts:
cðy;tÞ ¼q1expq2y2
þq5expq6y6=5
: ð32Þ
Herec12ðy;tÞ ¼q1expðq2y2Þrepresents the contribution of direct diffusion from the sample surface into the clusters of the nano-grains characterized by the effective diffusivity Deff, whereas c3ðy;tÞ ¼q5expðq6y6=5Þ represents the amount of tracer which diffuses along inter-agglomerate boundaries with subsequent outdiffusion into the agglomer-ates.
Under these conditions the inter-agglomerate boundary diffusion problem is mathematically identical to the standard GB diffusion problem characterized by the ‘GB diffusivity’ P00
a ¼aDa and the effective ‘bulk diffusivity’ Deff. The parameters that define this regime are:
00a¼ a
2 ffiffiffiffiffiffiffiffiffiffiDefft
p ; 00a ¼ P
00 a 2Deff ffiffiffiffiffiffiffiffiffiffiDefft
p : ð33Þ
The diffusivity of the inter-agglomerate boundaries can be calculated as:
P00a ¼aDa¼1:308 Deff
t
1=2
q65=3: ð34Þ
Summarizing, the conditions of theA–Bdiffusion regime in the two-scale structure are determined by the relations:
<0:1; ffiffiffiffiffiffiffid Dvt
p <0:3;
0
a<0:1; 0a2; da
Lgb >4:
ð35Þ
HereLgb¼ ffiffiffiffiffiffiffiffiffiffiDefft
p
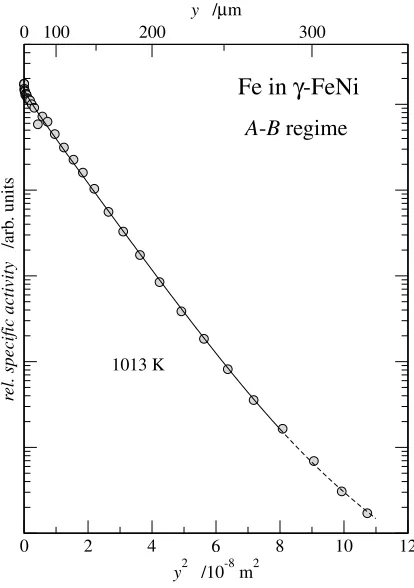
is the diffusion length with respect to the agglomerate interior in the A regime. Experimentally these conditions were satisfied for Fe diffusion in nano--Fe–Ni,39) Fig.16.
3.6 Transition regimeABand subregimeAB–B If the conditions of theAdiffusion regime are not strictly satisfied and the volume diffusion penetration ffiffiffiffiffiffiffiDvt
p
is about the grain sized, a transition regimeABcan be defined.38)The strict condition of the transitionABregime are:0:3< ffiffiffiffiffiffid
Dvt
p < 4and the corresponding part of the penetration profile should be linear in coordinates of logarithm of concentration vs. y3=2.38)Then, the penetration profile in a two-scale material is
composed of two parts:
cðy;tÞ ¼q1expq2y3=2
þq5exp q6y6=5
: ð36Þ
The GB diffusivity can then be calculated from the first part of the penetration profiles as:38)
Dgb¼16:48 D0:1v 0:2t0:9q
4=3
2 : ð37Þ
The productP0
ais suggested to estimate from eq. (34) with Deff calculated through eq. (31). This introduces an error in the analysis, but it should not be too large sinceP0
adepends on the square root ofDeff, see eq. (33). Experimental profile and the fit according to eq. (36) are shown in Fig.17.
3.7 GB diffusion in nanocrystalline Fe–Ni alloy
Using the derived mathematical treatment, eqs. (15)–(37), Ni and Fe diffusion in the two-scale nanocrystalline-Fe–Ni alloy was measured with the radiotracers63Ni and59Fe and subsequently analyzed.39,40)In the case described, Ni diffu-sion along nanocrystalline GBs was measured in the C, B, and AB conditions, with the GB diffusivity Dgb measured directly in theCandABregimes and the productP¼Dgb determined in theBregime. Summarizing all results derived in different regimes of GB diffusion and assuming ’0:5nm, the temperature dependence of the GB-diffusion coefficient Dgb in the nanocrystals is plotted in Fig.18. Different symbols are used to distinguish between the different regimes. Although quite different shapes of the penetration profiles were observed in different regimes and the profiles were processes in different ways, the whole set of data reveals a good systematics and the following summar-izing Arrhenius dependence can be derived:
Dgb¼ 9:3þ23:96:7
104exp ð1778ÞkJ/mol
RT
m2/s:
ð38Þ
Since Ni GB diffusion in coarse-grained -Fe–Ni alloys has not been measured, the diffusivity of nanocrystalline GBs
0 2 4 6 8 10 12
y2 /10-8m2
rel. specif
ic activity
/arb
. units
0 100 200 300
y /µm
1013 K
Fe in
γ
-FeNi
[image:11.595.323.530.75.369.2]A
-
B
regime
can be compared with Ni GB diffusion in coarse-grained -Fe44,45) (Fig.18). While Ni bulk diffusion was found to depend only slightly on the composition of the-FeNi alloys
and is similar to Ni diffusivity in pure-Fe,46)a similar trend is expected also for GB diffusion in such alloys. Figure 18 suggests that Ni GB diffusivity in nanocrystalline GBs of the -Fe–40 mass%Ni alloy is close to that in conventional coarse-grained -Fe. The same feature was observed for Fe GB diffusion in nanocrystalline-Fe–40 mass%Ni.39)
The temperature dependence of Ni inter-agglomerate boundary diffusion Da is also presented in Fig. 18. The inter-agglomerate boundary widthawas taken asa’1nm. The different symbols are used to distinguish between the data derived in different GB diffusion regimes. The whole set of data can be approximated by the following Arrhenius dependence:
Da¼ 1:9þ1:91:0
103exp ð1347ÞkJ/mol
RT
m2/s:
ð39Þ
Inter-agglomerate boundary diffusion is orders of magni-tude faster than Ni GB diffusion along nanocrystalline GBs while the corresponding activation enthalpyQais smaller.
The difference betweenDgb andDawas explained by the relaxed state of the nanocrystalline GBs and a non-equili-brium character of the inter-agglomerate boundaries39,40) resulting from the specific preparation method of the nanocrystalline-Fe–Ni alloy which allowed growth of the nano-grains from about 20 to about 100 nm of the grain diameter during the heat treatment of the powder sintered.
4. Conclusions
GB diffusion measurements are shown to represent a powerful tool for studying GB equilibrium segregation in true dilute (Henry) limit. At present there exist already ample information on equilibrium segregation of different solutes in Cu and Ag.
GB diffusion measurements on bicrystals yield specific and unique information on linear and non-linear segregation behavior. Compiling a large body of experimental data concerning Ag GB diffusion in high-purity polycrystalline Cu, Cu–Ag polycrystalline alloys, and in Cu bicrystals allowed to extract the corresponding segregation isotherm from GB diffusion data.
Combination of GB diffusion measurements in pure and alloyed metals and in pure and pre-alloyed bicrystals allowed to draw justified conclusions and to distinguish the effects of moving boundaries, non-linear segregation, and a hypothe-tical variation of the GB diffusivitiesDgb.
Harrison’s classification scheme of GB diffusion regimes was extended including two-scale nanocrystalline materials. Rigorous application of the derived mathematical treatment allowed to extract the GB diffusivity of both nanocrystalline and inter-agglomerate boundaries from the results of radio-tracer measurements in the two-scale nanocrystalline-Fe– Ni alloy.
There are further crucial developments in the field of GB diffusion research which were not directly addressed here but are of prime importance. In following they will be briefly presented.
10 11 12 13 14 15 16
T -1 /10-4K-1
10-17
10-16
10-15
10-14
10-13
10-12
10-11
10-10
Dgb
/m
2 /s
AB regime
B regime
C regime
1000 900 800 700
T /K
[image:12.595.67.277.75.375.2]A-B regime B-B regime C-B regime
Fig. 18 Arrhenius plot of Ni GB diffusion in two-scale nanocrystalline -Fe–Ni in different kinetic regimes40)in comparison with Ni GB diffusion in coarse-grained -Fe measured in Refs. 44) (dashed line) and 45) (dashed-dotted line).
0 1 2 3 4
k3/2⋅y3/2 /10-6m3/2
rel. specif
ic acti
vity /arb
. units
1013 K
1002 K
0 100 200
k⋅y /µm
k
=
2
[image:12.595.66.274.423.680.2]k
=
1
GB diffusion in intermetallic compounds.Considerable progress was recently achieved in GB diffusion in ordered intermetallics. However, GB diffusion is still investigated to a much smaller extent than bulk diffusion. Experimental information is available already for Ni–,47–50) Ti–,51) and Fe–52)aluminides and a few other compounds,e.g.Ni2Si,53) Ni2Si5 and CoSi2.54) The effect of composition on GB diffusion in intermetallic compounds, which accommodate large deviations from the stoichiometric composition, was carefully studied in Ni–47,55)and Ti–51)aluminides. While in Ni3Al and Ti3Al a remarkable compositional dependence of both the triple productPand the activation enthalpyQgbwas observed, such a dependence was in the limits of experi-mental uncertainties in equiatomic NiAl and TiAl in the studied compositional intervals. Moreover, GB diffusion was slowest in stoichiometric Ni3Al, whereas Al-richest Ti3Al alloys reveal the smallest GB diffusivity P and the largest activation enthalpyQgb. These features still wait for a reliable explanation from an atomistic point of view. Other feature, which should be explained, is the large ratio of the activation enthalpies of GB and bulk diffusion, which can amount up to 0.9 and even higher.51,54)
Recently, experimental data on GB diffusivity of inter-phase boundaries in technologically important polysyntheti-cally twinned (PST) TiAl alloy were obtained.56) Titanium diffusion along the2= boundaries turned out to be similar to the Ti GB diffusivity of the Al-richest2-Ti3Al phase and by two orders of magnitude smaller than Ti GB diffusion in the -TiAl.56) This effect was explained by the specific atomistic structure of the2= interfaces.57)
Our general understanding of GB diffusion in intermetallic compounds has still to be improved on the atomistic level in many details. For example, particular diffusion mechanisms in GBs, the effect of the order and of structural multiplicity are not well elucidated.58)It is not clear if the local disorder at GBs occurs by the same mechanism as in the bulk, i.e. by means of anti-structure atoms or structural vacancy forma-tion.58)
GB phase transitions.It was recently recognized that the phase transitions in GBs may reveal their own specific features.59,60)GB wetting phase transition occurs for some systems in the liquid–solid two-phase area of the bulk phase diagram. Above the given temperature (the wetting tempera-ture) a GB cannot exist in equilibrium with the liquid and the liquid phase substitutes the GB and separates the two grains.60) Most prominent examples of such behavior are the Cu–Bi and Al–Ga systems. It was suggested that below the solidus prewetting phenomena may occur that can drastically influence the GB diffusivity in such systems.59) Systematic GB diffusion measurements are required to prove the predictions of the prewetting theory.
Atomistic mechanisms of GB diffusion. Remarkable progress was recently achieved in our understanding of underlying mechanisms of GB diffusion in pure metals. Both, vacancies and interstitials were found to be formed in a GB core, with vacancy delocalization and instability at certain GB positions being important features.61,62) Different ato-mistic mechanisms were established for a GB: a vacancy can move by single-atom exchanges or perform collective jumps which involves several atoms. Even defect-free ring
displa-cements of several atoms in a GB core were observed.62) Interstials move predominantly by the interstitialcy mechan-ism involving several atoms.62)However, the calculation of the GB diffusivity as a function of misorientation in comparison with available experimental data presents still a challenging problem.
Acknowledgment
The present investigation was supported by funds of the Deutsche Forschungsgemeinschaft (Project He848/24-1).
REFERENCES
1) I. Kaur, Y. Mishin and W. Gust:Fundamentals of Grain and Interphase Boundary Diffusion (Wiley & Sons LTD, Chichester, New York, 1995).
2) I. Kaur, W. Gust and L. Kozma:Handbook of Grain and Interphase Boundary Diffusion Data, (Ziegler, Stuttgart, 1989).
3) Y. Mishin, Chr. Herzig, J. Bernardini and W. Gust: Int. Mater. Rev.42
(1997) 155.
4) Y. Mishin and Chr. Herzig: Mater. Sci. Eng. A260(1999) 55. 5) Y. Mishin and Chr. Herzig: Grain Boundary Diffusion in Metals, in:
Diffusion in Condenced Matter, (eds.) J. Ka¨rger, P. Heitjans, and R. Haberlandt (Vieweg & Sohn Verlagsgesellschaft mbH, Braunschweig/ Wiesbaden, 1998).
6) L. G. Harrison: Trans. Faraday Soc.57(1961) 597.
7) S. V. Divinski, M. Lohmann and Chr. Herzig: Acta Mater.49(2001) 249.
8) P. Gas, D. L. Beke and J. Bernardini: Philos. Mag. Lett.65(1992) 133. 9) J. Sommer and Chr. Herzig: J. Appl. Phys.72(1992) 2758. 10) T. Surholt and Chr. Herzig: Acta Metall.45(1997) 3817.
11) T. Surholt, C. Minkwitz and Chr. Herzig: Acta Mater.46(1998) 1849. 12) Chr. Herzig, J. Geise and Y. Mishin: Acta Metall. Mater.41(1993)
1683.
13) T. Surholt, Y. Mishin and Chr. Herzig: Phys. Rev. B50(1994) 3577. 14) E. D. Hondros and M. P. Seah: Met. Trans. A8(1977) 1363. 15) E. D. Hondros:Interfaces, (ed. R.C. Gifkins) (London, Butterworths,
1969), 77.
16) P. Gas, M. Guttman and J. Bernardini: Acta Metall.30(1982) 1309. 17) P. Gas, S. Poize and J. Bernardini: Acta Metall.34(1986) 359. 18) P. Gas, S. Poize, J. Bernardini, F. Cabane and J. Cabane: Defect
Diffusion Forum66–69(1989) 905.
19) Z. Erde´lyi, Ch. Girardeaux, G. A. Langer, D. L. Beke, A. Rolland and J. Bernardini: J. Appl. Phys.89(2001) 3971.
20) J. Bernardini, Zs. Toˆkei and D. L. Beke: Philos. Mag. A73(1996) 237. 21) B. S. Bokstein, V. E. Fradkov and D. L. Beke: Philos. Mag. A65(1992)
277.
22) Y. Mishin and Chr. Herzig: J. Appl. Phys.73(1993) 8206.
23) B. Bokstein, A. Ostrovsky and J. Bernardini: Mater. Science Forum
294–296(1999) 581.
24) F. Gu¨thoff, Y. Mishin and Chr. Herzig: Z. Metallkd.84(1993) 584. 25) D. L. Beke, I. Go¨de´ny, G. Erde´lyi and F. J. Kedves: Philos. Mag. A56
(1987) 659.
26) D. Gupta: Defect Diff. Forum156(1998) 43.
27) S. V. Divinski, M. Lohmann, T. Surholt and Chr. Herzig: Interface Sci.
9(2001) 357.
28) J. Bernardini and G. Martin: Scr. Metall.10(1976) 833.
29) J. Bernardini and P. Gas: Defect Diffusion Forum95–98(1993) 393. 30) D. McLean:Grain Boundaries in Metals, (Clarendon Press, Oxford,
1957).
31) S. V. Divinski, M. Lohmann and Chr. Herzig: Interface Sci.11(2003) 21.
32) T. Suzuoka: J. Phys. Soc. Japan19(1964) 839.
33) E. Budke, T. Surholt, S. I. Prokofjev, L. S. Shvindlerman and Chr. Herzig: Acta Mater.47(1999) 385.
34) J. C. Fisher: J. Appl. Phys.22(1951) 74.
37) L. Klinger and E. Rabkin: Acta Metall.47(1999) 725.
38) S. V. Divinski, F. Hisker, Y.-S. Kang, J.-S. Lee and Chr. Herzig: Z. Metallkd.93(2002) 256.
39) S. V. Divinski, F. Hisker, Y.-S. Kang, J.-S. Lee and Chr. Herzig: Z. Metallkd.93(2002) 265.
40) S. V. Divinski, F. Hisker, Y.-S. Kang, J.-S. Lee and Chr. Herzig: Interface Sci.11(2003) 67.
41) P. Knorr, J. G. Nam and J. S. Lee: Metall. Mater. Trans. A31(2000) 503.
42) I. L. Balandin, B. S. Bokstein, V. K. Egorov and P. V. Kurkin: Nanostr. Mater.8(1997) 37.
43) E. W. Hart: Acta Metall.5(1957) 597.
44) Y. Hanatate, K. Majima and H. Mitani: Trans. JIM19(1978) 669. 45) M. A. Krishtal, A. P. Mokrov, O. V. Stepanov and L. A. Goncharenko:
Zashch. Pokryt. Metal.2(1968) 201.
46) P. Million, J. Ruzickova, J. Velisek and J. Vrestal: Mater. Sci. Engng.
50(1995) 43.
47) St. Frank and Chr. Herzig: Mater. Sci. Engng.239–240(1997) 882. 48) J. Cermak, J. Ruzickova, I. Stloukal and A. Pokorna: Scr. Mater.37
(1997) 31.
49) J. Cermak, I. Stloukal, J. Ruzickova and A. Pokorna: Intermetallics6
(1998) 21.
50) N. P. Zulina, E. V. Bolberova and I. M. Razumovski: Defect Diffusion
Forum143–147(1997) 1453.
51) Chr. Herzig, T. Wilger, T. Przeorski, F. Hisker and S. V. Divinski: Intermetallics9(2001) 431.
52) Zs. Toˆkei, J. Bernardini and D. L. Beke: Acta Mater.47(1999) 1371. 53) J. C. Ciccarriello, S. Poize and P. Gas: J. Appl. Phys.67(1990) 3315. 54) T. Barge, P. Gas and F. M. d’Heurle: J. Mater. Res.10(1995) 1134. 55) Chr. Herzig, S. V. Divinski, St. Frank and T. Przeorski: Defect
Diffusion Forum194–199(2001) 389.
56) S. V. Divinski, F. Hisker, A. Bartels and Chr. Herzig: Scr. Mater.45
(2001) 161.
57) Chr. Herzig, Y. Mishin and S. V. Divinski: Metal. Mater. Trans. A33
(2002) 765.
58) Yu. Mishin: Defect Diffusion Forum194–199(2001) 1113. 59) B. B. Straumal, S. I. Prokofjev, L.-S. Chang, N. E. Sluchanko, B.
Barezky, W. Gust and E. J. Mittemeijer, Defect Diffusion Forum194– 199(2001) 1343.
60) B. B. Straumal, P. Zieba and W. Gust: Int. J. Inorg. Mater.3(2001) 1113.
61) P. Keblinski, D. Wolf, S. R. Phillpot and H. Gleiter: Philos. Mag. A79
(1999) 2735.