Effects of Compressive Stress on Corrosion-Protective Quality
and Its Maintenance under a Corrosive Environment
for TiN Films Deposited by Reactive HCD Ion Plating
*Ken’ichi Miura
1, Itsuo Ishigami
1and Tateo Usui
21Technology Research Institute of Osaka Prefecture, Izumi 594-1157, Japan
2Department of Materials Science and Processing, Graduate School of Engineering, Osaka University, Suita 565-0871, Japan
Titanium nitride films were deposited onto SUS304 substrates under various film thickness, deposition temperatures, and substrate bias voltages. Their protective quality was evaluated by electrochemical testing in accordance with the critical passivation current density (CPCD) method. Two types of tests were employed to evaluate corrosive behavior of coated substrates: a high-temperature and high-pressure corrosion test; and a measurement of the change in anodic current density with immersion time. A scanning electron microscope was used to examine surface morphology and fractured cross-sections of the films. Residual stress in the films was determined by thesin2 method. An increase in
film thickness engendered high protective quality. That protective quality was improved with increasing deposition temperature; micrometer-order pores were observed on all parts of films deposited at lower deposition temperatures, whereas few pores existed on films deposited at higher temperatures. This result indicates that these pores are one factor influencing overall protective quality. A film deposited with no substrate bias voltage displayed morphology with a typical columnar-structure; it also demonstrated complete protective quality. As the bias voltage increased, protective quality deteriorated, whereas an excess increase in the bias voltage gave rise to a slightly higher protective quality. Films with lower compressive stress had only a few pores and possessed higher protective quality, suggesting that pore formation originates in compressive stress. Corrosion tests indicated that the coated substrates corroded more rapidly as compressive stress in the film increased. The effect of compressive stress on maintenance of corrosion-protective quality was treated quantitatively. The rate of increase in the exposed area of the substrate was estimated from variation of an anodic current density with immersion time. This evaluation indicates that a decrease in compressive stress contributes greatly to maintenance of protective quality.
(Received September 11, 2003; Accepted November 25, 2003)
Keywords: hollow cathode discharge ion plating, titanium nitride films, deposition parameter, corrosion, protective quality, defect, morphology, stress, corrosion rate
1. Introduction
Hard coatings produced by the physical vapor deposition (PVD) method have been applied to increase tool life and to improve wear resistance of machine parts. Recently, hard coatings are also used to improve corrosion resistance of many steels because PVD methods allow deposition of ceramic materials which have stable chemical properties. Nevertheless, sufficient improvement in corrosion resistance of such coated steels is rarely obtained1)because of through-film defects introduced in the through-films, which have a typical columnar-structure.2) Corrosion resistance of coated sub-strates is believed to be strongly related to the corrosion-protective quality of the films. Therefore, it is important to control process parameters to obtain high protective quality of the film. From such a perspective, relationships between protective quality and process parameters are reported frequently.3–7) Notwithstanding, very little information
ad-dresses essential factors that influence films’ protective quality,e.g.causes of through-film defect formation.
Previous works have investigated effects of process parameters on hardness,8) chemical composition [N]/[Ti],9)
impurity oxygen concentration,10) and residual stress11) for
titanium nitride films deposited by reactive hollow cathode discharge (HCD) ion plating. This paper specifically ad-dresses only the effects of film thickness, deposition temper-ature, and substrate bias voltage on the corrosion-protective
quality of titanium nitride films. Based on these results, we will discuss factors influencing the protective quality and corrosion resistance of the coated substrates, and the maintenance performance of the protective quality under a corrosive environment.
2. Experimental
2.1 Reactive HCD ion plating
This study used an ion plating system: a model SHP-400T (Showa Shinku Co., Ltd.). Figure 1 shows a schematic representation of the system. The vacuum chamber is separated into evaporation and deposition chambers by a shutter. Heaters installed to the front, back, and upper sides of the deposition chamber are used to heat the substrate to a predetermined temperature. A hollow cathode is made of tantalum; the anode is a water-cooled copper hearth with a 14.5 cm3 capacity. The system is evacuated by
turbo-mo-lecular, oil-sealed rotary pumps to provide base operating pressure as low as103Pa.
A stainless steel plate (SUS304; 49 mm 26 mm t5.5 mm) served as the substrate. The substrate composition
was analyzed and found to be: 0.05 mass% C, 0.39 mass% Si, 1.74 mass% Mn, 0.031 mass% P, 0.008 mass% S, 8.7 mass% Ni, 18.9 mass% Cr, 0.26 mass% Mo, and 0.79 mass% Cu. The substrate deposition surface was polished using diamond paste. The substrate was cleaned ultrasonically in acetone, n-hexane, and then acetone for 0.3 ks each before insertion into the ion plating system. Thereafter, Arþ sputter cleaning for 0.9 ks was performed before film deposition.
*The major part of this paper was originally published in Japanese in J. Japan Inst. Metals66(2002) 935-943 and66(2002) 944-949.
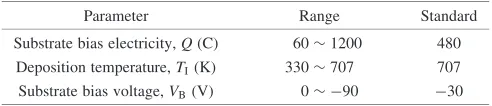
We investigated effects of three deposition parameters: substrate bias electricity, deposition temperature, and sub-strate bias voltage. Table 1 shows ranges of these parameters. Equivalent thickness of each film must be addressed to discuss corrosion-protective quality because the protective quality is largely dependent on film thickness.12) The substrate bias electricity was used to control film thickness accurately.13) Depositions were carried out by varying one
parameter; the others were fixed at the standard values shown in the right column in Table 1. In subsequent discussion, the deposition condition using only standard values is called the ‘‘standard condition’’.
2.2 Estimation of corrosion-protective quality of TiN films
Corrosion protective quality was examined by electro-chemical tests in accordance with CPCD method,14,15)which is based on the assumption that critical passivation current density icrit obtained by measuring the anodic polarization
curve for a coated substrate is proportional to the total exposed area of the substrate. We performed tests in an electrochemical cell comprising a working electrode
de-signed to expose only1102m of the test specimen to the electrolyte while maintaining a sealed electrical contact with an O-ring made of Viton, a reference saturated Ag/AgCl electrode connected to the electrolyte by a salt bridge positioned at the surface of the test specimen, and a Pt plate (10 mm 100 mm t0.5 mm) as a counter electrode
positioned on the side of the working electrode. The electrodes were separated with a glass filter. The electrolyte used was 0.5 kmolm3H
2SO4-0.05 kmolm3KSCN,
which was deoxidized by bubbling with N2 at 4:17
106m3/s for more than 3.6 ks before the test. The test
temperature was 298 K. The polarization scan range was from450toþ400mVvs.Ag/AgCl; the polarization scan rate was 0.38 mV/s.
2.3 Corrosion tests
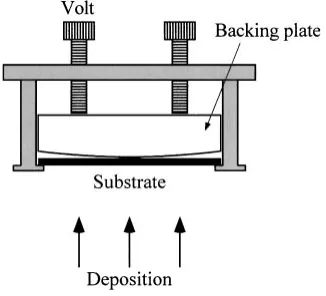
For a series of substrate bias voltage, evaluation of corrosion resistance was made using a high-temperature and high-pressure corrosion testing apparatus, model TAS-05 (Taiatsu Glass Kougyo Co., Ltd.), which is designed to estimate corrosion resistance of a plastic injection mold. Herein, this test is called the ‘‘temperature and high-pressure corrosion test’’. Figure 2 shows a schematic diagram of the apparatus and the set of specimens used. The testing vessel is made of Hastelloy BTM. The vessel is pressurized
with compressed air; thereafter, it is heated to a predeter-mined temperature by a heater outside the vessel.
Coated substrates were exposed to gas generated through hydrolyzing5102kg of mixed resin (ABS:PVC = 7:3)16) at 433 K under 2.5 MPa pressure for 10.8 ks. It is presumed
[image:2.595.48.289.68.316.2]Fig. 1 Schematic representation of an HCD ion plating system.
Table 1 Deposition parameters and their range applied to titanium nitride depositing.1
Parameter Range Standard Substrate bias electricity,Q(C) 601200 480
Deposition temperature,TI(K) 330707 707
Substrate bias voltage,VB(V) 0 90 30
Electron beam current—180 A2; Total gas pressure—2.89 Pa; Gas
mixture ratio N2/(Ar+N2)—0.9253; Distance between the substrate and
evaporation source—242 mm.
*1 Depositions were carried out by varying one parameter; the others were fixed at the values shown in the right column.
*2 Electron beam voltages applied were 20–25 V.
*3 Nitrogen partial pressure—2.67 Pa; Argon partial pressure—0.22 Pa.
[image:2.595.46.292.378.431.2] [image:2.595.310.545.459.759.2]that gas, mainly composed of hydrogen chloride, is gener-ated.17) The resultant condition was so harsh that wire
SUS316 netting in the vessel often dissolved. Corrosion products were removed after the test by boiling in an 18 mass%NaOH-3 mass%KMnO4 solution for 0.6 ks, in
boiling water for 30 s, and then in a boiling 10 mass%(NH4)2HC6H5O7solution for 0.6 ks.
Furthermore, we measured the change in anodic current density at a potential with immersion time in the same electrolyte for the CPCD method to estimate corrosion progress of coated substrates. The test temperature was 298 K. A constant potential of 200mV vs. Ag/AgCl was used.
2.4 Characterization of TiN films
Scanning electron microscopy (SEM) was used to examine film thickness as well as the films’ surface and fracture cross-sectional morphology. Phase and residual stress of the films were determined by X-ray diffraction using CuKradiation. Conditions for residual stress measurement were proposed previously.11) We confirmed that all films were of single
phase TiN.
3. Results
3.1 Effect of process parameters on corrosion-protective quality
3.1.1 Film thickness
Figure 3 shows the variation inicritwith film thicknesstF.
Critical passivation current density icrit of the SUS304
substrate decreases remarkably by being coated with TiN films. AstFincreases,icrit decreases abruptly at values up to
tF2mm, but icrit decreases gently over tF2mm. This
result indicates that an increase in thickness improves the corrosion-protective quality of the film. Kado et al.12)
reported that the logarithm of current density at a potential
in anodic polarization curve of carbon steel, SS41, and stainless steel, SUS304, coated with TiN measured in 1 kmolm3HCl decreased linearly with increasing thick-ness. This current density has been discussed as the value corresponding to corrosion-protective quality. Nevertheless, Fig. 3 shows a nonlinear relationship.
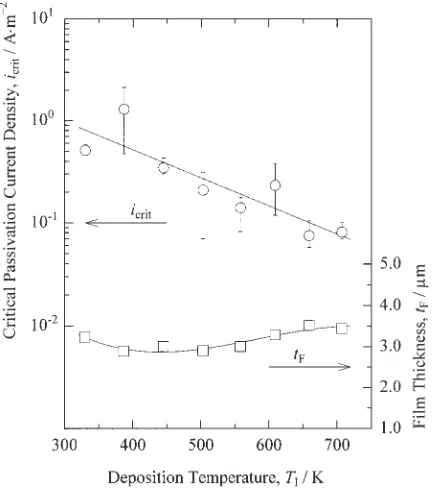
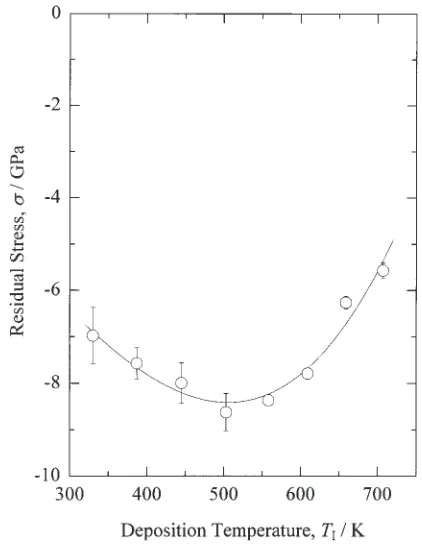
3.1.2 Deposition temperature
Figure 4 shows the variation in icrit with deposition
temperature. As the temperature increases, icrit decreases,
thereby improving the corrosion-protective quality of films. Tarutaniet al.6)have shown thati
critof SUS304 coated with
TiN decreased with increasing substrate temperature; how-ever, poor corrosion resistance was found over 773 K. This poor quality may result from sensitization of the substrate.18) No sensitization occurred for the substrate deposited at 707 K in the present study.
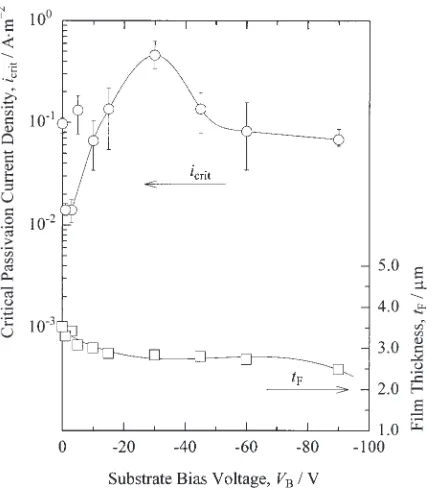
3.1.3 Substrate bias voltage
Figure 5 shows variation inicritwith substrate bias voltage
VB. As jVBj increases, icrit increases and reaches the
maximum value atVB¼ 30V; subsequently, it decreases.
Although the icrit value at VB¼0V is high, the anodic
polarization curve of this coated substrate differs entirely from the other curves, as shown in Fig. 6. Polarization curves of the substrate coated under applied bias voltages show anodic activation peaks just as that of the uncoated SUS304 substrate; on the contrary, no peak is shown in the curve of the substrate coated using no bias voltage. This curve closely approximates that of TiN film deposited onto a quartz substrate under the standard condition (see Table 1), and that of sintered TiN in 0.5 moldm3H
2SO4 measured by
Matsuda et al.19) This result confirms the complete corro-sion-protective quality of the film deposited at 0 V.
Considering the values of current densities i of the uncoated SUS304 substrate and the substrate coated under applied bias voltages at the region of passive state of
Fig. 3 Variation in critical passivation current density with film thickness.
[image:3.595.320.536.72.317.2] [image:3.595.76.264.525.770.2]SUS304, the values ofiof the 0 V-coated substrate and TiN film deposited onto a quartz substrate are considerably high. Although similar high current density is also reported in the anodic polarization curves of TiN films in 1 kmol/m3H
2SO4
measured by Yamaguchi et al.,1) details for this behavior remain unknown.
3.2 Corrosion resistance of TiN coated substrates
Figure 7 shows surface appearances of coated substrates for a series of substrate bias voltages after the high-temperature and high-pressure corrosion tests. Corrosion pores appear on films deposited at lower bias voltages. Corrosive damage increases with increasing bias voltage, whereas an excess increase in the bias voltage brings about higher corrosion resistance. Corrosion behavior of TiN coated steels in a non-oxidation acid proceeds because of removal of the film at the through-film defects by dissolution of the exposed part of the substrate, as described by Yamaguchi et al.1)We infer that substrate exposure occurs
by removal of the film through dissolution of substrate because this testing environment contains hydrogen chloride. The result in Fig. 7 is closely related to the change inicrit
with substrate bias voltage, as shown in Fig. 5. However, it seems that increasing the residual stress, namely the compressive stress, of the film changes the corrosion resistance for the worse, as can be seen from the values of
compressive stress in Fig. 7. For example, all of the film disappears for15V-coated substrate with the largest stress in this series.
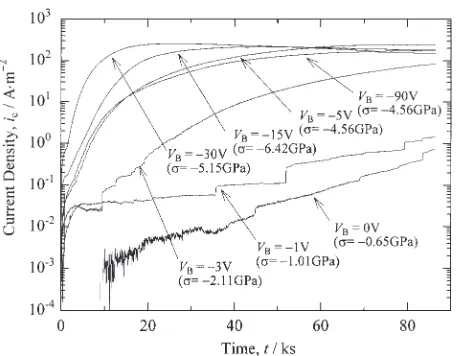
Figure 8 shows typical changes in anodic current densityic
of TiN coated substrates for a series of substrate bias voltage at 200mV vs. Ag/AgCl with immersion time. For the
30V-coated substrate,icincreased remarkably in the initial
stage of the measurement; on the contrary, the rates of increase inicfor5V,15V, and90V are slightly lower.
It is notable that current densitiesicfor low bias voltages,e.g.
1V and 0 V, vary within very low ranges. As mentioned above, an increase in current density with immersion time, shown in Fig. 8, implies an increased exposed area of the substrate. Typical surface appearances of the substrates after the measurement are shown in Fig. 9: for 0 V and 1 V-coated substrates, only a couple of corrosion pores occurred, whereas the corrosion pores were larger for3V (see Fig. 9). In contrast, large areas of the film were removed at other voltages (e.g.90V; see Fig. 9), and particularly for30V (see Fig. 9) at which all of the film was removed. These results correspond to changes in corrosion-protective quality with substrate bias voltage, as shown in Fig. 5. However, it is also considered that corrosion damage increases concomitant with compressive stress. For example, for the film deposited at 0 V and1V with low compressive stress, pores did not enlarge remarkably, showing no apparent relation to
corro-Fig. 5 Variations in critical passivation current density and film thickness with substrate bias voltage.
Fig. 6 Anodic polarization curves of TiN coated SUS304 substrates in a 298 K 0.5 kmolm3H
2SO4-0.05 kmolm3KSCN solution at 298 K.
Substrate bias voltage [V]
0
−
1
−3
−
5
−
10
−
15
−
30
−
45
−
60
−
90
Residual stress [GPa]
−0.65 −1.01 −2.11 −4.56 −6.16 −6.42 −5.15 −5.02 −4.83 −4.56
[image:4.595.63.279.70.315.2] [image:4.595.332.523.71.313.2] [image:4.595.68.528.366.440.2]sion pores that occurred in the film.
4. Discussion
4.1 Factors influencing corrosion-protective quality 4.1.1 Effect of columnar structure on
corrosion-protec-tive quality
Films deposited by the PVD methods normally have a columnar structure that does not usually exist in film bulk
materials. For example, growth morphology of TiN films changes remarkably with varied substrate bias voltage.8)The
SEM micrographs in Fig. 10 show the typical fracture cross-sectional morphology of TiN films deposited at various bias voltages. Growth morphology of the film deposited with no substrate bias voltage shows a typical columnar structure of a zone I structure according to the classification by Thornton;20) with increasing the bias voltage, the structure
changes from a columnar structure to a densely packed zone T structure comprising fibrous grains. The zone I structure is a porous structure composed of tapered crystallites separated by voids, as reported by Thornton.19) Yamamoto et al.2) indicated that defects, such as voids, located at columnar grain boundaries should be through-film defects. However, in the present work, corrosion-protective quality for the films of dense structure, such as Fig. 10(f), is poor. In marked contrast, a typical columnar structure demonstrates good protective quality (see Fig. 10(a)). These results suggest that it is difficult to infer that defects such as voids located at columnar grain boundaries have direct and strong effects upon films’ corrosion-protective quality.
4.1.2 Defects influencing corrosion-protective quality
Figure 4 shows that increasing deposition temperature improves the corrosion-protective quality of films. Surface morphologies of films deposited at various deposition temperatures are shown in Fig. 11. Many defects, namely micrometer-order pores, are formed in the film deposited at 330 K (see Fig. 11(a)). Electron probe microanalysis (EPMA) revealed that some of these defects were open pores that expose the substrate. The number of the pores decreases as
Fig. 8 Anodic current density of TiN coated SUS304 substrates at
200mVvs.Ag/AgCl (3.33 kmolm3KCl) as a function of immersion
time in a 0.5 kmolm3H
2SO4-0.05 kmolm3KSCN solution at 298 K. VBis the substrate bias voltage;represents residual stress.
Substrate bias
0
−3
−
15
−
30
−
90
voltage [V]
Fig. 9 Surface appearances of specimens after anodic polarization measurement; testing area is10mm.
(a) 0V
2µm
(b) −1V (c) −3V (d) −5V
(e) −15V (f) −30V (g) −60V (h) −90V
2µm
2µm
2µm
2µm
2µm
2µm
[image:5.595.56.284.69.247.2]2µm
[image:5.595.69.526.458.572.2] [image:5.595.70.527.611.768.2]the deposition temperature increases. This change relates closely to the result of the protective quality obtained by the CPCD method, as shown in Fig. 4. Apparently, the corrosion-protective quality strongly depends on the open pores formed in the films, rather than on defects such as voids located at columnar grain boundaries.
4.1.3 Effect of compressive stress on open pore forma-tion
Compressive stress is normally induced in the films deposited by ion plating methods.11) Such stress may form
open pores because of removal of a film from the substrate at a weakly adhered part. Figure 12 shows variation in compressive stress with substrate bias voltage VB. At low
jVBj, the stress is low: the maximum value of stress occurs at
about VB¼ 15V. Thereafter, an excess increase in jVBj
engenders lower stress. The variation shown in Fig. 12 is similar to the change inicritwith substrate bias voltage shown
in Fig. 5, except that the voltage where the maximum stress is obtained is different from the voltage which induced the maximumicrit. Variation in compressive stress with
deposi-tion temperature is shown in Fig. 13. As the deposideposi-tion temperature increases, compressive stress increases at lower temperatures, but decreases at higher temperatures. This behavior differs from the result shown in Fig. 4. However, it is considered that relaxation of stress occurs because of formation of many open pores by worsened adhesion of films in the range of lower substrate temperature.11,21)Figure 14
shows the relationship between critical passivation current density icrit and compressive stress for two series of
deposition temperatures TI and substrate bias voltages VB.
Except for the 0 V-coated substrate, critical passivation current densityicritbecomes higher with higher compressive
stress: in other words, films of higher compressive stress have many open pores, which cause lower protective quality. This
(a) 330K
(e) 558K
(b) 387K (c) 445K (d) 503K
(f) 609K (g) 659K (h) 707K
30µm 30µm 30µm
30µm 30µm
30µm 30µm
[image:6.595.72.525.72.229.2]30µm
Fig. 11 Typical SEM micrographs showing surface appearances of TiN films deposited at various deposition temperatures.
[image:6.595.320.531.270.545.2] [image:6.595.66.280.278.543.2]result suggests that pore formation originates from compres-sive stress.
4.2 Effect of compressive stress on maintenance of corrosion-protective quality under a corrosive envi-ronment
As mentioned above, it was considered that compressive stress in the films influenced not only corrosion protective quality, but also corrosion resistance of coated substrates. This section presents quantitative examination of the rela-tionship between compressive stress and maintenance of the corrosion-protective quality.
4.2.1 Estimation of corrosion rate for substrates with controlled film-stress
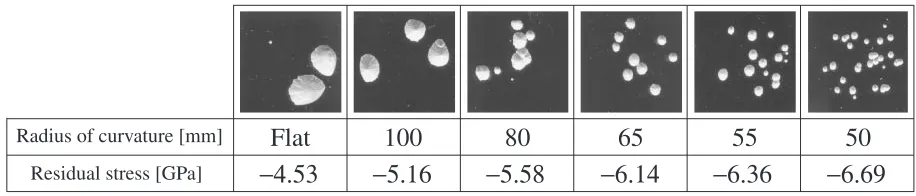
An attempt has been made to clarify the relationship between compressive stress and corrosion rate using sub-strates with controlled film-stress. Films were deposited simultaneously onto six sheets of substrate that were deformed using backing plates with six various radii of curvature. Figure 15 shows a schematic diagram of the setup used to deposit films onto these deformed substrates. The substrate material was stainless steel, (SUS304; 15 mm
24 mm t0.7 mm). Deposition was done at substrate bias
voltage of90V under total gas pressure of 4.40 Pa (other chosen parameters are standard values; see Table 1); this condition was selected to reduce compressive stress gener-ated in the films.11)By returning the substrates to a flat state after deposition, the films must possess similar properties aside from compressive stress. Figure 16 shows the variation in compressive stress of the films along with respective radii of curvature. Compressive stress increases with decreasing radius of curvature.
Changes in anodic current densityicof these substrates at
200mV vs. Ag/AgCl in a 0.5 kmolm3H2SO4
-0.05 kmolm3KSCN solution as a function of immersion time are shown in Fig. 17. Measurements were made up to ic¼100A/m2to prevent removal of the entire film from the
substrate. An increase in compressive stress engenders a remarkable increase inicand hence in the exposed area of the
substrate. Figure 18 shows surface appearances of these substrates after measurement. The number of corrosion pores increases with increasing compressive stress; it is necessary for discussion of corrosion rate to take into account not only change in anodic current density icbut also the number of
corrosion pores.
4.2.2 Quantitative treatment for the maintenance of corrosion-protective quality
[image:7.595.67.273.65.334.2]This section presents quantitative treatment of the ex-pansion rate of corrosion pores based on results in Figs. 17 and 18.
Fig. 14 Relationship between residual stress and critical passivation current density. : on the basis of Figs. 4 and 13, which share the common variableTI; : on the basis of Figs. 5 and 12, which share the
[image:7.595.346.509.73.221.2]common variableVB.
Fig. 15 Schematic diagram of the setup used to deposit film onto a deformed SUS304 substrate.
[image:7.595.315.535.272.521.2]As shown in Fig. 18, corrosion pores are almost circular. We presume that the shape of initial through-film defects is circular. Let a radius of the number ipore be ri0; then the
initial total area S0 of the exposed part of substrate is
represented as
S0¼
Xn
i
r2i0; ð1Þ
wherenis the number of corrosion pores. The total exposed area of the substrate at time t must be determined by considering the shape of corrosion pores. Figure 19 shows a cross-sectional view of a corrosion pore measured with a surface roughness tester. The corrosion pore shape can be regarded as conical. Therefore, using radiusritand depthhit
of the numberipore at timet, the exposed areaStof substrate
is given as
St¼ Xn
i
[image:8.595.56.287.68.246.2]ritðr2itþhit2Þ0:5: ð2Þ
Figure 20 shows the relationship between average size and depth of corrosion pores measured with a laser microscope, which can be approximated by direct proportionality,i.e. a straight line like that drawn in Fig. 20. Substitution ofhit¼
ritinto eq. (2) gives
St¼ð1þ2Þ0:5 Xn
i
rit2; ð3Þ
whereis constant. The current densityicis proportional to
St; hence
ic¼Cð1þ2Þ0:5
Xn
i
rit2; ð4Þ
Radius of curvature [mm]
Flat
100
80
65
50
Residual stress [GPa]
−4.53
−5.16
−5.58
−6.14
−6.36
−6.69
[image:8.595.327.523.72.218.2]55
Fig. 18 Surface appearances of specimens after anodic polarization measurement; testing area is10mm. Fig. 17 Anodic current density of TiN coated SUS304 substrates at
200mVvs.Ag/AgCl (3.33 kmolm3KCl) as a function of immersion
time in a 0.5 kmolm3H
2SO4-0.05 kmolm3KSCN solution at 298 K.
Fig. 19 Cross-sectional view of a corrosion pore.
[image:8.595.67.525.306.404.2] [image:8.595.321.526.438.694.2]where C is constant. Furthermore, changes in ic can be
approximated by a function oft2 inferred from data plotted
on a semilogarithmic graph, as shown in Fig. 17. Therefore, the radius of a corrosion pore is considered to be a function of t. If the rate of increase of the radius is constant for all corrosion pores, then radiusritof the numberipore at timet
is represented by
rit¼Vtþri0; ð5Þ
whereV is the rate of increase of the radius. Substitution of eqs. (5) and (1) into eq. (4) yields
ic¼B nV2t2þ2Vt
Xn
i
ri0þS0
!
; ð6Þ
whereBis constant. Therefore, the amount in proportion to the expansion rateV of corrosion pore can be calculated by the number n of initial defects and coefficient t2 obtained from the regression equation of the measuredic-t curve as
follows:
In eq. (6), we assumed that the expansion rate for every corrosion pore was constant. Now we consider the expansion rate of a corrosion pore having the same exposed area. The coefficient of t2,BnV2, was obtained from the regression
equation of the of ic-t curve; also, A¼ ðBnV2Þ=n was
calculated. Thenv¼pffiffiffiAis proportional toV, or
V /v¼pffiffiffiA: ð7Þ
Data up toic of 10 A/m2 equivalent for 10% of the current
density at the end of the measurement (see Fig. 17) were used to exclude the effect of combined pores. Therefore, the number n of initial defects was determined by counting corrosion pores which have a radius with more than ð1
1=pffiffiffiffiffi10Þrmax with an optical microscope (rmax represents the
radius of the largest pore in a substrate). Data of the region included in data of all the substrates, from 2102 to
4101A/m2 ini
c=n, were used for the regression.
Figure 21 shows the relationship between compressive stress andvcalculated in the manner mentioned above. The expansion rate of corrosion pores increases with increasing compressive stress. Increased compressive stress encourages the progress of corrosion in coated substrates.
4.3 Validity on estimation of corrosion-protective qual-ity by the CPCD method
Haruna et al.22) pointed out that the CPCD method
overestimates the area of the exposed substrate by through-films defects because potential sweep in the region of anodic activation may expand the through-film defects. This section presents discussion of the validity of estimation of protective quality by the CPCD method.
Sirato et al.23) reported that protective quality is
over-estimated. Removal of the film from the substrate at the through-film defects affects measurement by the CPCD method when adhesion of the film is bad. However, no part of removal of film or enlargement of open pores was observed in film deposited at the lowest deposition temperature of 303 K; the film would thereby possess poorest adhesion among films deposited in the present study.21) On the
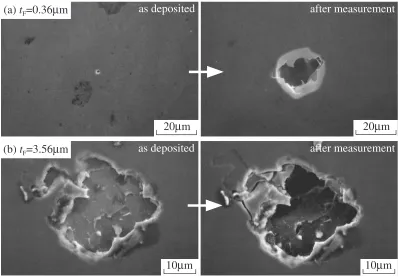
contrary, enlargement of open pores occurred in thin films.
Figure 22 shows SEM micrographs that display the appear-ance of open pores before and after measurement by the CPCD method. Defects in the film with thickness of 0.36mm expand because of dissolution of the substrate upon measure-ment, as shown in Fig. 22(a). This result indicates that the protective quality evaluated by the CPCD method is under-estimated for the thickness of 0.36mm. Both expanded and non-expanded defects were observed for the film with 0.84mm thickness. In contrast, non-expansion, that is, no change is shown in the appearance of defects in the film with thickness of 3.56mm after measurement, even though the exposed substrate dissolves (see Fig. 22(b)). It can be concluded that corrosion-protective quality for films with thickness of 0.36mm and 0.84mm is underestimated in comparison to actual protective quality, whereas that for thicker films than those above, i.e. all films with standard thickness in this work, is good enough.
5. Conclusions
Corrosion-protective quality of TiN films is improved by increased film thickness and deposition temperature. At low bias voltages, the protective quality is good; increasing the bias voltage worsens the protective quality, whereas an excess increase in the bias voltage engenders slightly improved protective quality.
A film deposited with no substrate bias voltage typically has a columnar structure and a completely protective quality, but it has been reported that a film with a typical columnar-structure has more through-film defects than that with a dense-looking structure. This study confirmed that the protective quality depends greatly on micrometer-order open pores formed in the film rather than micro defects, such as voids, located at columnar grain boundaries. We inferred that pore formation originated in compressive stress.
[image:9.595.311.541.70.250.2]Corrosion tests indicated that corrosive damage progressed more rapidly as the compressive stress increased. The rate of increase in the substrate area exposed to electrolytes through the pores can be estimated quantitatively from a change in current density at a potential with immersion time. This study revealed that a decrease in compressive stress contributes
Fig. 21 Relationship between residual stress andvdefined as eq. (7);n
greatly to maintenance of protective quality.
REFERENCES
1) S. Yamaguchi, N. Hara and K. Sugimoto: J. Japan Inst. Metals56
(1992) 294–302.
2) K. Yamamoto, T. Nakayama, H. Tomari and H. Saito: Surface Tailoring for Steel by Dry Film, (The Iron and Steel Institute of Japan, 1995) 123–130.
3) R. T. Carson, J. H. Givens, H. S. Savage, Y. W. Lee, J. M. Rigsbee and W. J. Croisant: Thin Solid Films204(1991) 285–296.
4) J. P. Celis, D. Drees, E. Maesen and J. R. Roos: Thin Solid Films224
(1993) 58–62.
5) S. Kurosawa, Y, Miyoshi and I. Inoue:Surface Tailoring for Steel by Dry Coating, (The Iron and Steel Institute of Japan, 1995) 85–93. 6) K. Tarutani and K. Hattori:Surface Tailoring for Steel by Dry Coating,
(The Iron and Steel Institute of Japan, 1995) 94–99.
7) H. Uchida, M. Yamashita and K. Tokuda: J. Soc. Mat. Sci., Japan51
(2002) 107–111.
8) K. Miura, I. Ishigami, M. Kuno and H. Kaneda: J. Japan Inst. Metals59
(1995) 303–311.
9) K. Miura, I. Ishigami and T. Mizukoshi: J. Japan Inst. Metals63(1999) 949–958.
10) K. Miura, I. Ishigami and T. Mizukoshi: J. Japan Inst. Metals64(2000)
508–517.
11) K. Miura and I. Ishigami: J. Japan Inst. Metals65(2001) 972–980. 12) T. Kado, R. Makabe, S. Mochizuki, S. Nakajima and M. Araki:
Bosyoku Gijutsu36(1987) 551–558.
13) I. Ishigami, K. Miura, H. Hoshino, T. Mizukoshi, F. Uratani and S. Ogawa: J. Vac. Soc. Jpn.43(2000) 524–534.
14) K. Sugimoto:95th Husyoku-Bousyoku Symposium, (Japan Society of Corrosion Engineering, 1993) 1–11.
15) H. Kondo, N. Akao, N. Hara and K. Sugimoto: J. Electrochem. Sci.150
(2003) B60–B67.
16) ABS: Acrylonitrile-Butadiene-Styrene copolymer, PVC: Poly Vinyl Chloride.
17) H. Nisizawa:Polymer no Nannenka, (Taiseisya, 1987) p. 195. 18) K. Morita, Y. Morita and M. Saito:Surface Tailoring for Steel by Dry
Film, The Iron and Steel Institute of Japan, (1995) 131–134. 19) Y. Matsuda, M. Inoue, M. Morita, Y. Takasu, H. Mizuno and H. Miura:
DENKI KAGAKU50(1982) 258–262.
20) J. A. Thornton: J. Vac. Sci. Technol.12(1975) 830–835.
21) I. Isigami, K. Miura and E. Tsunasawa: J. Jpn. Inst. Soci. Heat Treat33
(1993) 35–43.
22) T. Haruna and T. Shibata:Surface Tailoring for Steel by Dry Film, The Iron and Steel Institute of Japan, (1995) 56–62.
23) T. Shirato and Y. Kimura: J. Soc. Mat. Sci., Japan49(2000) 227–233.
as deposited
after measurement
as deposited
after measurement
(a)
t
F=0.36
µ
m
(b)
t
F=3.56
µ
m
20
µ
m
20
µ
m
[image:10.595.98.496.72.349.2]10
µ
m
10
µ
m