Wheat flour is able to form a cohesive dough with viscoelastic properties and has the ability to retain gas, which is essential for the production of baked products with a light texture. The factor responsi-ble for the dough formation is gluten protein and its development during mixing (HRUŠKOVÁ et al. 2001). During fermentation, a steady gas formation of sufficient amount is needed for the product to obtain desired the loaf volume. Fermentation is a metabolic process serving for some microorgan-isms to get energy through digestion of simple fermentable sugars, mostly glucose and fructose, forming gas. The amount of CO2 depends on yeast and flour properties under standard conditions of the dough preparation which have a strong effect on the final product quality (BLOKSMA 1993).
Important for the technological quality of wheat flour is its strength given by the gluten quality and content, and so are also starch-amylase-complex properties (enzymatic activity, starch particles damage). These properties are observed by means of different methods (POMERANZ 1988).
Rheological characteristics, such as elasticity, viscosity and extensibility, are important for the milling and baking industry in view of the predic-tion of the processing parameters of dough and the quality of end products. These rheological characteristics change throughout the breadmaking process and are difficult to measure in definitive terms (HRUŠKOVÁ et al. 2001).
To assess the fermented dough properties (gas volume, retention capacity) and its behaviour during
Characteristics of Fermented Dough Predicted by Using
the NIR Technique
ONDŘEJ JIRSA and MARIE HRUŠKOVÁ
Department of Carbohydrate Chemistry and Technology, Faculty of Food
and Biochemical Technology, Institute of Chemical Technology Prague, Prague,
Czech Republic
Abstract
JIRSA O., HRUŠKOVÁ M. (2005): Characteristics of fermented dough predicted by using the NIR tech-nique. Czech J. Food Sci., 23: 184–189.
Rheological characteristics of wheat doughs prepared from 179 variety and commercial wheat flour samples (crop years 1999, 2001, 2002, 2003 and 2004) were assessed with SJA fermentograph (Sweden). NIR spectra of the samples were measured on the spectrometer NIRSystem 6500. Calibration equations with cross and independent validations for all rheological characteristics were computed by NIR Software ISI Present WINISI II using mPLS/PLS regression and ANN. The quality of prediction was evaluated by means of coefficients of correlation between the measured and the predicted values from cross and independent validation. A statistically significant dependence (with probability higher than 99%) was determined in all mentioned rheological characteristics in the case of cross-validation. The results suggested the possibility of prediction particularly for the fermentation gas volume parameter, where a high correlation was achieved (r = 0.888). The accuracy of prediction by independent validation was not found on such a satisfactory level. For the sets of ten commercial flours, higher correlation coefficient was calculated for the final dough volume parameter.
maturation, several rheological apparatuses were developed. A common one is SJA fermentograph (Sweden) or advanced type rheofermentometer (Chopin, France). CZUCHAJOWSKA and POME- RANZ (1993) developed a methodology to assess fermentation with the use of rheofermentometer and a shortened baking test on the bread-making machine. The formula of dough also influences the properties of leavened dough. Full-bread-formula is usually used for the dough fermentograph test-ing (ŠVEC & HRUŠKOVÁ 2004).
Because the baking test and rheological meas-urements require a lot of time and equipment to be performed, a fast and reliable test is necessary. This problem can be solved by the NIR spectros-copy (WILLIAMS & NORRIS 2001), which is almost well-established to control analytical properties of flour in many industrial mills. The prediction of dough properties by NIR spectra analysis is influenced by many factors, especially errors of rheological methods and the dependence of the results on the protein content of the flours tested. The reliability of the computed characteristics of dough varies according to the calibration sample set, the extent and quality range of flour param-eters (HRUŠKOVÁ & ŠMEJDA 2003).
The main goal of this study was to predict dough the rheological properties measured on the fer-mentograph from NIR flour spectra.
MATERIAL AND METHODS
Samples. Three subsets of commercial and five subsets of variety bakery (fine, bright) flours were used jointly as a calibration set. Commercial flours (53 samples) were mostly obtained from industrial mills (crop years 2001 and 2003). However, twenty of them represented laboratory ground commercial wheat flours (Chopin CD1-auto). Variety flours (126 samples) were supplied by Central Institute for Supervising and Testing in Agriculture in Brno (crop year 1999), SELGEN Stupice (crop years 2002, 2003 and 2004) and Research Institute of Crop Production in Prague-Ruzyně (crop years 2003 and 2004) and all these flours were ground on laboratory mill Chopin CD1-auto (all but samples from Brno) and Bühler MLU 202 (samples only from Brno). Ten samples of flours from retail (crop year 2003) were used as a validation set.
References analysis. The basic flour quality parameters (the ash, moisture, wet gluten, and pro-tein content) were determined using spectrometer
Inframatic 8600. Czech standard methods were used for the determination of falling number (ČSN ISO 3093; Falling Number, Perten Instruments, Sweden) and Zeleny sedimentation value (ČSN ISO 5520; Sedi-Test, ZZN Strakonice).
Rheological properties of fermented wheat dough were evaluated by SJA fermentograph (Sweden). As the fermentograph test procedure is not included in any international or Czech standard method, this test was performed according to our internal method. The dough for the fermentograph test was prepared in farinograph (Brabender, Germany) under standard conditions (mixer tempered at 30°C) using the baker test formula (flour 100%, compressed yeast 4.0%, sugar 1.5%, fat 1.0%, salt 0.7%) and the water amount to reach optimal con-sistency of 600 ± 20 FU (farinograph units). Two pieces of dough (both of 150 g) were then put into two fermentation cylinders, where fermentation proceeded for 160 min at 30°C. Three parameters are extracted from two plots: fermentation gas volume VG [FeU – fermentograph units], final dough volume VD [FeU] (the volume at the end of test) and fermentation time T [min] (the time of maximum dough volume).
NIR apparatus.NIR spectra were collected on the wavelenght scanning instrument NIRSystem 6500 (Foss NIRSystems, Inc., USA) using a small ring cup. Scanning range from 400 to 2500 nm and wavelenght increments of 2 nm were used. Diffuse reflectance was recorded as log(1/R). Each sample was measured once (five scans) and was used for calibration.
their highest coefficient of correlation (r) or mini-mum standard error of cross-validation (SECV) or standard error of validation (SEV; for ANN). These equations were consequently validated by the set of flours from retail.
RESULTS AND DISCUSSION Analytical characteristics
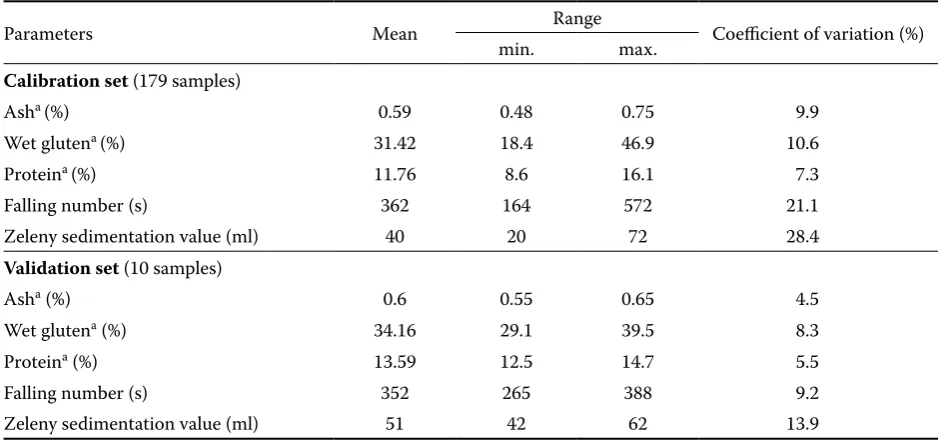
Analytical characteristics describing flour quality of the sets tested (crop years 1999, 2001–2004) are given in Table 1. The quality of wheat flours cor-responded to Czech standard for the mill products of fine type. The analytical ranges were from 8.6 to 16.1% for protein, from 20 to 72 ml for Zeleny
sedimentation value, and from 164 to 572 s for fall-ing number. The commercial and the variety flour subsets (data not shown) are comparable accord-ing to the mean analytical values. However, wider range of qualitative characteristics was observed in the variety subset (e.g. 5.7% contra 2.2% for protein). A feature of most flours is a high falling number indicating a low activity of amylases. The samples used for the validation belong to flours with a higher protein content representing average wheat quality of this crop year (2003).
Rheological characteristics
The results with doughs as obtained on fermen-tograph are summarised in Table 2. The
param-Table 1. Flour analytical parameters
Parameters Mean Range Coefficient of variation (%)
min. max.
Calibration set (179 samples)
Asha (%) 0.59 0.48 0.75 9.9
Wet glutena (%) 31.42 18.4 46.9 10.6
Proteina (%) 11.76 8.6 16.1 7.3
Falling number (s) 362 164 572 21.1
Zeleny sedimentation value (ml) 40 20 72 28.4
Validation set (10 samples)
Asha (%) 0.6 0.55 0.65 4.5
Wet glutena (%) 34.16 29.1 39.5 8.3
Proteina (%) 13.59 12.5 14.7 5.5
Falling number (s) 352 265 388 9.2
Zeleny sedimentation value (ml) 51 42 62 13.9
[image:3.595.62.538.326.546.2]adry matter basis
Table 2. Flour fermentograph parameters
Parameters Mean Range Coefficient of variation (%)
min. max.
Calibration set (179 samples)
Final dough volume (FeU) 68 29 95 21.8
Optimal fermentation time (min) 64 25 126 33.8
Fermentation gas volume (FeU) 108 54 147 22.6
Validation set (10 samples)
Final dough volume (FeU) 79 60 89 9.7
Optimal fermentation time (min) 54 48 59 5.7
[image:3.595.62.537.598.756.2]eter values ranges from 29 to 95 FeU for the final dough volume, from 25 to 126 min for the optimal fermentation time and from 54 to 147 FeU for the fermentation gas volume. The optimal fermenta-tion time parameter is characterised by the highest variation (33.8%). The greater uniformity of com-mercial flours in the case of fermentograph proper-ties (data not shown) was revealed only by a lower variance of the final dough volume (11.2% beside 26.9%). Higher and considerably more uniform values of the fermentation gas volume parameter were observed in the case of the variety flours subset (mean 122 FeU beside 93 FeU). The flours used for the validation had rather higher values of the final dough volume and the fermentation gas volume and shorter fermentation times. In the bakery process, this means a lower resistance to the mechanical stress and good gas evolution and retention.
Prediction according cross-validation
The prediction of rheological properties in the calibration flours set is show in Table 3. Statisti-cally significant dependence between the predicted and the reference values with probability higher than 99% was found for all three parameters in using both methods. However, in view of high coefficient of variation (> 10%), the mPLS/PLS calibrations obtained cannot be thought reliable (variation coefficient for ANN was not computed). The highest statistical correlation (r = 0.888) in all samples set was achieved for the fermentation
gas volume parameter, and can be considered as medium strong. Weaker statistical dependencies were found for the final dough volume and the optimal fermentation time (statistical level 99%). In the case of ANN, the results were similar, but moderate correlations for all parameters were achieved. This may be due to some numbers selec-tion from the calibraselec-tion/validaselec-tion samples. The validation subset seems not to be representative for the optimal fermentation time, since SEV at-tained is lower than SEC.
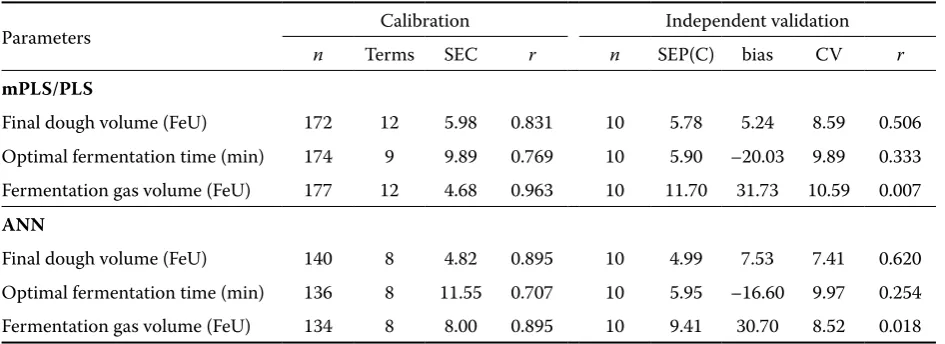
Prediction according independent validation
[image:4.595.63.538.101.274.2]The correlation coefficient (r) and the standard error of prediction (SEP) for rheological parameters are shown in Table 4. Using calibration equations for the prediction of the measured properties of independent samples, quality of which will be within the range of the calibration set, a satis-factory accuracy resulting from SEP (SECV) of the appropriate characteristic can be suggested (PEKÁRKOVÁ et al. 2000). The best calibration equations (selected according to SECV/SEV) were verified by independent validation, for which the independent set of ten flours from retail was used. For all three parameter observed, lower coefficients of correlation and high biases were found. With bias corrected, the volume change of the dough sample was predicted the most precisely (bias-corrected standard error of prediction SEP(C) = 5.78 FeU). A less reliable prediction was found Table 3. Prediction of flour fermentograph characteristics
Parameters Calibration Cross-validation
n Terms SEC CV r n SEP CV r
mPLS/PLS
Final dough volume (FeU) 172 12 5.98 8.89 0.831 172 8.17 12.14 0.687 Optimal fermentation time (min) 174 9 9.89 16.57 0.769 174 11.75 19.70 0.676 Fermentation gas volume (FeU) 177 12 4.68 4.23 0.963 177 8.19 7.41 0.888 ANN
Final dough volume (FeU) 140 8 4.82 . 0.895 35 6.08 . 0.818
Optimal fermentation time (min) 136 8 11.55 . 0.707 40 9.80 . 0.815 Fermentation gas volume (FeU) 134 8 8.00 . 0.895 42 8.51 . 0.872
for the fermentation gas volume parameter; the optimal fermentation time was predicted with a higher error. ANN in comparison with mPLS/PLS regression provided comparable results for all three parameters and only minor differences could be observed. The prediction of wheat dough behav-iour with commercial flour samples was calculated usually with a lower accuracy than assessed in our previous work (HRUŠKOVÁ et al. 2004).
CONCLUSIONS
NIR technique was used to predict the dough baking quality of both commercial and variety flours. A statistically significant dependence be-tween the predicted and the reference values with probability higher than 99% was found during calibration for all three parameters with both mPLS/PLS and ANN methods. The fermentation gas volume parameter was revealed as the best pre-dicted parameter in the calibration set, suggesting the possibility of NIR evaluation. Since the extent of the calibration parts differs for mPLS/PLS and ANN, one must be careful when comparing the parameters of the calibration equations. Using ANN, standard errors attained were slightly lower or equal. However, in predicting properties of ten flours from retail, the accuracy was not achieved on such a satisfactory level. Probably because the validation set was represented by specific flour type (well-balanced end-user flours from different mills) with characteristics not included
in calibration set. Thus, the prediction of the gas production seems to be rather more prospective then the prediction of other parameters of fer-mented dough. The calibration and the validation sets of samples, come from five year crops, seem to be satisfactory for the estimate of rheological parameters of fermented dough using flour from laboratory milling process. Higher number of samples must be tested in the case of rheological behavior prediction of commercial flour. Similar results of mathematical prediction of farinograph, extensigraph, and alveograph characteristics by independent validation were documented in our previous work (HRUŠKOVÁ et al. 2004).
References
BLOKSMA A.H. (1993): Dough structure, dough rhe-ology, and baking quality. Cereal Foods World, 35: 238–244.
CZUCHAJOWSKA Z., POMERANZ Y. (1993): Gas forma-tion and gas retenforma-tion I. The system and methodology. Cereal Foods World, 38: 499–503.
HRUŠKOVÁ M., ŠMEJDA P. (2003): Wheat flour dough alveograph characteristics predicted by NIRSystems 6500. Czech Journal of Food Sciences, 21: 28–33. HRUŠKOVÁ M., BEDNÁŘOVÁ M., NOVOTNÝ F. (2001):
Wheat flour dough rheological characteristics predicted by NIRSystems 6500. Czech Journal of Food Sciences, 19: 213–218.
[image:5.595.63.536.101.273.2]HRUŠKOVÁ M., BEDNÁŘOVÁ M., ŠMEJDA P. (2004): Předpověď reologických parametrů pšeničného těsta Table 4. Independent validation of calibration equations
Parameters Calibration Independent validation
n Terms SEC r n SEP(C) bias CV r
mPLS/PLS
Final dough volume (FeU) 172 12 5.98 0.831 10 5.78 5.24 8.59 0.506 Optimal fermentation time (min) 174 9 9.89 0.769 10 5.90 –20.03 9.89 0.333 Fermentation gas volume (FeU) 177 12 4.68 0.963 10 11.70 31.73 10.59 0.007 ANN
Final dough volume (FeU) 140 8 4.82 0.895 10 4.99 7.53 7.41 0.620 Optimal fermentation time (min) 136 8 11.55 0.707 10 5.95 –16.60 9.97 0.254 Fermentation gas volume (FeU) 134 8 8.00 0.895 10 9.41 30.70 8.52 0.018
Corresponding author:
Ing. ONDŘEJ JIRSA, Vysoká škola chemicko-technologická v Praze, Fakulta potravinářské a biochemické technologie, Ústav chemie a technologie sacharidů, Technická 5, 166 28 Praha 6, Česká republika
tel.: + 420 224 353 120, fax: + 420 233 199 990, e-mail: [email protected] analýzou NIR spekter pšeničné mouky. Chemické listy,
98: 423–431.
PEKÁRKOVÁ J., HRUŠKOVÁ M., NOVOTNÝ F., JUREČKA D., MORÁVKOVÁ E. (2000): Použití analyzátoru NIRS 6500 pro sledování vybraných jakostních ukazatelů pšeničné mouky. Czech Journal of Food Sciences, 18: 235–238.
POMERANZ Y. (1988): Wheat II. American Association of Cereal Chemists, St. Paul, Minnesota.
ŠVEC I., HRUŠKOVÁ M. (2004): Wheat flour fermentation study. Czech Journal of Food Sciences, 22: 17–23. WILLIAMS P.C., NORRIS K.H. (2001): Near-Infrared
Tech-nology in the Agricultural and Food Industries. 2nd ed. American Association of Cereal Chemists, St. Paul, Minnesota.