Solubilization and release of mineral elements from feedstuffs are important processes for their utilisation by animals (Khorasani and Armstrong, 1990). According to Playne et al. (1978), the ele-ments not released from feedstuffs in nylon bags after 48 h incubation in the rumen are probably unavailable for absorption to the animal. The lo-cation of mineral elements in the forage structure may influence their release (Van Eys and Reid, 1987; Emanuele and Staples, 1990; Gralak et al., 1997; Islam et al., 2001). High proportions (> 60%) of K and Mg were released during short incubation in the rumen. Ca had the lowest disappearance. Flachowsky et al. (1994) reported that Ca release was dependent on the type of feedstuff and incu-bation time. Disappearance of elements from the bags in the rumen depends on mineral content and fibre content of incubated feeds (Flachowsky and Grün, 1992).
The objective of the present study was to com-pare the release of selected macrominerals from different types of forages in times of their incuba-tion in the rumen by an in sacco method.
MATERIAL AND METHODS
In sacco method
To study the release of mineral macroelements we used the following forages: lucerne hay from the 1st cut (LH1) and 2nd cut (LH2), two hybrids of orchard grass (Rela hybrid GR and Niva hybrid GN), red clo-ver silage treated with the chemical Kofasil (CSKO) and biological conserving agent Feedtech (CSFT) and grass silage (GS). A meadow sward composed of 80% grass (with a dominant portion of Dactylis glomerata, and Festuca pratensis, Poa pratensis, etc.), 15% herbs (Taraxacum officinale) and 5% clover (Trifolium re-pens) was used for ensiling.
An in sacco method was used to study the release of mineral elements from forages. Incubation of forages was done in the rumen of 3 young bulls (average live weight 350 kg) with large rumen can-nulas (inner diameter 10 cm). The animals were fed a ration consisting of lucerne hay, maize silage, cereal meal and mineral and vitamin feed additive. Access to water was ad libitum.
In sacco macromineral release from selected forages
Z. Čerešňáková, P. Fľak, M. Poláčiková, M. Chrenková
Department of Animal Nutrition, Slovak Agricultural Research Centre, Research Institute of Animal Production, Nitra, Slovak Republic
ABSTRACT: An in sacco technique was used to measure the release of Mg, Ca, Na, K from six forages – lucerne hay from the 1st and 2nd cut (LH1 and LH2), orchard grass hybrid Rela (GR) and hybrid Niva (GN), grass silage (GS),
red clover silage treated with Feedtech (CSFT) and/or with Kofasil (CSKO). The forages differed in the content of macrominerals (Ca 15.82 – 3.66 g/kg DM; Mg 3.68 – 1.46 g/kg DM; Na 0.20 – 3.02 g/kg DM; K 21.57 – 34.79 g/kg DM), and large differences (P < 0.01) were also in the element release in the rumen between experimental forages. The lowest DM effective degradability was determined for grass forages (49.5%–51.5%) and forages from legumes had higher degradability (62.9%–67.1%). The extent of disappearance of macroelements was also higher from LH1, CSFT, CSKO than from G and GS. The release of individual elements in all incubation times is expressed very well by cubic polynomials. Maximum disappeared portions of individual minerals from forages are as follows: Ca 86.3% and Mg 93.2% from CSFT, Na 98.7% from GN and K > 98% from all feeds. Potassium solubility is rapid and is not affected by the incubation time.
The lyophilized forages (GR, GN, GS, CSKO, CSFT) and LH1, LH2 were ground to pass a 3-mm sieve and weighed (approx. 2.5 g dry matter) into bags made of Uhelon 130T (HEDVA, Moravská Třebová, Czech Republic) with the pore size 47 mm. We used three bags for each forage, incubation and animal. The bags with forages were incubated for 0, 6, 9, 16, 24, 48 and 72 hours. The 0-h variant was only washed without ruminal incubation. The same incubation times were used for the study of DM degradation. We followed the descrip-tion of in sacco method by Harazim and Pavelek (1999).
Chemical analysis
Dry matter and crude protein content of forages was determined in accordance with the standard STN 46 9072, and cell wall content according to the procedure of Van Soest (Lutonská and Pichl, 1983). For the mineral analysis (STN 46 9072) samples of forages and residues were ashed at 550°C and the ash was dissolved in 10 ml of HCl (1:3). Na, K, Ca and Mg were determined with an AAS Solar 9 000 (Unicam, Cambridge, UK).
Mathematical and statistical processing
The data on mineral elements from experimental observations are expressed in g/kg DM for statisti-cal evaluation. It is a difference from our previous paper (Čerešňáková et al., 2005) where they were given in % of disappearance against the original content).
The data on the observed losses of mineral ele-ments were evaluated as follows:
– by the calculation of basic variation statistical characteristics of observations of the studied traits
– by the two-way analysis of variance with Tukey’s test of nonadditivity of group (forage) × time of incubation
As all Tukey’s tests of nonadditivity were signifi-cant or highly signifisignifi-cant, the regressions of the macroelement release over time were analysed for each feed separately.
The statistical methods were realised according to Grofik and Fľak (1990) and SPSS for Windows, Release G, Copyright SPSS, Inc. 1989–1993 (li-censed for RIPP, Piešťany).
RESULTS AND DISCUSSION
Solubilization and release of mineral elements from the structure of forage are very important preconditions of their utilization by animals. There are large differences between forages in the cell wall content and their individual fractions (cellulose, hemicellulose and lignin) that affect the degradabil-ity of NDF, DM (Gralak et al., 1996; Čerešňáková et al., 2000) and release of mineral elements (Ledoux and Martz, 1991; Flachowsky and Grun, 1992). In our previous study we found that the partial re-gression coefficients of mineral element release on NDF and time were positively highly significant 0.7247** in Mg and 1.9083** in Ca. (Čerešňáková et al., 2005).
Our results document different contents of NDF, crude fibre and crude protein in grasses and
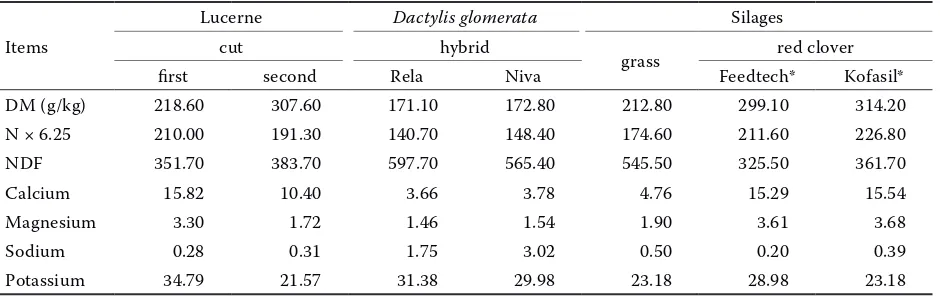
legu-Table 1. Chemical composition of experimental forages (g/kg DM)
Items
Lucerne Dactylis glomerata Silages
cut hybrid
grass red clover first second Rela Niva Feedtech* Kofasil* DM (g/kg) 218.60 307.60 171.10 172.80 212.80 299.10 314.20 N × 6.25 210.00 191.30 140.70 148.40 174.60 211.60 226.80 NDF 351.70 383.70 597.70 565.40 545.50 325.50 361.70
Calcium 15.82 10.40 3.66 3.78 4.76 15.29 15.54
Magnesium 3.30 1.72 1.46 1.54 1.90 3.61 3.68
Sodium 0.28 0.31 1.75 3.02 0.50 0.20 0.39
[image:2.595.65.535.592.741.2]mes (Table 1). The plant species showed differences mainly in Ca, Mg and Na concentrations. Mainly the concentration of Ca was much higher in lu-cerne hay and red clover silages than in GR, GN and GS. Similar results were reported by other au-thors (Emanuele and Staples, 1990; Flachowsky and Grün, 1992; Gralak et al., 1997). The differences in Na concentrations were found between grass
hy-brids growing in similar conditions. Legumes were more than 4 times higher in Ca than were grasses. Sodium concentration was higher in GR and GN than in LH1 and LH2.
The disappearance of dry matter from individual feeds during the washing process (0 h incubation) was different and was lower from the feeds with a higher content of NDF – grass and grass silage compared to legumes. There were large differ-ences between feeds and elements in the extent of solubilization after washing. The same tendency as in DM disappearance was observed for Ca, Mg, and Na. The lowest solubility was observed for Ca in grasses Rela and Niva. K was the most soluble (>95%). These results are very close to the pub-lished results (Van Eys and Reid, 1986; Emanuele and Staples, 1990; Třináctý et al., 2000). It means that K is released rapidly (Table 2).
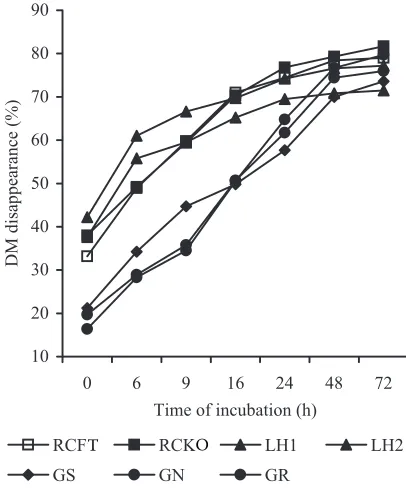
The disappearance of DM and macrominerals was very different in the particular feeds after 72 h incubation in the rumen. Dry matter disappear-ance of feeds was from 73% to 79%, the differences were only 2–9% units. The incubation time influ-enced the rumen dry matter degradability (Figu- re 1). There were small differences between the feeds in potentially degraded fractions (a + b) of DM, larger differences were in the rate of DM de-gradability (from 0.133/h for RCFT to 0.0458/h for GS) (Table 3).
Similar differences between feeds were also de-termined for Mg and K (Table 2). The range of Ca
10 20 30 40 50 60 70 80 90
0 6 9 16 24 48 72 Time of incubation (h)
D M d is ap pe ara nc e (% )
RCFt RCKo LH1 LH2
[image:3.595.65.535.114.340.2]GS GN GR
Table 2. Disappearance of minerals after washing (0 h) and after 72 h incubation in the rumen (the percentage of original concentration)
Feeds DM Ca Mg Na K
0 h 72 h 0 h 72 h 0 h 72 h 0 h 72 h 0 h 72 h
CSFT –x SD 33.20 0.48 79.20 0.59 37.70 0.21 84.70 0.81 73.30 0.09 93.20 0.36 32.20 0.23 71.50 1.50 95.70 0.01 98.70 0.40
CSKO SD–x 38.10 1.02 81.50 2.10 41.90 0.57 86.30 0.80 73.20 0.26 94.70 0.31 51.90 0.61 89.60 0.57 98.20 0.14 99.10 0.67
LH1 –x SD 42.20 0.95 76.40 4.54 53.60 0.23 69.70 1.76 78.00 0.11 89.70 0.60 50.80 0.25 72.00 2.06 99.80 0.001 99.80 0.10
LH2 SD–x 37.60 1.58 73.00 0.82 33.40 0.16 64.60 1.02 56.70 0.10 88.20 0.34 60.80 0.09 81.30 1.40 99.60 1.84 99.80 0.01
GS –x SD 21.20 2.05 75.60 1.94 34.10 0.89 72.20 2.12 77.20 0.31 91.80 0.64 21.20 3.37 78.10 1.67 98.20 0.02 99.70 0.02
GN –x SD 16.40 0.55 79.00 0.28 1.70 0.17 69.00 4.73 30.10 1.05 90.20 1.53 72.60 0.19 98.60 0.22 98.30 0.03 99.80 0.20
GR –x SD 19.70 1.07 76.00 2.11 2.96 0.35 66.90 5.34 31.50 0.94 88.30 1.89 71.00 0.76 97.90 0.33 98.30 0.06 99.80 0.27
Figure 1. Disappearance of dry matter during the incu-bation of forages in the rumen by an in sacco method
[image:3.595.78.281.478.723.2]and Na disappearance was much wider. It was from 64.6% to 86.3% for C and from 71.5% to 98.6% for Na. In all feeds more elements were released during 72 h incubation than by washing. The content of K dropped the most in comparison with its original value during 72 h incubation and its disappearance was the highest in all tested feeds (>98.7%). The re-sults in Table 4 show that the content of Mg, K, and partially of Na dropped after washing in
[image:4.595.63.534.101.237.2]experimen-tal forages. An exception was calcium, the content of which relatively increased in CSFT, CSKO, LH1 and LH2. This indicates that these elements are located in different parts of the plant and have different func-tions. Potassium is located in the cell contents or part of water-soluble plant components and a large portion of slowly released Ca is bound to the cell walls of plants and to bacterial cell walls (Emanuele and Staples, 1990; Flachowsky et al., 1994).
Table 3. Parameters of dry matter disappearance during the incubation of forages in the rumen of young bulls
Feeds –a (%) b (%) a + b (%) c (%/h) Edg (%)
[image:4.595.66.532.404.539.2]x ± SD –x ± SD –x ± SD –x ± SD –x ± SD CSFT 13.5 ± 0.379 64.8 ± 0.205 78.3 ± 0.415 0.133 ± 0.0019 63.4 ± 0.368 CSKO 18.8 ± 0.177 61.8 ± 0.160 80.6 ± 0.072 0.118 ± 0.0045 64.9 ± 0.476 LH1 51.3 ± 0.593 26.1 ± 0.194 77.4 ± 0.774 0.0876 ± 0.0005 67.1 ± 0.448 LH2 42.5 ± 0.343 28.6 ± 0.573 71.1 ± 0.412 0.0996 ± 0.0032 62.9 ± 0.349 GS 24.1± 0.265 51.3± 0.349 75.4 ± 0.492 0.0458 ± 0.0008 51.5 ± 0.212 GN 3.1 ± 0.103 77.9 ± 0.137 81.1 ± 0.068 0.0613 ± 0.0006 50.3 ± 0.218 GR 6.1 ± 0.098 71.3 ± 0.236 77.4 ± 0.323 0.0622 ± 0.0007 49.5 ± 0.415
Table 4. Macromineral concentrations in residues of experimental forages before and after washing (g/kg DM)
Feeds Ca Mg Na K
b.w. a.w. b.w. a.w. b.w. a.w. b.w. a.w.
CSFT 15.29 15.45 3.61 1.54 0.20 0.222 28.98 0.202 CSKO 15.54 15.77 3.68 1.74 0.39 0.331 23.18 0.285
LH1 15.82 13.38 3.30 1.24 0.28 0.206 34.79 0.147
LH2 10.40 11.08 1.72 1.16 0.31 0.194 21.57 0.144
GS 3.66 3.34 1.46 0.559 1.75 0.494 31.38 0.529
GN 3.78 3.14 1.54 0.764 3.02 1.852 29.98 0.204
GR 4.76 2.98 1.91 0.678 0.50 1.105 23.18 0.198
b.w. = before washing, a.w. = after washing
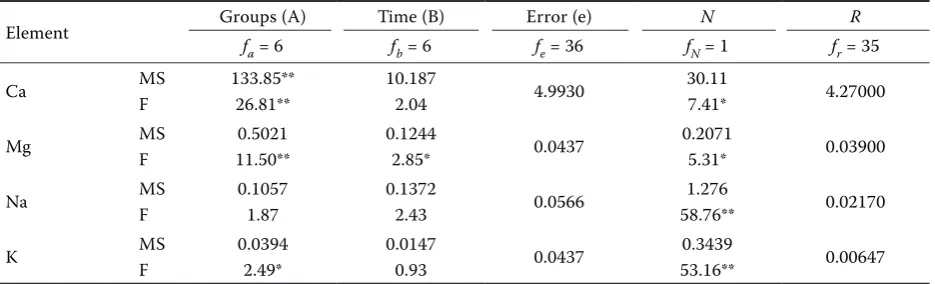
Table 5. Two-way analysis of variance of selected elements with the test of nonadditivity of group (forage) × time of incubation
Element Groups (A) Time (B) Error (e) N R
fa = 6 fb = 6 fe = 36 fN = 1 fr = 35
Ca MS
F
133.85** 26.81**
10.187
2.04 4.9930
30.11
7.41* 4.27000
Mg MS
F
0.5021 11.50**
0.1244
2.85* 0.0437
0.2071
5.31* 0.03900
Na MS
F
0.1057 1.87
0.1372
2.43 0.0566
1.276
58.76** 0.02170
K MS
F
0.0394 2.49*
0.0147
0.93 0.0437
0.3439
53.16** 0.00647
[image:4.595.65.533.600.742.2]exception of Na (Table 5). The time of incubation affected significantly also the release of Mg (P < 0.05). In all macroelements significant or highly significant tests of nonadditivity of forage × time of incubation were observed.
The course of Ca release in the times of incuba-tion (Figure 2) is different between legumes and grass forages. The course is expressed by cubic polynomials with high regression coefficients (R2 = 0.903 – 0.930) for legumes, CSKO, LH1 and LH2 (Table 6). The cation exchange capacity of the cell walls has a significant effect especially on Ca release (binding) and on the availability of Ca. Similar results were also reported for other feeds (Flachowsky and Grun, 1992; Correa, 2006). After the shortest incubation (already 6 h) of bags in the rumen the concentration of Ca increased in all feeds. Ca concentration in the residues of grass samples was nearly constant after the next incubations. On the contrary in the legumes, Ca concentration dropped at first and after longer in-cubation times (>24 h) it increased mainly in LH1 and LH2. Microorganisms have similar effects like the plant fibre that can readily bind the cations of the elements. This increase in Ca concentration in LH1 and LH2 can be explained by the adhesion of microorganisms to the undegraded cell walls of residues in bags.
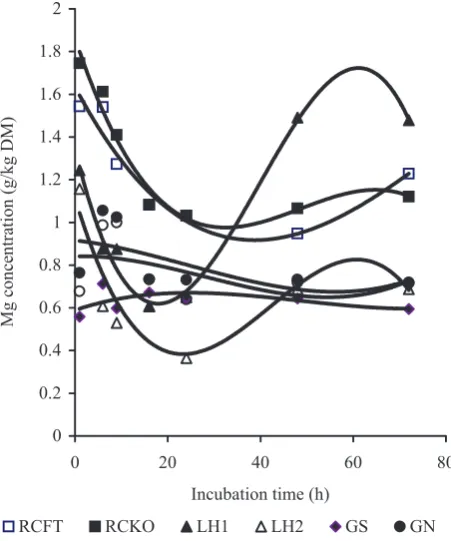
The changes in Mg concentration during incu-bation times in individual feeds are represented in Figure 3. The curves are very different for each group of feeds. They are expressed by cubic poly-nomials and the regression coefficients for legumes are significant (R2 = 0.926 – 0.985). Longer rumen incubation (>24 h) increased Mg concentration in the residues. Emanule and Staples (1990) concluded that the incubation time of 12–30 h is required for the maximum Mg release from lucerne and a longer time (24–36 h) from grasses. Our results are similar. The increase in Mg concentration (like in Ca) in undegraded residues could be caused by the binding of rumen microbes to the cell walls of forages. Mainly gram-negative bacterial walls contain Mg in their outer membrane (Mackie and Therion, 1984).
The expression of Na release by the cubic poly-nomials for all tested forages is shown in Table 6 and the curves of concentration changes in time show the differences between them (Figure 4). The concentration of Na in the residues fluctuated in the times of incubation. Sodium cations from the rumen content and attached microbes could
in-0 5 10 15 20 25
0 20 40 60 80
Incubation time (h)
Ca
c
on
ce
nt
ra
tio
n
(g
/k
g
D
M
)
RCFT RCKO LH1 LH2 GS GN GR
0 0.2 0.4 0.6 0.8 1 1.2 1.4 1.6 1.8 2
0 20 40 60 80
Incubation time (h)
M
g
co
nc
en
tra
tio
n
(g
/k
g
D
M
)
[image:5.595.72.282.85.318.2]RCFT RCKO LH1 LH2 GS GN G
[image:5.595.60.286.453.724.2]Figure 3. The changes in magnesium concentration during the incubation of forages in the rumen (see Table 6) Figure 2. The changes in calcium concentration during the incubation of forages in the rumen (see Table 6)
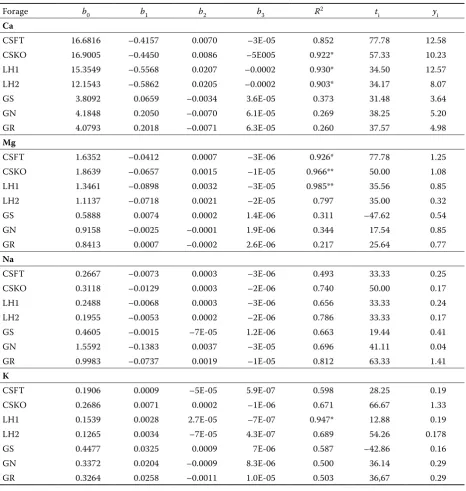
Table 6. Parameter estimation of cubic polynomials y = b0 + b1t + b2t2 + b
3t3 of element release from selected feeds
in the times of ruminal incubation and inflection points (ti, yi)
Forage b0 b1 b2 b3 R2 t
i yi
Ca
CSFT 16.6816 –0.4157 0.0070 –3E-05 0.852 77.78 12.58 CSKO 16.9005 –0.4450 0.0086 –5E005 0.922* 57.33 10.23 LH1 15.3549 –0.5568 0.0207 –0.0002 0.930* 34.50 12.57 LH2 12.1543 –0.5862 0.0205 –0.0002 0.903* 34.17 8.07 GS 3.8092 0.0659 –0.0034 3.6E-05 0.373 31.48 3.64 GN 4.1848 0.2050 –0.0070 6.1E-05 0.269 38.25 5.20 GR 4.0793 0.2018 –0.0071 6.3E-05 0.260 37.57 4.98 Mg
CSFT 1.6352 –0.0412 0.0007 –3E-06 0.926* 77.78 1.25 CSKO 1.8639 –0.0657 0.0015 –1E-05 0.966** 50.00 1.08 LH1 1.3461 –0.0898 0.0032 –3E-05 0.985** 35.56 0.85 LH2 1.1137 –0.0718 0.0021 –2E-05 0.797 35.00 0.32 GS 0.5888 0.0074 0.0002 1.4E-06 0.311 –47.62 0.54 GN 0.9158 –0.0025 –0.0001 1.9E-06 0.344 17.54 0.85 GR 0.8413 0.0007 –0.0002 2.6E-06 0.217 25.64 0.77 Na
CSFT 0.2667 –0.0073 0.0003 –3E-06 0.493 33.33 0.25 CSKO 0.3118 –0.0129 0.0003 –2E-06 0.740 50.00 0.17 LH1 0.2488 –0.0068 0.0003 –3E-06 0.656 33.33 0.24 LH2 0.1955 –0.0053 0.0002 –2E-06 0.786 33.33 0.17 GS 0.4605 –0.0015 –7E-05 1.2E-06 0.663 19.44 0.41 GN 1.5592 –0.1383 0.0037 –3E-05 0.696 41.11 0.04 GR 0.9983 –0.0737 0.0019 –1E-05 0.812 63.33 1.41 K
CSFT 0.1906 0.0009 –5E-05 5.9E-07 0.598 28.25 0.19 CSKO 0.2686 0.0071 0.0002 –1E-06 0.671 66.67 1.33 LH1 0.1539 0.0028 2.7E-05 –7E-07 0.947* 12.88 0.19 LH2 0.1265 0.0034 –7E-05 4.3E-07 0.689 54.26 0.178
GS 0.4477 0.0325 0.0009 7E-06 0.587 –42.86 0.16
GN 0.3372 0.0204 –0.0009 8.3E-06 0.500 36.14 0.29 GR 0.3264 0.0258 –0.0011 1.0E-05 0.503 36,67 0.29
ti = time, yi= concentration of element in g/kg DM
R2
0.05 (3, 3) = 0.902, R20.01(3, 3) = 0.966; *P < 0.05, **P < 0.01
crease the Na concentration of residues of LH1, LH2 and CSFT.
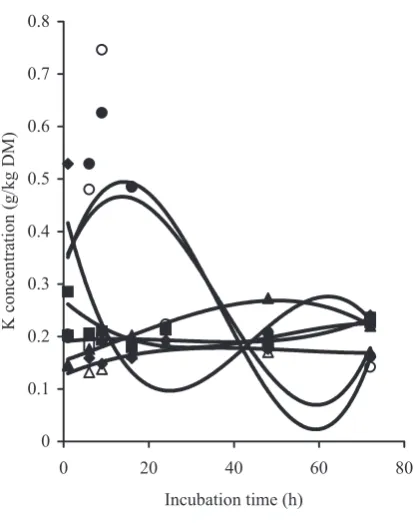
The concentration of the most soluble potas-sium markedly dropped in the residues of CSFT, CSKO and GS till the 16th hour of incubation and then it increased. The course of the curves (Figu- re 5) of K release from the other forages is very dif-ferent, but all are expressed by cubic polynomials
(Table 6) with significant regression coefficients
R2 = 0.947 for LH1. The potassium concentration did not reach the concentration in the original feeds (Flachowsky et al., 1994; Eys and Reid, 1987; Emanuele et al., 1991).
potentially available to rumen microorganisms and absorption from the rumen. The in sacco method can be used for the determination of differences between feeds and element release in the ruminal environ-ment. But it is not suitable for making deductions about mineral availability to ruminants.
REFERENCES
Correa H.J. (2006): Kinetics of macro-mineral release in the rumen from kikuyu grass (Pennisetum clandesti-num) harvested at two cutting intervals. Livest. Res. Rural. Develop., 18, 31.
Čerešňáková Z., Žitňan R., Sommer A., Kokardová M., Szakács J., Ševčík A., Chrenková M. (2000): Parameters of degradability of pasture herbage cell walls and or-ganic matter. Czech J. Anim., 45, 139–144.
Čerešňáková Z., Fľak P., Poláčiková M., Chrenková M. (2005): In sacco NDF degradability and minerals release from the selected forages in the rumen. Czech J. Anim., 50, 320–328.
Emanuele S.M., Staples C.R. (1990): Ruminal release of minerals from six forage species. J. Anim. Sci., 68, 2052–2060.
Emauele S.M., Staples C.R., Wilcox C.J. (1991): Extent and site of mineral release from six forage species
in-cubates in mobile dacron bags. J. Anim. Sci., 69, 801– 810.
Flachowsky G., Grün M. (1992): Influence of type of diet and incubation time on major elements release in sacco
from Italian ryegrass, untreated and ammonia-treated wheat straw. Anim. Feed Sci. Technol., 36, 239–254. Flachowsky G., Grün M., Polzin S., Kronemann H. (1994):
In sacco dry matter degradability and Ca, Mg, and P disappearance from Italian ryegrass, alfalfa hay and wheat straw in sheep and goats. J. Anim. Physiol. Anim. Nutr., 71, 57–64.
Gralak M.A., Leontowicz H., Leontowicz M., Leśniewska V., Kulasek G.W. (1996): The effect of calcium and so-dium loading on organic matter digestibility and min-eral absorption in sheep 3. Changes in the Ca, Mg, Zn and Cu concentrations in rumen fluid. J. Anim. Feed Sci., 5, 365–378.
Gralak M.A., Sciezyynska A., von Keyserlingk M.A.G., Shelford J. (1997): In situ rumen release of some min-erals in dairy cows. In: 17. Arbeitstagung Mengen- und Sputenelemente. Dezember 1997. Jena BRD. 771– 777.
Grofík R., Fľak P. (1990) Štatistické metódy v poľnohos-podárstve. Príroda. Bratislava. 344 pp.
Harazim J., Pavelek P. (1999): Determination of crude protein and amino acids degradability by method in sacco in the rumen. In: Zborník z medzinárodného
-0.5 0 0.5 1 1.5 2
0 20 40 60 80
Incubation time (h)
N
a
co
nc
en
tra
tio
n
(g
/k
g
D
M
)
Naft Nako Nalh1 Nalh2 Nags Nagn Nagr
0 0.1 0.2 0.3 0.4 0.5 0.6 0.7 0.8
0 20 40 60 80
Incubation time (h)
K
c
on
ce
nt
ra
tio
n
(g
/k
g
D
M
)
[image:7.595.319.527.82.344.2]RCFT RCKO LH1 LH2 GS GN GR
[image:7.595.80.280.85.343.2]Figure 4. The changes in sodium concentration during the incubation of forages in the rumen (see Table 6)
Figure 5. The changes in potassium concentration during the incubation of forages in the rumen (see Table 6)
RCFT RCKO LH1 LH2 GS
odborného seminára Stanovení využitelnosti živin u přežvýkavců. Opava. 41–46. (in Czech)
Islam M.R., Nishida T., Ando S., Ishida M., Yoshida N., Arakawa M. (2001): Effect of variety, stage of maturity and botanical fractions on phosphorous concentration and in situ degradability characteristics of phosphorus of whole crop rice silage. Anim. Feed Sci. Technol., 93, 237–248.
Khorasani G.R., Armstrong D.G. (1990): Effect of sodium and potassium level on the absorption of magnesium and other macro-minerals in sheep. Livest. Prod. Sci., 24, 223–235.
Ledoux D.R., Martz F.A. (1991): Ruminal solubilization of selected macrominerals from forages and diets, J. Dairy Sci., 74, 1654–1661.
Lutonská P., Pichl I. (1983): Vláknina. Vyd. Príroda. Bra-tislava. 141 pp.
Mackie R.I., Therion J.J. (1984): Influence of mineral in-teractions on growth and efficiency of rumen bacteria. In: Gilchrist F.M.C., Mackie R.I. (eds.): Herbivore Nu-trition. Sci. Press, Craighall, South Africa. 455–477.
Playne M.J., Achevaria M.G., Megarrity R.G. (1978): Re-lease of nitrogen, sulphur, phosphorus, calcium, mag-nesium, potassium and sodium from four tropical hays during their digestion in nylon bags in the rumen. J. Sci. Food Agr., 29, 520–526.
STN 46 70 92 (1985): Slovenská technická norma: Ana-lytické metódy skúšania krmív. Bratislava.
Třinácty J., Šimek M., Loučka R., Takahashi J. (2000): Total tract digestibility of alfalfa hay minerals evaluated by nylon capsule method. Czech J. Anim. Sci., 45, 65– 69.
Van Eys J.E., Reid R.L. (1987): Ruminal solubility of ni-trogen and minerals from fescue and fescue-red clover herbage. J. Anim. Sci., 65, 1101–1112.
Van Soest P.J., Robertson J.B., Lewis B.A. (1991): Methods for dietary fibre. Neutral detergent fibre and nonstarch polysaccharides in relation to animal nutrition. J. Dairy Sci., 74, 3583–3597.
Received: 2006–06–10 Accepted after corrections: 2007–07–04
Corresponding Author
Ing. Zuzana Čerešňáková, CSc., Department of Animal Nutrition, Research Institute of Animal Production, Hlohovská 2, 949 92 Nitra, Slovak Republic