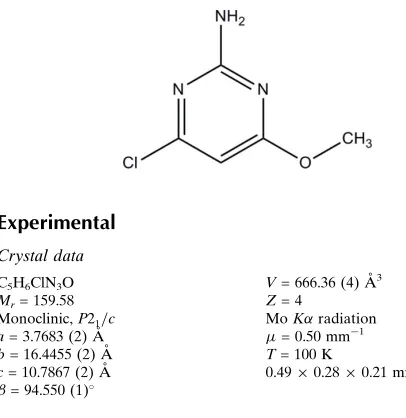
4-Chloro-6-methoxypyrimidin-2-amine
Kaliyaperumal Thanigaimani, Nuridayanti Che Khalib, Suhana Arshad and Ibrahim Abdul Razak*‡
School of Physics, Universiti Sains Malaysia, 11800 USM, Penang, Malaysia Correspondence e-mail: [email protected]
Received 30 October 2012; accepted 2 November 2012
Key indicators: single-crystal X-ray study;T= 100 K; mean(C–C) = 0.001 A˚; Rfactor = 0.027;wRfactor = 0.070; data-to-parameter ratio = 24.4.
The title compound, C5H6ClN3O, is essentially planar with a maximum deviation of 0.0256 (11) A˚ for all non-H atoms. In the crystal, adjacent molecules are linked by a pair of N— H N hydrogen bonds, forming an inversion dimer with an
R2 2
(8) ring motif. The dimers are further linkedviaN—H O hydrogen bonds into an undulating sheet structure parallel to thebcplane.
Related literature
For the biological activity of pyrimidine and aminopyrimidine derivatives, see: Huntet al.(1980); Baker & Santi (1965). For related structures, see: Schwalbe & Williams (1982); Huet al.
(2002); Chinnakaliet al.(1999); Skovsgaard & Bond (2009). For hydrogen-bond motifs, see: Bernstein et al. (1995). For bond-length data, see: Allenet al.(1987). For stability of the temperature controller used for the data collection, see: Cosier & Glazer (1986).
Experimental
Crystal data
C5H6ClN3O
Mr= 159.58 Monoclinic,P21=c
a= 3.7683 (2) A˚
b= 16.4455 (2) A˚
c= 10.7867 (2) A˚
V= 666.36 (4) A˚3
Z= 4
MoKradiation
= 0.50 mm1
T= 100 K
0.490.280.21 mm
Bruker SMART APEXII CCD area-detector diffractometer Absorption correction: multi-scan
(SADABS; Bruker, 2009)
Tmin= 0.791,Tmax= 0.904
9524 measured reflections 2436 independent reflections 2266 reflections withI> 2(I)
Rint= 0.016
Refinement
R[F2> 2(F2)] = 0.027
wR(F2) = 0.070
S= 1.06 2436 reflections 100 parameters
H atoms treated by a mixture of independent and constrained refinement
max= 0.67 e A˚
3 min=0.26 e A˚
[image:1.610.47.250.514.723.2]3
Table 1
Hydrogen-bond geometry (A˚ ,).
D—H A D—H H A D A D—H A
N3—H2N3 O1i
0.828 (16) 2.251 (17) 3.0699 (11) 170.1 (15) N3—H1N3 N1ii 0.850 (16) 2.183 (16) 3.0335 (12) 180 (2) Symmetry codes: (i)x;yþ3
2;zþ 1
2; (ii)xþ2;yþ1;zþ2.
Data collection:APEX2(Bruker, 2009); cell refinement:SAINT
(Bruker, 2009); data reduction:SAINT; program(s) used to solve structure: SHELXTL (Sheldrick, 2008); program(s) used to refine structure:SHELXTL; molecular graphics:SHELXTL; software used to prepare material for publication:SHELXTLandPLATON(Spek, 2009).
The authors thank the Malaysian Government and Universiti Sains Malaysia (USM) for the research facilities and Fundamental Research Grant Scheme (FRGS) No. 203/ PFIZIK/6711171 to conduct this work. KT thanks The Academy of Sciences for the Developing World and USM for a TWAS–USM fellowship.
Supplementary data and figures for this paper are available from the IUCr electronic archives (Reference: IS5214).
References
Allen, F. H., Kennard, O., Watson, D. G., Brammer, L., Orpen, A. G. & Taylor, R. (1987).J. Chem. Soc. Perkin Trans. 2, pp. S1–19.
Baker, B. R. & Santi, D. V. (1965).J. Pharm. Sci.54, 1252–1257.
Bernstein, J., Davis, R. E., Shimoni, L. & Chang, N.-L. (1995).Angew. Chem. Int. Ed. Engl.34, 1555–1573.
Bruker (2009).SADABS,APEX2andSAINT. Bruker AXS Inc., Madison, Wisconsin, USA.
Chinnakali, K., Fun, H.-K., Goswami, S., Mahapatra, A. K. & Nigam, G. D. (1999).Acta Cryst.C55, 399–401.
Cosier, J. & Glazer, A. M. (1986).J. Appl. Cryst.19, 105–107.
Hu, M.-L., Ye, M.-D., Zain, S. M. & Ng, S. W. (2002).Acta Cryst.E58, o1005– o1007.
Hunt, W. E., Schwalbe, C. H., Bird, K. & Mallinson, P. D. (1980).J. Biochem.
187, 533–536.
Schwalbe, C. H. & Williams, G. J. B. (1982).Acta Cryst.B38, 1840–1843. Sheldrick, G. M. (2008).Acta Cryst.A64, 112–122.
Skovsgaard, S. & Bond, A. D. (2009).CrystEngComm,11, 444–453. Spek, A. L. (2009).Acta Cryst.D65, 148–155.
Structure Reports
Online
supporting information
Acta Cryst. (2012). E68, o3318 [doi:10.1107/S160053681204528X]
4-Chloro-6-methoxypyrimidin-2-amine
Kaliyaperumal Thanigaimani, Nuridayanti Che Khalib, Suhana Arshad and Ibrahim Abdul Razak
S1. Comment
Pyrimidine and aminopyrimidine derivatives are biologically important compounds as they occur in nature as
components of nucleic acids. Some aminopyrimidine derivatives are used as antifolate drugs (Hunt et al., 1980; Baker &
Santi, 1965). The crystal structures of aminopyrimidine derivatives (Schwalbe & Williams, 1982), aminopyrimidine
carboxylates (Hu et al., 2002) and co-crystal structures (Chinnakali et al., 1999; Skovsgaard & Bond, 2009) have been
reported. In order to study some interesting hydrogen bonding interactions, the synthesis and structure of the title
compound, (I), is presented here.
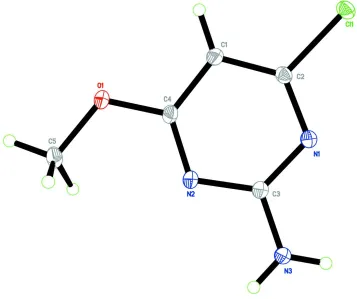
The title compound (Fig. 1) is essentially planar, with atom C5 deviating a maximum of 0.0256 (11) Å from a mean
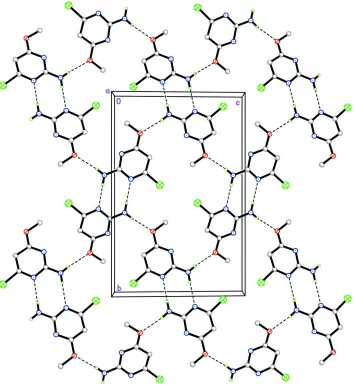
plane of non-H atoms. The bond lengths (Allen et al., 1987) and angles are normal. In the crystal structure (Fig. 2),
molecules are linked by a pair of N3—H1N3···N1ii hydrogen bonds (symmetry code in Table 1) into an inversion dimer,
forming an R22(8) (Bernstein et al., 1995) ring motif. These molecules are self-assembled via N3—H2N3···O1i hydrogen
bonds (graph-set notation C(6); symmetry code in Table 1), which interconnect the dimers resulting in a wavy sheet
parallel to the bc plane.
S2. Experimental
A hot ethanol solutions (20 ml) of 2-amino-4-chloro-6-methoxypyrimidine (36 mg, Aldrich) was warmed over a heating
magnetic stirrer hotplate for a few minutes. The resulting solution was allowed to cool slowly at room temperature.
Single crystals of the title compound (I) appeared from the mother liquor after a few days.
S3. Refinement
N-bound H atoms were located in a difference Fourier maps and refined freely [N—H = 0.828 (16) and 0.850 (16) Å].
The remaining H atoms were positioned geometrically (C–H = 0.95–0.98 Å) and were refined using a riding model, with
Uiso(H) = 1.2Ueq(C) or 1.5Ueq(methyl C). A rotating group model was used for the methyl group. Two outliers were
Figure 1
Figure 2
The crystal packing of the title compound. The H atoms not involved in the intermolecular interactions (dashed lines)
have been omitted for clarity.
4-Chloro-6-methoxypyrimidin-2-amine
Crystal data
C5H6ClN3O
Mr = 159.58 Monoclinic, P21/c
Hall symbol: -P 2ybc a = 3.7683 (2) Å b = 16.4455 (2) Å c = 10.7867 (2) Å β = 94.550 (1)° V = 666.36 (4) Å3
Z = 4
F(000) = 328 Dx = 1.591 Mg m−3
Mo Kα radiation, λ = 0.71073 Å Cell parameters from 6060 reflections θ = 3.8–32.6°
µ = 0.50 mm−1
Bruker SMART APEXII CCD area-detector diffractometer
Radiation source: fine-focus sealed tube Graphite monochromator
φ and ω scans
Absorption correction: multi-scan (SADABS; Bruker, 2009) Tmin = 0.791, Tmax = 0.904
9524 measured reflections 2436 independent reflections 2266 reflections with I > 2σ(I) Rint = 0.016
θmax = 32.6°, θmin = 2.3°
h = −5→5 k = −24→21 l = −16→14
Refinement
Refinement on F2
Least-squares matrix: full R[F2 > 2σ(F2)] = 0.027
wR(F2) = 0.070
S = 1.06 2436 reflections 100 parameters 0 restraints
Primary atom site location: structure-invariant direct methods
Secondary atom site location: difference Fourier map
Hydrogen site location: inferred from neighbouring sites
H atoms treated by a mixture of independent and constrained refinement
w = 1/[σ2(F
o2) + (0.0306P)2 + 0.3355P]
where P = (Fo2 + 2Fc2)/3
(Δ/σ)max = 0.001
Δρmax = 0.67 e Å−3
Δρmin = −0.26 e Å−3
Special details
Experimental. The crystal was placed in the cold stream of an Oxford Cryosystems Cobra open-flow nitrogen cryostat (Cosier & Glazer, 1986) operating at 100.0 (1) K.
Geometry. All e.s.d.'s (except the e.s.d. in the dihedral angle between two l.s. planes) are estimated using the full covariance matrix. The cell e.s.d.'s are taken into account individually in the estimation of e.s.d.'s in distances, angles and torsion angles; correlations between e.s.d.'s in cell parameters are only used when they are defined by crystal symmetry. An approximate (isotropic) treatment of cell e.s.d.'s is used for estimating e.s.d.'s involving l.s. planes.
Refinement. Refinement of F2 against ALL reflections. The weighted R-factor wR and goodness of fit S are based on F2,
conventional R-factors R are based on F, with F set to zero for negative F2. The threshold expression of F2 > σ(F2) is used
only for calculating R-factors(gt) etc. and is not relevant to the choice of reflections for refinement. R-factors based on F2
are statistically about twice as large as those based on F, and R- factors based on ALL data will be even larger.
Fractional atomic coordinates and isotropic or equivalent isotropic displacement parameters (Å2)
x y z Uiso*/Ueq
Cl1 1.11362 (6) 0.546310 (13) 0.64838 (2) 0.01425 (6)
O1 0.57563 (19) 0.80520 (4) 0.79576 (6) 0.01449 (13)
N1 0.9448 (2) 0.57688 (5) 0.87272 (7) 0.01299 (14)
N2 0.6906 (2) 0.70257 (5) 0.93883 (7) 0.01284 (14)
N3 0.8057 (3) 0.59594 (5) 1.07440 (8) 0.01996 (17)
C1 0.8338 (2) 0.68624 (5) 0.72638 (8) 0.01284 (15)
H1A 0.8437 0.7075 0.6448 0.015*
C2 0.9490 (2) 0.60954 (5) 0.76040 (8) 0.01137 (14)
C3 0.8137 (2) 0.62570 (5) 0.95924 (8) 0.01305 (15)
C4 0.7000 (2) 0.73004 (5) 0.82415 (8) 0.01155 (15)
C5 0.4336 (3) 0.85141 (6) 0.89378 (9) 0.01568 (16)
H2N3 0.722 (4) 0.6245 (10) 1.1281 (15) 0.027 (4)*
H1N3 0.876 (4) 0.5475 (10) 1.0891 (15) 0.023 (4)*
Atomic displacement parameters (Å2)
U11 U22 U33 U12 U13 U23
Cl1 0.01773 (10) 0.01199 (10) 0.01346 (10) 0.00039 (7) 0.00388 (7) −0.00276 (7) O1 0.0206 (3) 0.0093 (3) 0.0136 (3) 0.0025 (2) 0.0019 (2) 0.0013 (2) N1 0.0169 (3) 0.0103 (3) 0.0119 (3) 0.0017 (2) 0.0022 (2) 0.0000 (2) N2 0.0170 (3) 0.0092 (3) 0.0124 (3) 0.0018 (2) 0.0017 (2) 0.0004 (2) N3 0.0359 (5) 0.0129 (4) 0.0119 (3) 0.0084 (3) 0.0069 (3) 0.0022 (3) C1 0.0171 (4) 0.0105 (3) 0.0110 (3) 0.0002 (3) 0.0014 (3) 0.0003 (3) C2 0.0128 (3) 0.0099 (3) 0.0116 (3) −0.0006 (3) 0.0018 (3) −0.0018 (3) C3 0.0171 (4) 0.0103 (3) 0.0118 (3) 0.0014 (3) 0.0020 (3) 0.0005 (3) C4 0.0130 (3) 0.0086 (3) 0.0130 (3) −0.0001 (3) 0.0004 (3) 0.0003 (3) C5 0.0176 (4) 0.0115 (4) 0.0182 (4) 0.0029 (3) 0.0026 (3) −0.0013 (3)
Geometric parameters (Å, º)
Cl1—C2 1.7449 (9) N3—H2N3 0.828 (16)
O1—C4 1.3485 (10) N3—H1N3 0.850 (16)
O1—C5 1.4393 (11) C1—C2 1.3743 (12)
N1—C2 1.3266 (11) C1—C4 1.4035 (12)
N1—C3 1.3539 (11) C1—H1A 0.9500
N2—C4 1.3201 (11) C5—H5A 0.9800
N2—C3 1.3584 (11) C5—H5B 0.9800
N3—C3 1.3378 (12) C5—H5C 0.9800
C4—O1—C5 117.38 (7) N3—C3—N1 117.35 (8)
C2—N1—C3 114.89 (8) N3—C3—N2 117.28 (8)
C4—N2—C3 115.86 (8) N1—C3—N2 125.37 (8)
C3—N3—H2N3 118.7 (11) N2—C4—O1 119.46 (8)
C3—N3—H1N3 119.1 (11) N2—C4—C1 124.50 (8)
H2N3—N3—H1N3 122.1 (15) O1—C4—C1 116.04 (8)
C2—C1—C4 113.28 (8) O1—C5—H5A 109.5
C2—C1—H1A 123.4 O1—C5—H5B 109.5
C4—C1—H1A 123.4 H5A—C5—H5B 109.5
N1—C2—C1 126.09 (8) O1—C5—H5C 109.5
N1—C2—Cl1 114.95 (6) H5A—C5—H5C 109.5
C1—C2—Cl1 118.96 (7) H5B—C5—H5C 109.5
C3—N1—C2—C1 −0.18 (13) C4—N2—C3—N1 0.61 (14)
C3—N1—C2—Cl1 −179.36 (6) C3—N2—C4—O1 178.63 (8)
C4—C1—C2—N1 −0.63 (13) C3—N2—C4—C1 −1.55 (13)
C4—C1—C2—Cl1 178.52 (6) C5—O1—C4—N2 −0.73 (12)
C2—N1—C3—N3 −179.55 (9) C5—O1—C4—C1 179.44 (8)
C2—N1—C3—N2 0.22 (13) C2—C1—C4—N2 1.55 (13)
D—H···A D—H H···A D···A D—H···A
N3—H2N3···O1i 0.828 (16) 2.251 (17) 3.0699 (11) 170.1 (15)
N3—H1N3···N1ii 0.850 (16) 2.183 (16) 3.0335 (12) 180 (2)