Fermentation is a metabolic process serving for some microorganisms to get energy through digestion of simple fermentable sugars, mostly glucose and fructose. In bakery fermentation, the production of carbon dioxide (CO2) is required as it serves for fluffing up the dough. The principle of rheological apparatus, used for the evaluation of fermented dough properties during its matu-ration, is the measurement of gaseous volume or pressure produced. Fermentograph SJA (Sweden) or advanced type Rheofermentometer (Chopin, France) can describe this dough behaviour. The purpose of fermentation is to bring dough to the optimum condition for baking. The amount of CO2 depends on yeast and flour properties under stand-ard conditions of the dough preparation which have strong effect on the final product quality (B������ 1993). C����������� and P������� (1993) devel-oped methodology to assess fermentation with the use of rheofermentometer and a shortened baking test on the bread-making machine. The formula of dough also influences the properties of leavened
dough. Full-bread-formula is usually used for dough fermentograph testing.
The objective of this study was to compare fermen-tograph behaviour of commercial flours from two years’ harvest and to describe differences between the behaviour of commercial and variety flours in a full-bread-formula. Fermentograph data were completed by other rheological characteristics de-termined by maturograph and oven rise recorder test for fermented dough, and by alveograph test for non-fermented dough. Baking test with full-bread-formula was also performed as the best criterion of flour baking quality.
MATERIALS AND METHODS
Two sets of commercial and one set of variety bakery (fine, bright) flours were used for this fermentation process study. The first set of com-mercial flours came from the year 2001 harvest (33 samples), the second one from the year 2000 harvest and consisted of 30 samples. The group of
Wheat Flour Fermentation Study
I��� ŠVEC and M���� HRUŠKOVÁ
Department of Carbohydrate Chemistry and Technology, Faculty of Food and Biochemical Technology, Institute of Chemical Technology in Prague, Prague, Czech Republic
Abstract
Š��� I., H������� M.(2004): Wheat flour fermentation study. Czech J. Food Sci., 22: 17–23.
Fermentograph and baking properties of 98 wheat flour samples (two sets of commercial and one set of variety) were evaluated in the form of fermented dough. Analytical traits (ash and protein contents, wet gluten, Falling Number, Zeleny sedimentation value), fermentograph parameters (gases volume, the volume of dough and the time of its max. increase), and the laboratory baking test were used for the characterisation of flours and doughs. Differences found between the two commercial flour sets were small and were influenced by the year of harvest. Significant differences were found between commercial and variety flours both in the fermentograph behaviour and in the baking test results. Lower dough volumes and lower bread specific volumes for variety flours in comparison with commercial ones were caused by a worse quality of proteins. Statistical analysis on significance level 99% showed correlations between the gases volume and the dough volume (r = 0.5264), between the gases volume and the time of dough maximum (r = –0.7689), and between the dough volume and the specific volume of bread (r = 0.5452).
variety flours contained 35 samples. Commercial flours were produced on industrial mill, variety ones on laboratory mill Buhler (Germany).
The basic flour quality was determined according to the Czech standard methods – ČSN 55 0512 for the ash, wet gluten, and protein contents, ČSN ISO 3039 for Falling Number and ČSN ISO 5529 for Zeleny sedimentation test.
The rheological properties of the fermented dough were evaluated by Fermentograph SJA (Sweden), maturograph and oven rise recorder (OTG) (Brabender, Germany). The properties of non-fermented dough (system flour-salt) were measured by alveograph (Chopin, France).
Fermentograph test procedure is not included in any international or Czech standard method either, so this test was performed according to our internal method. Fermentograph SJA works parallel in two measurement modes:
1. Mode “gas”– increase of gases VG (fermentograph units – FeU) is observed,
2. Mode “dough” – volume change of dough sample VD (FeU) and time of its maximum increase T (min) is observed.
The dough for the fermentograph test is prepared in farinograph (Brabender, Germany) using the baking test formula and the water amount to reach optimal consistency of 600 ± 20 FU. The dough is divided into two pieces (150 g) by hand and put into the inner fermentation cylinder. The dough sample surface is calibrated to the standard starting height. The inner cylinder is inserted into the outer one and the space between them is filled with 900 ml water of the temperature of 30°C. The sample is
placed into the temperate fermentograph chamber onto the carrier, in mode “gas” is sealed up by a metal bell, in mode “dough” the level indicator is placed on the dough surface. The weight of the measurement components is balanced by weights, 600 g for mode “gas”, 350 g for mode “dough”. Fermentograph plotter registers the changes in the volume of gases and the volume of the dough. From the plotter records, fermentograph values (VG, VD and T) are read. The fermentograph behaviour in both modes of measurement can be evaluated for two samples of flour simultaneously.
The baking test was performed according to the Czech method and the formula used was: flour – 100%, compressed yeast – 4%, sugar – 1.5%, fat – 1%, salt – 0.7% (all components counted at flour basic), and water to optimal dough consistency (600 ± 20 FU). The dough from 300 g of flour was prepared in farinograph (Brabender, Germany). Dividing and moulding of the dough was made by hand. A�er standard leavening (50 min), the pieces of the dough were baked at 240°C for 14 min. The bread form and volume were measured a�er two hours of cooling; the volume of bread was determined by displacement method with rapeseeds.
The data obtained characterising rheology of dough, fermentation process, and baking test are summarised in tables and were evaluated by cor-relation analysis.
RESULTS AND DISCUSSION
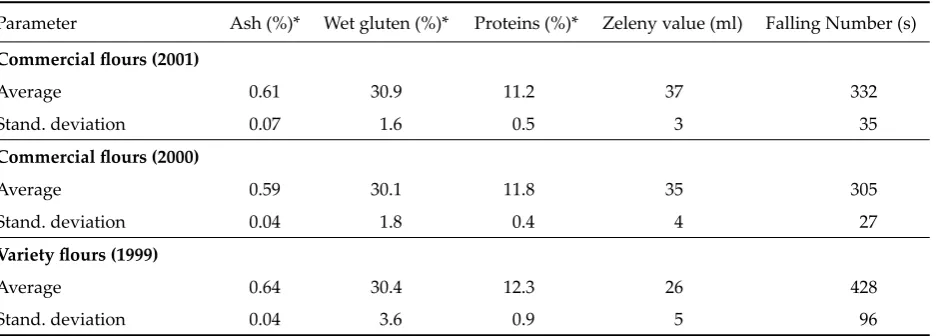
[image:2.595.66.537.570.738.2]Analytical characteristics describing flour quality are given in Table 1.
Table 1. Average values of flour analytical parameters
Parameter Ash (%)* Wet gluten (%)* Proteins (%)* Zeleny value (ml) Falling Number (s) Commercial flours (2001)
Average 0.61 30.9 11.2 37 332
Stand. deviation 0.07 1.6 0.5 3 35
Commercial flours (2000)
Average 0.59 30.1 11.8 35 305
Stand. deviation 0.04 1.8 0.4 4 27
Variety flours (1999)
Average 0.64 30.4 12.3 26 428
Stand. deviation 0.04 3.6 0.9 5 96
Differences between commercial flours are small – significant differences for bakery are in content and quality of proteins. Falling Number indicates the extent of enzymatic activity – high average value of variety flours has been caused by a longer time of storage which means a low activity of amylases. Fermentograph behaviour (Table 2) of two commercial flours sets is not so noticeably different as is the behaviour of commercial and variety flours. Commercial flours from the year 2000 harvest had a higher average dough volume but a shorter time of the dough max. increase than commercial flours from the harvest of 2001. In the bakery process, this means a lower resistence to the mechanical stress during dough kneeding. One and half higher volume of gases for commercial flours from the harvest of 2000 in comparison with commercial flours from the harvest of 2001 could probably cause higher volumes of bread in the baking
[image:3.595.65.535.101.292.2]test but the baking test with commercial flours (of 2000) was not performed. The comparison of the baking test data between commercial (2001) and variety flours (1999) testified for a worse quality of proteins in the variety flours because variety flours volumes of gases were not displayed in specific volumes of bread. The form of the baking test bread was be�er for the bread from variety flours although its specific volume was lower than for the commercial flours bread. Maturograph and oven rise recorder characteristics (Table 3) describe more intimately the properties of fermented dough. The value of optimal leavening time serves also for the oven rise recorder test – optimaly leavened dough is a�er the expiration of this time put into an oil bath to evaluate the dough volume changes in the first phasis of baking. Maturograph and OTG data are affected by the volume of fermentation gases (Table 5) and are also related to the bread characteristics as described
Table 2. Average values of fermentograph and baking test parameters
Parameter Fermentograph test Baking test
VD (FeU) T (min) VG (FeU) spec. volume (ml/100g) v/d (1) Commercial flours (2001)
Average 70 99 66 337 0.62
Stand. deviation 3 15 5 14 0.02
Commercial flours (2000)
Average 78 74 104
Stand. deviation 9 20 21
Variety flours (1999)
Average 59 43 131 286 0.66
Stand. deviation 5 7 12 38 0.05
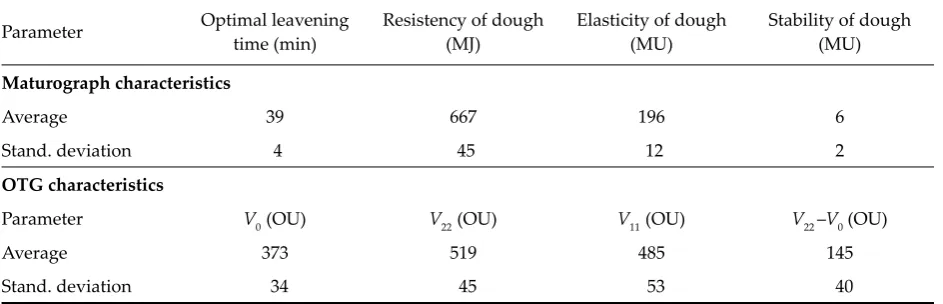
Table 3. Average values of maturograph and OTG parameters (commercial flours 2001)
Parameter Optimal leavening time (min) Resistency of dough (MJ) Elasticity of dough (MU) Stability of dough (MU)
Maturograph characteristics
Average 39 667 196 6
Stand. deviation 4 45 12 2
OTG characteristics
Parameter V0 (OU) V22 (OU) V11 (OU) V22 –V0 (OU)
Average 373 519 485 145
[image:3.595.63.535.604.756.2]by K������� (2002). Commercial flours (2000) had different baking qualities as evaluated on alveograph (Table 4), which involved bakery weak (W = 100 × 10–4 J) and bakery strong (W = 248 × 10–4 J) samples (Š����� 2002).
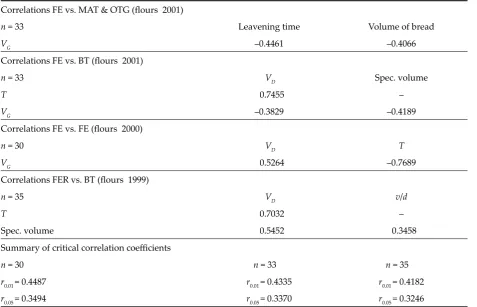
The results of correlation analysis are summarised in Table 5. Statistically confirmed relations were found between all groups of rheological character-istics (significancy levels 0.05 and 0.01). Relations between fermentograph, maturograph, OTG, and baking test characteristics are comprehensible, on the one hand these a�ributes are concerned with fermented dough, on the other hand, single tests simulate, on the laboratory scale indeed, the connect-ing steps in the proccessconnect-ing of bread, from dough
kneeding to bread baking. Statistical assessment of fermentograph and baking test characteristics proved a relation between the time of max. increase of dough and the final dough volume, identically for commercial flours from the harvest of 1999 and of 2001. The values of the time of max. increase as well as the final dough volumes depend on the proper-ties of flour proteins. The volume of fermentation gases determines the final volume of dough and affects the time of its max. increase, but this effect, too, depends on the protein quality.
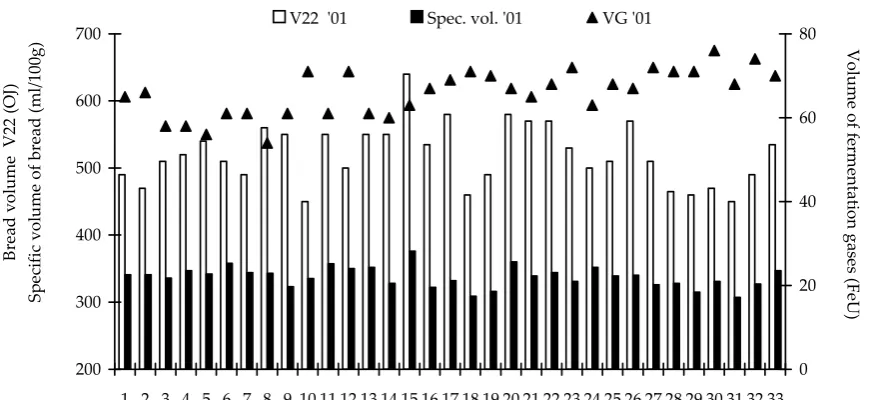
[image:4.595.65.526.320.372.2]Figure 1 shows the influence of fermentation gases on the bread volume (OTG test) and the specific volume of bread in the baking test. Correlation analysis in Table 5 proves relations between these
Table 4. Average values of alveograph parameters (commercial flours 2000)
Parameter Elasticity P (mm) Extensibility L (mm) P/L (1) Energy W (× 10–4 J)
Average 103 58 1.93 165.99
[image:4.595.63.541.428.735.2]Stand. deviation 23 14 0.81 35.47
Table 5. Quality characteristics correlation analysis of commercial and variety flours (statistically confirmative relations)
Correlations FE vs. MAT & OTG (flours 2001)
n = 33 Leavening time Volume of bread
VG –0.4461 –0.4066
Correlations FE vs. BT (flours 2001)
n = 33 VD Spec. volume
T 0.7455 –
VG –0.3829 –0.4189
Correlations FE vs. FE (flours 2000)
n = 30 VD T
VG 0.5264 –0.7689
Correlations FER vs. BT (flours 1999)
n = 35 VD v/d
T 0.7032 –
Spec. volume 0.5452 0.3458
Summary of critical correlation coefficients
n = 30 n = 33 n = 35
r0.01 = 0.4487 r0.01 = 0.4335 r0.01 = 0.4182
r0.05 = 0.3494 r0.05 = 0.3370 r0.05 = 0.3246
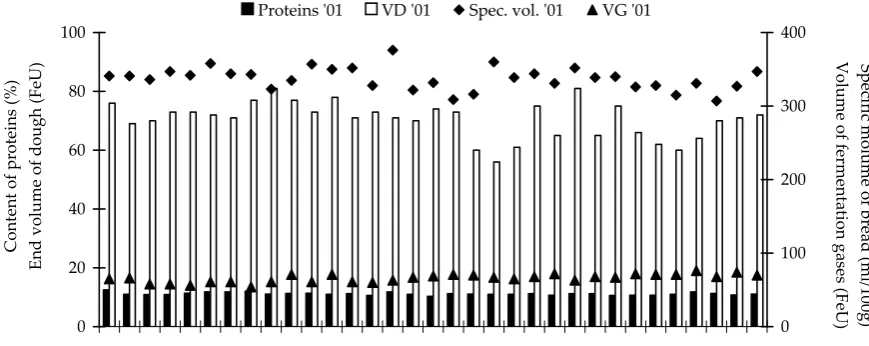
three characteristics – fermentation gases affect both volumes. Figures 2a and 2b compare the influence of other three characteristics (protein content, fermentograph final dough volume and the volume of fermentation gases) on the specific volume of bread for commercial and variety flours (harvest of 2001 and of 1999). The dough frame is built from gluten proteins, their amount and qual-ity predetermine (together with the fermentation gases amount) the volume of dough at the end of leavening and the volume of bread. Weaker gluten proteins in dough from variety flours (1999) did not hold fermentation gases and due to this the bread of these flours produced a smaller specific volume than did the bread of commercial flours (harvest 2001).
Conclusions
The quality of two commercial and one variety flour sets described by the ash content, Falling Number, and Zeleny sedimentation value was evaluated. The technological quality of flours was determined by laboratory baking test. Fermento-graph behaviour differences between two sets of commercial flours were observed mainly in the time of max. dough increase and the volume of fermentation gases; the average time was longer for flours from the harvest of 2001, a higher volume was
found for flours from the harvest of 2000. Different rheological behaviours of commercial and variety flours were compared, apart from the different storage time of these flours. Variety flours had nearly twice as high volume of fermentation gases but a lower final dough volume and the specific volume of bread was markedly lower.
The volume of fermentation gases influences all other rheological characteristics:
– maturograph optimal leavening time and OTG volume of bread negatively,
– fermentograph final dough volume positively and the time of max. dough increase negatively, – baking test specific volume of bread negatively.
Next confirmative relations were found be-tween:
– final dough volume and the time of its max. increase, and the specific bread volume,
– the specific bread volume and the form of bread (ratio height/diameter).
Specific bread volume dependence on the vol-ume of fermentation gases is influenced by the protein amount and quality, as is evident from the results of the baking test comparing commercial and variety flours.
Fermentograph SJA (Sweden) completes others rheological apparatuses by the evaluation of the fermented dough properties. It characterises dough maturation by the measurement of the
fermen-Figure 1. Fermentation gases influence on bread volume (OTG) and specific volume of bread (commercial flours, harvest 2001)
200 300 400 500 600 700
1 2 3 4 5 6 7 8 9 10 11 12 13 14 15 16 17 18 19 20 21 22 23 24 25 26 27 28 29 30 31 32 33
Sample
0 20 40 60 80 V22 '01 Spec. vol. '01 VG '01
Br
ea
d
vo
lu
m
e
V
22
(O
J)
Sp
ec
ifi
c
vo
lu
m
e
of
br
ea
d
(m
l/1
00
g) Volu
m
e
of
fer
m
en
tat
io
n
ga
se
s
(F
eU
[image:5.595.80.516.85.285.2]tation gases volume under standard conditions. The volumes of the fermentation gases and the dough at the end of the fermentograph test are related to the specific volume of bread from the baking test.
References
B������ A.-H. (1993): Dough structure, dough rheology,
and baking quality. Cereal Foods World, 35: 238–244.
C����������� Z., P������� Y. (1993): Gas formation
0 20 40 60 80
1 3 5 7 9 11 13 15 17 19 21 23 25 27 29 31 33 35 Sample 0 100 200 300 400 Proteins '99 VD '99 Spec. vol. '99 VG '99
Sp ec ific m olu m e of bre ad (m l/1 00 g) V olu m e of fer m en tat io n ga se s (F eU ) C on te nt of pr ot ei ns (% ) En d vo lu m e of do ug h (F eU ) 0 20 40 60 80 100
1 2 3 4 5 6 7 8 9 10 11 12 13 14 15 16 17 18 19 20 21 22 23 24 25 26 27 28 29 30 31 32 33 Sample 0 100 200 300 400 Proteins '01 VD '01 Spec. vol. '01 VG '01
[image:6.595.76.516.86.271.2]C on te nt of pr ot ei ns (% ) En d vo lu m e of do ug h (F eU ) Sp ec ific m olu m e of bre ad (m l/1 00 g) V olu m e of fer m en tat io n ga se s (F eU )
Figure 2a. Specific bread volume dependence on proteins content and fermentograph volumes of dough and fermentation gases (variety fours, harvest 1999)
Figure 2b. Specific bread volume dependence on proteins content and fermentograph volumes of dough and fermentation gases (commercial flours, harvest 2001)
and gas retention I. The system and methodology.
Cereal Foods World, 38: 499–503.
K������� I. (2002): Uplatnění přístroje OTG pro sle-dování vlastností pšeničného těsta. [Diploma Thesis.] Institute of Chemical Technology, Prague.
Š����� P. (2002): Predikce alveografických vlastností pomocí NIR techniky. [Bachelor Thesis.] Institute of Chemical Technology, Prague.
[image:6.595.75.510.334.507.2]Souhrn
Š��� I., H������� M. (2004): Studie fermentace pšeničných mouk.Czech J. Food Sci., 22: 17–23.
Fermentografické a reologické vlastnosti 98 pšeničných mouk (2 soubory komerčních a 1 soubor odrůdových) byly sledovány ve formě fermentovaného těsta. Analytické jakostní znaky (obsah popela, bílkovin, mokrého lepku, číslo poklesu, Zelenyho sedimentační hodnota), fermentografické znaky (celkový objem kvasných plynů, konečný objem těsta a doba jeho max. nárůstu) a výsledky pokusného pečení byly použity pro hodnocení vlastností mouk a těst. Vliv ročníku sklizně se projevil mezi soubory komerčních mouk, ale zjištěné rozdíly nebyly výrazné. Významné rozdíly byly zjištěny mezi komerčními a odrůdovými moukami, a to jak ve fermentografickém chování, tak i ve výsledcích pekařského pokusu. Nižší konečné objemy těst a nižší měrné objemy pečiva z odrůdových mouk ve srovnání s moukami komerčními byly způsobeny horší kvalitou bílkovin. Statistická analýza na hladině 99 % pro-kázala korelace mezi objemem kvasných plynů a konečným objemem těsta (r = 0,5264), objemem kvasných plynů a dobou max. nárůstu těsta (r = –0,7689) a konečným objemem těsta a měrným objemem pečiva (r = 0,5452).
Klíčová slova: pšeničná mouka; fermentované těsto; fermentograf; pekařský pokus; maturograf; OTG
Corresponding author:
Ing. I��� Š���, Vysoká škola chemicko-technologická v Praze, Fakulta potravinářské a biochemické technologie, Ústav chemie a technologie sacharidů, Technická 5, 166 28 Praha 6, Česká republika