462
Supported by the Ministry of Agriculture of the Czech Republic (Project No. QJ1510141).
Genetic diversity within and gene flow between three
draught horse breeds using genealogical information
H. Vostrá-Vydrová
2, L. Vostrý
1,2, B. Hofmanová
1, E. Krupa
2, Z. Veselá
2,
J. Schmidová
1,21Czech University of Life Sciences Prague, Prague, Czech Republic
2Institute of Animal Science, Prague-Uhříněves, Czech Republic
ABSTRACT: Three draught horse breeds are maintained in the Czech Republic: the Silesian Noriker (SN), the Noriker (N), and the Czech-Moravian Belgian (CMB). Because the SN and CMB populations are currently closed to outside breeding and are endangered (Genetic Resources), the loss of the genetic variation these horses represent is concerning. Genetic diversity within and between these three breeds and their population structures was analyzed based on pedigree information. Our goal was to identify and quantify factors that affected their genetic variability. Theeffective population size was analyzed in each breed. The numbers of generations were 22, 32, and 32 for the SN, N, and CMB breeds, respectively, with average equivalent known generations of 9.81, 8.45, and 8.91, respectively. The effective numbers of founders and ancestors contributing to the current genetic pool were, respectively, 69.42 and 22.32 for the SN breed, 98.48 and 42.20 for the N breed, and 43.33 and 23.32 for the CMB breed. The average inbreeding coefficients were 4.6%, 2%, and 4% for the SN, N, and CMB breeds, respectively, and the average inbreeding rate was 0.5% for the SN and CMB breeds and 0.2% for the N breed. The corresponding estimates of effective population size were 95, 195, and 101 for the SN, N, and CMB breeds, respectively. These statistics suggest that the genetic variability has decreased, and without changes in breeding strategy the genetic variability might continue to decline. Using genealogical F-statistics, small genetic differences were identified between the analyzed populations (FST = 0.02).
Keywords: genetic drift; inbreeding; Silesian Noriker; Noriker; Czech-Moravian Belgian horse
INTRODUCTION
The preservation of endangered species is one of the most important goals in current biological science. Conservation programmes are needed to preserve breeds with significant genetic diversity. The genetic structure of a population is shaped by different mechanisms, including gene flow, selec-tion pressure, mutaselec-tion, and genetic drift, all of which might vary in magnitude over time and be influenced by factors intrinsic or extrinsic to the population. These factors are the most relevant for structuring within-breed diversity.
The Silesian Noriker (SN), Czech-Moravian Bel-gian (CMB) draught horse breeds, along with the
463
continuously maintained on the CR territory for 150 years. To a large extent, the SN and CMB breeds have been geographically separated.
World War II negatively impacted breeding pro-grammes because there was a steep decrease in the number of horses. The post-war expansion of farm mechanization caused a further decrease in the numbers. The SN, N, and CMB breeds were registered as separate breeds until the 1960s, but because of their decreasing numbers, all animals were merged into a single studbook – “synthetic breed” called the Czech Draught Horse (CDH). At this time, stallions and mares were used across the original breeds and all offspring including the crossbreeds were considered as “purebred indi-viduals” of this new synthetic population. These genetically crossbred animals were also included in the breeding. However, in 1989, draught horses in the Czech Republic were reassigned into the original three populations (SN, N, and CMB) based on morphological analysis. During this period, al-though the analyzed breeds were separated, these animals were maintained as open populations and “crossbreeding” was conducted between them. After 1996 and 1999, the populations of SN and CMB horses were certified as rare and endangered breeds (Genetic Resources), and their studbooks were closed. Although SN stallions were still used for breeding with N mares, their offspring, with more than 50% of the SN breed’s genes, were in-cluded in the studbook, and these animals were regularly included in the SN breed (until 2013).
Based on the above-mentioned historical de-velopment, these three analyzed draft breeds can genetically be considered as a single breed with three subpopulations.
A primary molecular genetic analysis utiliz-ing 13 microsatellite markers (Hofmanova et al. 2014) suggested high genetic similarity between the above-mentioned draught breeds. However, Toro et al. (2009) suggested that these markers were not necessarily good predictors of genomic coancestry because there are problems in estimating genomic heterozygosity based on only a few molecular mark-ers. Until recently, no analysis of the gene flow between these three breeds has been conducted.
The objective of the present study was to describe the level of genetic variability between and within Czech draught horse breeds and to estimate the degree of gene flow and genetic differences among these animals based on genealogical information.
Secondly, we analyzed the genetic relationships between the breeds and between individual horses within these breeds.
MATERIAL AND METHODS
Data. A total of 27 022 pedigree records of regis-tered individuals in studbooks dating from 1900 to June 31, 2013 were provided from the Association of Horse Breeders’ Unions of the Czech Republic. Pedigree analyses were performed using one ref-erence population containing animals potentially contributing to the next generations. The refer-ence population was defined as the entire active population of individuals (stallions and mares) born in the years 1996–2010 (n = 2202).
Pedigree completeness measures. The pedi-gree completeness and the number of ancestral generations influence the estimated inbreeding coefficients and the relationship coefficients be-tween animals. The pedigree completeness level was assessed as the proportion of ancestors known per generation for each offspring (MacCluer et al.
1983). The number of equivalent complete genera-tions in the pedigree (t) was computed according to Maignel et al. (1996) as follows:
t = Σ(1/2)n
where:
n = number of generations between an animal and its ancestor
Probability of gene origin. Several measures of genetic variability were calculated from the pedigree data. The total number of founders (f) for each breed was determined as the total number of ancestors with unknown parents. The effective number of founders (fe) is defined as the number of founders explaining the same level of genetic diversity as that observed in the reference popula-tion (Lacy 1989). This parameter is the reciprocal of the probability that two randomly drawn genes in the population under study originated from the same founder (James 1972). The effective number of founders (fe) was estimated using the formula:
where:
f = total number of founders
qi = genetic contribution of the i-th founder to the
refer-ence population
4
��� 1 ∑� ���
464
The effective number of ancestors (fa) is defined as the minimum number of ancestors, not necessar-ily of founders, explaining the same genetic diver-sity as that in the reference population (Boichard et al. 1997). The effective number of ancestors was obtained after determining the marginal genetic contribution of each ancestor. The parameter fa
accounts for losses of genetic variability resulting from bottlenecks caused by unequal contributions among reproductive individuals to future genera-tions. The effective number of ancestors (fa) was estimated using the formula:
where:
pi = marginal genetic contribution of ancestor i a = total number of ancestors
The founder genome equivalent (fge) is defined as the effective number of founders with a non-random loss of founder alleles resulting in genetic variability identical to that defined in the refer-ence population (Lacy 1989). The founder genome equivalent accounts for both unequal contributions of founders and the random loss of alleles caused by genetic drift (Lacy 1989). The founder genome equivalent (fge) was calculated using the method of Caballero and Toro (2000):
fge = 1 2fg
where:
fg = average coancestry coefficient for the reference popu- lation
According to Caballero and Toro (2000), the average coancestry coefficient (fg) was estimated using the formula:
where:
aij = elements of the relatedness matrix n = number of individuals in the pedigree
The effective number of non-founders (Nenf) accounts for the effects of genetic drift in non-founder generations and was computed according to Caballero and Toro (2000):
1 = 1 + 1
fge fe Nenf where:
fge = founder genome equivalent fe = effective number of founders
Inbreeding coefficient and relatedness coef-ficient. The inbreeding coefficient of each indi-vidual (Fi) was estimated using a tabular method (Falconer and Mackay 1996) based on the method of VanRaden (1992):
Fi = aii – 1
where:
Fi = inbreeding coefficient of individual i
aii = additive genetic relationship of individual i to itself
The average relatedness coefficient of each in-dividual(AR) was computed as the average coef-ficient integrating the row from the individual in the numerator relationship matrix A. This coef-ficient indicates the probability that a randomly selected allele in the population occurs in a se-lected individual or among a group of individuals (Goyache et al. 2003).
The realized effective population size (Ne) rep-resents the number of unrelated individuals who would cause the same increase of inbreeding as that of the reference population. The realized effective population sizes (Ne) were estimated based on an individual increase in inbreeding ΔFi
(Gutierrez et al. 2008):
where:
Fi = inbreeding coefficient of individual i ti = equivalent complete generations
The realized effective population size (Ne) was estimated according to Cervantes et al. (2008) using the formula:
—
Ne = 1 2-Δ-F
where:
-ΔF- = average individual increase in the inbreeding of the reference population
The loss of genetic diversity (gene identity) in the reference population due to genetic drift or unequal founder contribution was derived from fe
and fge. The total loss of genetic diversity caused by genetic drift or bottleneck (GD) was computed using the function (Lacy 1995):
1 – GD, GD = 1 – 1 2fge
where:
fge = founder genome equivalent
10
���∑ ∑ ��� � ��� � ���
���
6
���∑ 1� �� � ���
12
465
The loss of genetic diversity (gene identity) result-ing from an unequal founder contribution (GD*) was estimated using the function (Caballero and Toro 2000):
1 – GD*, GD* = 1 – 1 2fe
where:
fe = effective number of founders
The difference between GD and GD* is the loss of genetic diversity caused by the genetic drift across generations of non-founders and corresponds to the inverse value of 2Nenf:
GD – GD* = 1 2Nenf
where:
Nenf = effective number of non-founders
The genetic diversity between breeds was evalu-ated based on genealogical information using
F-statistics (Wright 1969) for the entire meta- population and for each breed. F-statistics (Wright 1969) were estimated according to Caballero and Toro (2002):
FIS = F~ – ~f , FST = f~ – ~f = D – , FIT = F~ – ~f 1 – ~f 1 – ~f 1 – ~f 1 – ~f
where:
FIS, FST, FIT = Wright’s fixation coefficients
~f , ~F = average coancestry and inbreeding coefficients for the entire metapopulation, respectively ~
f = average coancestry coefficient of subpopu- lations
–
D = average genetic distance (Nei 1987)
The F-statistics were standardized according to the sample size (Bartolome et al. 2010).
Other components of total genetic diversity, in-cluding genetic diversity within individuals (GDWI), genetic diversity between individuals (GDBI), ge-netic diversity within subpopulations (GDWS), and genetic diversity between subpopulations (GDBS) were determined according to Caballero and Toro (2002).
The within-breed coancestry (fii) and the be-tween-breeds coancestry matrix (fij) were computed averaging all pairwise coancestry coefficients of the individuals belonging to a given breed i or to two different breeds i and j, respectively (Cabal-lero and Toro 2000).
Based on the above-mentioned methods, For-tran 90 software was developed to compute pa-rameters of inbreeding and genetic diversity. This programme is available upon request.
RESULTS
[image:4.595.65.532.597.698.2]The number of animals registered in the stud-books between 1960 and 1970 was similar for all breeds, being approximately 20 individuals per year. Between 1970 and 1993, annual registrations increased in the N and CMB breeds. In the SN breed, the number of animals registered peaked in 1997 and decreased thereafter. Between 2000 and 2013, approximately 100 individuals for the SN and CMB breeds and approximately 50 animals for the N breed were registered per year, of which approximately 45% of the animals were stallions and 55% of the animals were mares. The maximum number of registered stallions and mares occurred in 2010 (51) and 2008 (62) for the SN breed, 1994
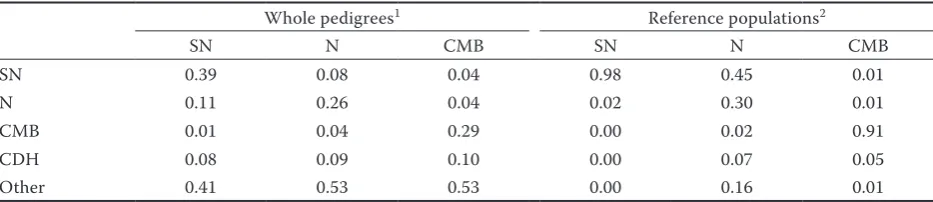
Table 1. Number of individuals acting as parents in the analyzed breeds
Whole pedigrees1 Reference populations2
SN N CMB SN N CMB
SN 0.39 0.08 0.04 0.98 0.45 0.01
N 0.11 0.26 0.04 0.02 0.30 0.01
CMB 0.01 0.04 0.29 0.00 0.02 0.91
CDH 0.08 0.09 0.10 0.00 0.07 0.05
Other 0.41 0.53 0.53 0.00 0.16 0.01
SN = Silesian Noriker, N = Noriker, CMB = Czech-Moravian Belgian, CDH = Czech Drought Horse (synthetic breed includ-ing all breeds – SN, N, and CMB – in one studbook)
1whole pedigrees included all animals in the dataset
466
(117) and 1987 (225) for the N breed, and 1998 (92) and 1993 (213) for the CMB breed (Figure 1).
Table 1 shows the number of individuals acting as parents in the breed studbooks analyzed. A total of 11% of individuals which acted as parents were N, 1% were CMB, 8% were CDH, and 41% of individuals came from other breeds in the SN studbook; a total of 8% of SN, 4% of CMB, 9% of CDH, and 53% of individuals from other breeds acted as parents in the N studbook; a total of 4% of SN, 4% of N, 10% of CDH, 53% of individuals from other breeds acted as parents in the CMB studbook.
The SN population was based on 1235 founders, while the CMB and N breeds had 2379 and 2583 founders, respectively. The effective number of founders (fe) markedly differed between breeds, with 69.49 in SN, 43.33 in CMB, and 98.48 in N. These values indicate variable genetic contribu-tions from the ancestors. The fe considerably dif-fered from the effective number of ancestors (fa) for all breeds, suggesting a past bottleneck event (generational reduction in effective population size). The importance of genetic drift was evalu-ated based on the ratio of fge to fe and the ratio of fa to fe. The value of each of these ratios was lower than 1 (Table 2). Particularly, the fge/fe ratio suggests that a significant genetic drift occurred at some point in the past for each of these breeds. The average equivalent of the known generations in the analyzed breeds was 8.91, 8.45, and 9.81 for the CMB, N, and SN breeds, respectively. Pedigree completeness levels were also consistent with the preceding values (Figure 2). The completeness level declined to less than 50% after 17, 15, and 14 genera-tions in the SN, CMB, and N breeds, respectively. Table 3 shows the cumulative marginal contri-butions of the most important ancestors. In the CMB breed, two ancestors could explain
approxi-0 50 100 150 200 250 300 350
19
60
19
63
19
66
19
69
19
72
19
75
19
78
19
81
19
84
19
87
19
90
19
93
19
96
19
99
20
02
20
05
20
08
20
11
N
um
ber
o
f re
gi
ste
re
d
an
im
al
s
Year of birth SN
[image:5.595.63.287.99.211.2]N CMB
Figure 1. Number of animals registered in the Studbook per year of birth of Silesian Noriker (SN), Noriker (N), and Czech-Moravian Belgian (CMB) draught horses
Table 2. Parameters characterizing the probability of gene origin, effective population size and parameters of inbreeding for Silesian Noriker (SN), Noriker (N), and Czech-Moravian Belgian (CMB) draught horses
SN N CMB
Number of animals 498 729 956
Total number of founders (f ) 1235 2379 2583 Effective number of founders (fe) 69.42 98.48 43.33
Effective number of ancestors (fa) 22.32 42.20 23.31 Founder genome equivalent (fge) 8.64 18.26 11.01 Effective number of founders/effective
number of ancestors ratio (fe/fa) 0.32 0.43 0.53 Founder genome equivalent/effective
number of founders ratio (fge/fe) 0.12 0.19 0.25 Realized effective population size (–) 95.21 195.07101.37 Average inbreeding coefficient (Fi) 0.046 0.020 0.040
Average relatedness coefficient (AR) 0.12 0.06 0.09 ΔF per generation 0.005 0.003 0.005
Loss of genetic diversity due to: unequal founder contribution and
random genetic drift 0.06 0.03 0.05 unequal founder contribution 0.01 0.01 0.02 random genetic drift 0.05 0.01 0.03
0.0 0.2 0.4 0.6 0.8 1.0
1 3 5 7 9 1113151719212325272931333537394143454749
Compl
et
en
es
s o
f p
ed
ig
re
e
(%
)
Number of generations
[image:5.595.305.530.100.203.2]SN N CMB
Figure 2. Completeness of pedigree information across generations for Silesian Noriker (SN), Noriker (N), and Czech-Moravian Belgian (CMB) draught horses
[image:5.595.305.530.485.757.2]467
original draught breeds. In the SN and N breeds, the majority of individuals were SN horses.
Figure 3 illustrates the average values for the in-breeding coefficient across years of birth. Only small differences were estimated between the birth years of 1960 and 1989. In the SN and N breeds, the average value of Fi ranged from 1 to 3%. In the CMB breed, this value increased between the birth years 1970 and 1982, when average values of Fi ranged from 3 to 5%. After 1990, the average value of Fi increased in the SN and CMB breeds, reaching close to 6% for individuals of both breeds born in 2013. In N, the average value of Fi was only 2–3% since 1990. The increase in Fi from the parent generation to the reference population was lower than 0.01 (Table 2). The average values of the AR (Table 3) in the
[image:6.595.64.532.125.320.2]refer-ence population were close to 0.10. The highest value was obtained for the SN breed, and the lowest was obtained for the N breed. The effective population size, derived from an increase in the inbreeding coefficient (Table 2), reached approximately 100 in-dividuals in the reference population of the SN and
Table 3. Marginal genetic contributions of the ten most influential ancestors of Silesian Noriker (SN), Noriker (N), and Czech-Moravian Belgian (CMB) draught horses
Breed
SN N CMB
ID sex year of birth con. (%) breed1 ID sex year of
birth con. (%) breed1 ID sex year of birth con. (%) breed1
10322 M 1963 10.9 31 443 F – 8.4 – 443 F – 14.1 –
10328 M 1948 9.7 31 10870 M 1952 5.1 33 9500 M 1945 10.3 80
443 F – 7.2 – 10311 M 1956 4.0 31 11682 F 1969 4.7 80
10870 M 1952 6.3 33 10328 M 1948 3.9 31 13825 M 1974 3.9 80
14731 M 1980 4.8 31 9859 F 1955 3.7 31 9953 F 1949 3.7 80
12294 M 1973 4.4 31 10832 M 1965 3.5 31 13828 M 1977 3.1 80
10324 M 1961 3.7 31 19332 M 1994 3.2 33 10429 M 1961 2.9 80
10311 M 1956 3.1 31 22019 M 1994 3.1 33 12731 F 1976 2.9 86
10389 M 1954 3.0 35 10322 M 1963 2.8 31 12849 F 1977 2.6 86
11440 M 1966 3.0 31 10869 M 1964 2.4 33 15656 M 1984 2.1 86
con. (%) = contribution, ID = identification number, M = male, F = female
1breeds: 31 = Silesian Noriker, 33 = Austrian Noriker, 35 = Noriker, 80 = Czech Drought Horse, 86 = Czech-Moravian Belgian
0 0.01 0.02 0.03 0.04 0.05 0.06 0.07
19
60
19
63
19
66
19
69
19
72
19
75
19
78
19
81
19
84
19
87
19
90
19
93
19
96
19
99
20
02
20
05
20
08
20
11
M
ea
n
in
br
ee
di
ng
c
oe
ffi
ci
en
t
Year of birth SN
N CMB
[image:6.595.309.530.501.687.2]Figure 3. Mean inbreeding coefficient across years of birth of Silesian Noriker (SN), Noriker (N), and Czech-Moravian Belgian (CMB) draught horses
Table 4. Parameters describing the metapopulation of Silesian Noriker, Noriker, and Czech-Moravian Belgian draught horses
Self-coancestry 0.517
Inbreeding 0.035
Average coancestry 0.042
Average genetic distance 0.044 Average coancestry over metapopulation 0.025
FIS –0.008
FST 0.018
FIT 0.010
GDT 0.975
GDWI 0.482
GDWS 0.957
GDBI 0.475
GDBS 0.017
FIS, FST, FIT = Wright’s fixation coefficients (Wright 1969),
GDT = total genetic diversity, GDWI = genetic diversity within individuals, GDWS = genetic diversity within subpopulations,
[image:6.595.69.289.590.719.2]468
CMB breeds. In the N breed, a two times higher effective population size was estimated than in the SN and CMB breeds. To determine the influence of pedigree, we graphically compared the amount of inbreeding and pedigree completeness obtained for the SN, N, and CMB breeds with the values obtained for other horse breeds (Figure 4). The regression line represents the mean Fi for the horse populations with adjustments made for pedigree quality. The SN, N, and CMB breeds were under the presented regression line.
The total amount of genetic diversity (GD) loss in the analyzed breeds during the last 53 years, due to various reasons, is shown in Figure 5. The average relative GD losses in the reference populations were 6, 3, and 5% for the SN, N, and CMB breeds, respec-tively. The loss of GD due to genetic drift accumu-lated over non-founder generations (GD* – GD) was more important than the loss resulting from the unequal contribution of founders in almost all breeds. As shown in Figure 5, a greater loss of genetic diversity was recorded between 1960 and 1980, and the loss of genetic diversity was observed in all breeds in the last year.
The overall difference between breeds expressed as the total value in the metapopulation (FST) indicates a low differentiation between breeds (Table 4). These values showed that differences between breeds accounted for only 2% of the total genetic variability expressed in the draught horse population of the studied breeds. The remaining
Lu L AN A SA L OKH SN N CMB 0 2 4 6 8 10 12 14
7 8 9 10 11 12 13 14 15 16
Av er ag e inb re ed in g
[image:7.595.306.530.95.433.2]Equivalent complete generations
Figure 4. Comparison between mean equivalent complete generations and mean inbreeding coefficients for Silesian Noriker (SN), Noriker (N), and Czech-Moravian Belgian (CMB) as well as for other horse populations (Andalusian (A) – Valera et al. 2005; Austrian Noriker (AN) – Druml et al. 2009; Spanish Arab (SA) – Cervantes et al. 2008; Lipizzaner (L) – Zechner et al. 2002; Pjontek et al. 2012; Lusitano (Lu) – Vicente et al. 2012; Old Kladruber Horse (OKH) – Vostra-Vydrova et al. 2016)
0 20 40 60 19 60 19 63 19 66 19 69 19 72 19 75 19 78 19 81 19 84 19 87 19 90 19 93 19 96 19 99 20 02 20 05 20 08 20 11 G en et ic d iv er sity lo ss (% )
Year of birth
[image:7.595.66.290.95.216.2]SN N CMB
Figure 5. Genetic diversity loss due to unequal founder
contribution and random genetic drift (A), unequal
founder contribution (B), and random genetic drift (C) in evaluated breeds
SN = Silesian Noriker, N = Noriker, CMB = Czech-Moravian Belgian 0 2 4 6 8 10 12 14 19 60 19 63 19 66 19 69 19 72 19 75 19 78 19 81 19 84 19 87 19 90 19 93 19 96 19 99 20 02 20 05 20 08 20 11 G en et ic d iv ers ity loss (% ) 0 10 20 30 40 50 60 19 60 19 63 19 66 19 69 19 72 19 75 19 78 19 81 19 84 19 87 19 90 19 93 19 96 19 99 20 02 20 05 20 08 20 11 G en et ic d iv er sit y los s ( % )
Year of birth
98% of the total genetic variability resulted from differences between individuals, regardless of the breed. The population differentiation in Czech draught horse breeds is represented by pairwise
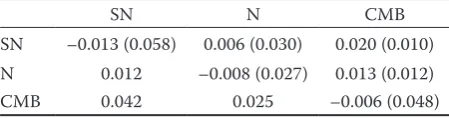
FST coefficients (Table 5). The pairwise FST coef-ficients ranged from 0.006 (between SN and N) to 0.019 (between the SN and CMB breeds). Thus, 0.6 to 1.9% of the genetic variability is explained by differences between populations, while the remaining variability is explained by variations within populations. GDWS and GDBSare consist-ent with these values, in that values of GDWS are significantly higher than those of GDBS (Table 4). The value of GDBS suggests that there is hardly any genetic diversity between groups. The negative values of FIS were estimated for all populations (Tables 4 and 5).
(A)
(B)
469
The standard Nei’s genetic distance values ranged from 0.01 between the SN and N breeds to 0.04 between the SN and CMB breeds (Table 5). The lowest Nei’s genetic distance and the highest ge-netic identity between the breeds were observed between the SN and N breeds. The coancestry assessed between the analyzed breeds varied be-tween 0.01 for the pair SN–CMB and 0.03 for the pair SN–N. These values indicate low genetic differences overall.
DISCUSSION
A basic assumption for the calculation of a large number of descriptive coefficients derived from the analysis of the pedigree data from a population is that founders are not related. This assumption is not met when the population is small and has been closed for a long time. A more realistic as-sumption might be that founders originated from diverse remote areas and/or that the number of founders was large (Nagy et al. 2010). Both of these conditions were fulfilled in the analyzed breeds because of regional diversity (western vs eastern part of the Czech Republic) and the long-term import of foreign stallions during the first half of the 20th century. The equivalent of completely
known generations of breeds in the present study was comparable with other horse populations: Lipizzaner – 15.2 and 10.25 (Zechner et al. 2002; Pjontek et al. 2012), Austrian Noriker –12.3 (Druml et al. 2009), Andalusian – 8.3 (Valera et al. 2005), Lusitano – 11.2 (Vincente et al. 2012), and Old Kladruber – 15 (Vostra-Vydrova et al. 2016).
The fe statistic is an important parameter used to assess if the contribution of the founders is balanced (Lacy 1989). If all founders contributed equally, then the effective number of founders would be equal to the total number of founders.
However, fe is typically lower than f because fe
reflects unequal contributions of founders to the current population as a result of selection and variations in family size. The fe and f values less than one indicate a loss of genetic diversity result-ing from unequal contributions of the founders. The advantage of some individuals is indicated as fa/fe and fge/fe ratios describing the extent of bottleneck and genetic drift, respectively (Boichard et al. 1997). The ratios calculated in the present analyses had higher or identical values compared with other reports, including the Austrian Nori- ker (Druml et al. 2009) – 0.25 and 0.09, Lusitano (Vincente et al. 2012) – 0.47 and 0.21, and Spanish Arabian horses (Cervantes et al. 2009) – 0.46–0.72 and 0.23–0.42. These values are markedly higher than those from other breeds included in the ge-netic resources of the Czech Republic, including Old Kladruber – 0.27 and 0.05 (Vostra-Vydrova et al. 2016). Rodriganez et al. (1998) reported that the substantial bottleneck and drift effects for swine populations resulted from a closed herd structure and a long evaluation period. The studbooks of the SN and CMB breeds were closed in 1996 and 1999, respectively.
The observed trend of Fi in the analyzed popu-lations corresponded well with their historical development. Until 1960, the breeds were recorded separately, and a low Fi value was maintained through the import of foreign Noriker stallions or mares into the SN and N populations and Belgian horses for breeding into the CMB population. In 1960, based on a political decision, all three breeds were merged under the unified name of Czech Draught Horse, and after that crossing among these animals was common. Such crosses promoted low
Fi values, even without the use of foreign stallions and mares. In 1989, the recognition and promotion of individual draught horse breeds was resumed, and cross breeding, particularly in the SN and CMB breeds, was eliminated. Since then, the Fi values in these breeds have increased. The influx of foreign genetic material has maintained the Fi value of the N breed at a low level. As shown in Figure 4, the inbreeding coefficients of all breeds reached a lower
[image:8.595.64.289.153.212.2]Fi value than the average inbreeding estimated from various populations of horses at equivalent completely known generations. In a subdivided population, the mating between some animals is more probable than with others. Thus, the average inbreeding coefficient of the next generation is
Table 5. The value of FIS with within-breeds coancestry (in brackets) on diagonal, the value of FST with between-breeds coancestry (in brackets), and genetic distances between subpopulations (Dij ‒ Nei 1987) below diagonal
SN N CMB
SN –0.013 (0.058) 0.006 (0.030) 0.020 (0.010) N 0.012 –0.008 (0.027) 0.013 (0.012)
CMB 0.042 0.025 –0.006 (0.048)
470
higher than the average coancestry of the previous generation. Some studies have demonstrated that the average coancestry is an adequate measure of genetic diversity because this factor accounts for both founder effects and genetic drift (Lacy 1995; Caballero and Toro 2000). Comparing the relationship between average coancestry and ge-netic diversity demonstrated that selection with the objective of minimizing coancestry in the next generation would maximize genetic diversity (Lacy 1995). Based on a comparison of the aver-age relatedness coefficients within breeds (AR), a decrease of genetic diversity in future generations is expected, particularly in the SN breed.
The average inbreeding values describe changes in the genetic structure of a population across time. When increasing, these values reflect the increased frequency of homozygous loci and the decreased frequency of loci with more than one allele, indicating a loss of genetic variability that might negatively influence fitness characteristics and increase the occurrence of phenotypic defects in subsequent generations. Therefore, the rate of inbreeding (ΔF) (Figure 6) is an important param-eter for genetic diversity monitoring. The Food and Agriculture Organization of the United Nations (FAO 1998) stated that the value of ΔF should not exceed 1%. It has been recommended that the Ne (derived from ΔF) of a population should be 50 or higher for the adequate conservation of genetic diversity (Meuwissen and Woolliams 1994; FAO 1998).
A reduced demand for horses to perform practi-cal work, due to the replacement of these animals with machinery, resulted in the merging of draught horses into one breed in 1960. This administrative
decision facilitated the use of stallions, regard-less of their breed, resulting in a decrease in the number of stallions needed for breeding, leading to both a bottleneck and increased variability in the number of matings per stallion. Genetic distances between breeds were also reduced. The values of pairwise FST and genetic distances were uncharacteristically low for genetically distinct breeds. The pairwise FST values suggested weak genetic isolation between these breeds of draught horses. The low pairwise FST values and genetic distances between breeds resulted from crossing between individuals of particular breeds from 1960 to 1990. However, stallions of the SN breed were used in the N breed populations without restrictions until 2011. Since 2011, the use of SN stallions in the N population has been minimal but has continued. The use of other stallions in the SN and CMB population is not permitted because the SN and CMB populations are now closed. Despite closing the SN and CMB populations, the numbers of sires of individuals belonging to the reference population were 2% of the N stallions in the SN population, 1% of the SN and N stallions in the CMB population, and 45% and 2% of the SN and CMB stallions in the N population (open population). These values indicate considerable gene flow between the SN and N breeds in the current population. The values of Nei’s distance are consistent with these conclusions. The gene flow between the analyzed populations was also confirmed by average coancestry value between the SN and N. The average genetic coancestry between the SN and N breeds exceeds the aver-age coancestry within the N breed. This implies a higher average similarity between two individuals in the SN and N breeds than between two indi-viduals in the N breed. This is in accordance with the already mentioned fact that a total of 45% of stallions used as parents were SN in the N stud-book (Table 1). Cervantes et al. (2009) showed that the within-breeds coancestry values and the between-breeds coancestry matrix are more informative on the mating policies and histories of the breeds. Note that coancestries are half the additive genetic relationships that are the percent-age of genes flow between two individuals or, as here, populations. Taking this into consideration, SN and N share 6% of genes, SN and CMB share 2% of genes, and 2.4% of genes are shared by N and CMB populations.
0.000 0.002 0.004 0.006 0.008 0.010 0.012 0.014
19
60
19
63
19
66
19
69
19
72
19
75
19
78
19
81
19
84
19
87
19
90
19
93
19
96
19
99
20
02
20
05
20
08
20
11
Δ
F
Year of birth
[image:9.595.66.289.572.695.2]SN N CMB
Figure 6. Rate of inbreeding (ΔF) per generation by the year of birth
471
The estimated pairwise FSTshowed a higher value than that between subpopulations of Cata-lan donkeys (2.89% – Gutierrez et al. 2005) or in a coloured variety of the Old Kladruber horse (5% – Vostra-Vydrova et al. 2016). The parameter
FIS is equivalent to the parameter alpha proposed by Caballero and Toro (2000), showing whether mating between relatives is avoided or not. In the analyzed subpopulations for the selection of the parents for the next generation, breeders followed strict avoidance of mating between close relatives.
In general, genetic diversity was reduced in ref-erence populations of draught horses. The rate of genetic diversity loss resulting from random genetic drift was higher than the rate caused by non-random founder contributions. Based on the rate of inbreeding (ΔF) (Figure 6) and loss of genetic diversity (Figure 5), this genetic drift was primarily generated through bottlenecks that occurred between 1960 and 1980, particularly for the CMB breed. However, in addition to the above-mentioned genetic drift and uneven founder contributions to inbreeding values in the popula-tion, the loss of genetic diversity was influenced by the breeding programme and related factors. Fernandez et al. (2005) stated that the loss of ge-netic diversity within breeds is influenced, to a large extent, by genetic drift, resulting in increased homozygosity and allele fixation in the popula-tion. Alvarez et al. (2008) reported that losses of genetic variability occurred soon after setting up the breeding programme, as a significant number of founders did not produce progeny in the next generation.
CONCLUSION
The preservation of biodiversity requires pro-found knowledge of the basic population param-eters and population structure. The results of the present study indicate a serious reduction in genetic diversity among the three Czech draught horse breeds examined, which is most evident from the progressive loss of genetic contributions from the founders and ancestors. Unequal contri-butions among founders play a major role in the loss of genetic diversity in all breeds, particularly in the SN breed. Random genetic drift also had a substantial impact on the loss of genetic diversity. The small genetic distances between the analyzed breeds were unexpected, likely reflecting the high
frequency of migration between breeds or genetic drift. These results showed that more appropri-ate breeding strappropri-ategies should be implemented to increase genetic differences between Czech draught horse breeds.
Acknowledgement. The authors would like to thank F. Goyache, Área de Genética y Reproduc-ción Animal, SERIDA-Deva, Spain,for valuable comments.
REFERENCES
Alvarez I., Royo L.J., Gutierrez J.P., Fernandez I., Arranz J.J., Goyache F. (2008): Relationship between genealogical and microsatellite information characterizing losses of genetic variability: empirical evidence from the rare Xalda sheep breed. Livestock Science, 115, 80–88.
Bartolome E., Goyache F., Molina A., Cervantes I., Valera M., Gutierrez J.P. (2010): Pedigree estimation of the (sub) population contribution to the total gene diversity: the horse coat colour case. Animal, 4, 867–875.
Boichard D., Maignel L., Verrier E. (1997): The value using probabilities of gene origin to measure genetic variability in a population. Genetics Selection Evolution, 29, 5–23. Caballero A., Toro M.A. (2000): Interrelations between
effective population size and other pedigree tools for the management of conserved populations. Genetical Research, 75, 331–343.
Caballero A., Toro M.A. (2002): Analysis of genetic diversity for the management of conserved subdivide populations. Conservation Genetics, 3, 289–299.
Cervantes I., Goyache F., Molina A., Valera M., Gutierrez J.P. (2008): Application of individual increase in inbreeding to estimate realized effective sizes from real pedigrees. Journal of Animal Breeding and Genetics, 125, 301–310. Cervantes I., Gutierrez J.P., Molina A., Goyache F., Valera M. (2009): Genealogical analyses in open populations: the case of three Arab-derived Spanish horse breeds. Journal of Animal Breeding and Genetics, 126, 335–347. Druml T., Baumung R., Solkner J. (2009): Pedigree analysis in
the Austrian Noriker draught horse: genetic diversity and the impact of breeding for coat colour on population struc-ture. Journal of Animal Breeding Genetics, 126, 348–356. Falconer D.S., Mackay T.F.C. (1996): Introduction into
Quantitative Genetics. Longman House, Harlow, UK. FAO (1998): Secondary guidelines for development of farm
animal genetic resources management plans. Manage-ment of small populations at risk. FAO, Rome, Italy. Fernandez J., Villanueva B., Pong-Wong R., Toro M.A.
472
marker information in conservation programs. Genetics, 170, 1313–1321.
Goyache F., Gutierrez J.P., Fernandez I., Gomez E., Alvarez I., Diez J., Royo L.J. (2003): Using pedigree information to monitor genetic variability of endangered populations: the Xalda sheep breed of Asturias as an example. Journal of Animal Breeding and Genetics, 120, 95–103.
Gutierrez J.P., Marmi J., Goyache F., Jordana J. (2005): Pedigree information reveals moderate to high levels of inbreeding and a weak population structure in the endangered Catalonian donkey breed. Journal of Animal Breeding and Genetics, 122, 378–386.
Gutierrez J.P., Cervantes I., Molina A., Valera M., Goyache F. (2008): Individual increase in inbreeding allows esti-mating effective size from pedigrees. Genetics Selection Evolution, 40, 359–378.
Hofmanova B., Pribanova M., Majzlik I., Vostry L., Vostra-Vydrova H. (2014): Population study of three breeds of cold blooded horses in the Czech Republic. In: Proc. 65th
Annu. Mtg., European Association for Animal Production (EAAP), Copenhagen, Denmark, 379.
James J.W. (1972): Computation of genetic contribution from pedigrees. Theoretical and Applied Genetics, 42, 272–273.
Lacy R.C. (1989): Analysis of founder representation in pedigrees: founder equivalents and founder genome equivalents. Zoo Biology, 8, 111–123.
Lacy R.C. (1995): Clarification of genetic terms and their use in the management of captive populations. Zoo Biol-ogy, 14, 565–578.
MacCluer J., Boyce B., Dyke L., Weitzkamp D., Pfenning A., Parsons C. (1983): Inbreeding and pedigree structure in Standardbred horses. Journal of Heredity, 74, 394–399. Maignel L., Boichard D., Verrier E. (1996): Genetic vari-ability of French dairy breeds estimated from pedigree information. Interbull Bulletin, 14, 49–54.
Meuwissen T.H.E., Woolliams J.A. (1994): Effective sizes of livestock populations to prevent a decline in fitness. Theoretical and Applied Genetics, 89, 1019–1026. Nagy I., Curik I., Radnai I., Cervantes I., Gyovai P.,
Bau-mung R., Farkas J., Szendro Z. (2010): Genetic diversity
and population structure of the synthetic Pannon White rabbit revealed by pedigree analyses. Journal of Animal Science, 88, 1267–1275.
Nei M. (1987): Molecular Evolutionary Genetics. Columbia University Press, New York, USA.
Pjontek J., Kadlecik O., Kasarda R., Horny M. (2012): Pedi-gree analysis in four Slovak endangered horse breeds. Czech Journal of Animal Science, 57, 54–64.
Rodriganez J., Toro M.A., Rodriguez M.C., Silio L. (1998): Effects of founder allele survival and inbreeding depres-sion on litter size in a closed line of Large White pigs. Animal Science, 67, 573–582.
Toro M.A., Fernandez J., Caballero A. (2009): Molecular characterization of breeds and its use in conservation. Livestock Science, 120, 174–195.
Valera M., Molina A., Gutierrez J.P., Gomez J., Goyache F. (2005): Pedigree analysis in the Andalusian horse: population structure, genetic variability and influence of the Carthusian strain. Livestock Production Science, 95, 57–66.
VanRaden P.M. (1992): Accounting for inbreeding and crossbreeding in genetic evaluation of large populations. Journal of Dairy Science, 75, 3136–3144.
Vicente A.A., Carolino N., Gama L.T. (2012): Genetic di-versity in the Lusitano horse breed assessed by pedigree analysis. Livestock Science, 148, 16–25.
Vostra-Vydrova H., Vostry L., Hofmanova B., Krupa E., Zavadilova L. (2016): Pedigree analysis of the endangered Old Kladruber horse population. Livestock Science, 185, 17–23.
Wright S. (1969): The Theory of Gene Frequencies: Evolu-tion and the Genetics of PopulaEvolu-tions, Vol. 2. Chicago University Press, Chicago, USA.
Zechner P., Zohman F., Solkner J., Bodi I., Habe F., Marti E., Brem G. (2002): Analysis of diversity and population structure in the Lipizzan horse breed based on pedigree information. Livestock Production Science, 77, 137–146.
Received: 2015–11–25 Accepted after corrections: 2016–06–25
Corresponding Author
doc. Ing. Luboš Vostrý, Ph.D., Czech University of Life Sciences Prague, Faculty of Agrobiology, Food and Natural Resources, Kamýcká 129, 165 21 Prague 6-Suchdol, Czech Republic


![catena Poly[[tetraaqua μ aqua bis(μ4 pyrimidine 2 carboxylato)tetralithium] dichloride]](data:image/gif;base64,R0lGODlhAQABAIAAAP///wAAACH5BAEAAAAALAAAAAABAAEAAAICRAEAOw==)