The phenomenon connecting most of the develop-ing countries is the fact that most of them formed the colonial system in past. This system consisted of colonies, semicolonies1, protectorates, dependent
countries and regions (ranis 2004).
namely for the classical colonies, there were typical two features of dependence on the colonial super-powers: economic and political. The economic feature was based on the shift of resources and revenues from the colonies to metropolises. The base of the political feature laid in the political rule of these
metropolises over colonies. Already in these times of colonialism, many of these countries were labelled as backward countries.
At present, there exist two parallel understandings of developing countries. The classical (older) under-standing issues from the socio-economic system of criteria2, while the new understanding is based on
a certain level of income per inhabitant3. The new
understanding then operates with only one indicator, but it degrades the whole problem of the developing countries differentiation to just the economic side.
Developing countries: trends, differentiation
Vladimír JENÍČEK
Faculty of International Relations, University of Economics, Prague,
Czech Republic
Abstract: Socio-economic backwardness is usually defined by common characteristics or classification. The differences between the DMEs and Dcs in the case of resources (prevalence of Dcs) and in the case of outputs and performance (pre-valence of DMEs) is evident. The difference in the economic level and the level of living between the Dcs and DMEs had deepened during the last three decades, however, it has to be pointed out again, that this difference is increasing still more slowly what can be a presage of an approaching turn (in the sense of the possible beginning of a slow decrease of this gap). While the per capita gDP indicator is regarded as one of the most important indicators of the economic level, the hDi can be regarded as the most important indicator of the given country population level of living and as such, it is hitherto rather underestimated. Similarly, the cPM indicator (as the measure of poverty), which is a composed indicator, has a higher testi-fying ability than a simple income level per capita in USD defined as the poverty level. it is obvious, that economic develop-ment is impossible without social developdevelop-ment, and vice versa. generally, the gap between the more developed developing countries, measured through the world income distribution, is then still widening. As a positive phenomenon, there can be, however, regarded the fact that deepening of this gap occurs at a lower rate. Through a more detailed analysis by the indi-vidual indicators, the most valuable from which are the indicators composed from several partial indicators (for example hDi, cPM), a certain tendencies towards the gradual improvement of the socio-economic situation in developing countries as a whole – but with the relevant differences in the individual regions of the world – can be discerned. in general, close ties have been proven between the economic growth and the growth of the population level of living, their mutual influencing and the main elements from which they are composed.
Key words: developing countries classification, differentiation, trends of development
Supported by Ministry of Education, Youth and Sport of the czech republic (Project no. MSM 6138439909).
1Semi-colonies differed from colonies namely by the fact that they were not politically fully submitted to metropolises
but were usually tied to them by the unequal treaties (china, Persia, Argentina etc.). This regarded mainly either bigger countries or the countries in the so-called “buffer” areas where the interests of the colonial powers clashed. By these treaties, the super-powers usually divided influence in these countries, which outwardly acted as independent
2including the existence of the so-called dual economy (the traditional natural and modern sector) and the considerable
remains of the colonial past, tribalism, illiteracy etc.
3At present, this is the base of the comparative analyses and statistical data of the World Bank and the international
According to the new understanding, the oil-produc-ing countries and other economies oriented just at a single, in a certain period very profitable product ensuring them a higher level of the per capita income, would disappear from the developing world. on the other hand, the transition economies are included into the developing countries group owing to the eco-nomic transformation with the connected ecoeco-nomic crisis, even if the level of their social development is higher compared to most of the classical develop-ing countries (Jeníček et al. 2010). it is not only for this reason, that it is more suitable to adopt for the purpose of this thesis the classical understanding of developing countries than just the simple division into the “rich” and “poor” countries.
CLASSIFICATION
Any single indicator, moreover such an often criti-cized one as gDP or gnP, cannot divide countries precisely among the developing and developed ones. Even for example the basic the problem, which level of gDP or gnP is the margin between being devel-oped or developing, does not add much weight to these indicators.
other classifications are based on other criteria, e.g. B.higgins compared the dynamics of the gnP growth to wealth and the level of resources utilisa-tion. often also socio-economic and political criteria are used. E.g. in the East, the developing countries of the socialist orientation were distinguished from the developing countries using the capitalist way of development. A very wide-spread division is the one according to the individual development regions, used e.g. by the U.n.o. A very detailed structur-ing is utilised also by the international Monetary Fund (iMF), namely for its analyses of the developing countries international indebtness. in defining the phenomenon of the socio-economic backwardness in many definitions and criteria systems, social pa-rameters prevail over the economic ones.4 Social
parameters usually regard human development and social infrastructure (education, health care, social care, housing etc.) (hardi et al. 1997).
At present, there already exists a whole series of very sophisticated indicators combining both the economic as well as the social side of development, so that they are able to differentiate the heterogene-ous complex called the developing world in a very detailed way.5
Human Development Index (HDI)
human Development index6 is at present the most
wide-spread tool for monitoring of the long-term trends of human development (Davies and Quinlivan 2006). it is a complex documenting the level of hu-man development. it evaluates the perforhu-mance the countries have reached in three basic dimensions of human development:
Long and healthy life
This represents the number of years the individual has a chance to live for in the given conditions (natural, economic and social) and with the given health care level. The numerical change of this indicator then ex-presses the qualitative change of these conditions.
Education
The education index is a combined index, which includes two phenomena:
– Level of literacy of the adult population (15+)7
– Level of school attendance8
Standard of living
The level of the standard of living is measured by the income per 1 inhabitant, represented by the per capita gDP per year in the purchasing power parity.
The hDi values move in the interval from 0 (mini-mum) to 1 (maxi(mini-mum). The value of the index states on which level of development the given country (region, group of population etc.) is found.9 For the
first time, the hDi was published in the human
4The systems and concepts of socio-economic backwardness were tackled by outstanding scientists like r. gill, r.
nurkse, h. Leibenstein, the nobel Prize winner g. Myrdahl and others.
5namely the indicators presented every year by the UnDP in the human Development report (hDi, hPi etc.) 6hDi was construed in 1990 by the former Pakistani minister of finances and an outstanding economist Mahbub ul
haq.
7Literacy is evaluated according to the fact whether the adult person is able to read and understand the text and to
write a simple essay on his/her life.
8Level of school attendance is an indicator comparing the number of children fulfilling the demand of school attendance
with the number of children really attending school at each of the three levels of education.
9As well as with the gDP values, the industrial revolution in the developed market economies has increased also the
Development report in 199010 and it has become a
very good alternative to the per capita gDP, which represents only one third in the frame of the hDi. The index is calculated every year for approximately 190 countries.11
At present, the hDi is utilised also as a tool of re-searching the living standard in past and of analysing the development from past to present. The oldest accessible data are connected to the 18 century, there-fore to the beginnings of the industrial revolution in Western Europe (crafts 2005).
The category of countries whose hDi is lower than 0.50012 includes 36 of the followed 192 countries.
More than 4/5 of them, in total 30, are situated in the Sub-Saharan Africa, by 2 in South Asia and South-West Asia and Pacific and by 1 each in the near East, Latin America and the caribbean.
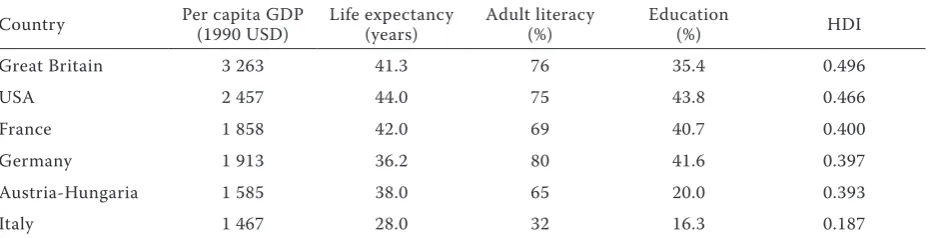
The hDi level in Western Europe and in the USA was in the second half of 19 century as follows: The highest values were reached by great Britain (0.496), what represents, according to the present measures, the low level of hDi comparable to the Sub-Saharan Africa states (Table 1).
in the frame of the human Development report (hDr) and the country comparison, the sequence of the countries is given according to the hDi value and the reached gDP per capita. The difference between the two values13 then shows the ability of the given
country to transform its economic wealth (measured by the per capita gDP) through the differentiation measures into the complex development of the society
(i.e. hDi). These calculations then present a further impulse to the gradual leaving of the per capita gDP as the basic differentiation tool.
The highest negative differences of both indicators are reached namely by the economies of the oil pro-ducing countries or other countries the economy of which is oriented on one or few profitable products, or where the living conditions deteriorated rapidly during a relatively short time (Botswana). on the opposite, positive values are reached namely by the so-called transition economies.
regional differences in the reached hDi are well discernible in bigger economies, e.g. in Brazil. While the hDi value in the north part of the country reaches 0.570 (the level of ghana or cambodia), the Southern part is approaching the level of 0.890 (similar to the level of Portugal).14
The hDi also points out the difference between the races; a typical example is South Africa. The separated white population reaches not only a high per capita gDP comparable to many developed countries, but also a high level of the hDi. on the contrary, the negro population is, with the hDi level of 0.500, on the level of cameroon, Togo or congo. Such profound differences can also be one of the reasons of the local civil disturbances (Jeníček et al. 2010).
CPM Index
[image:3.595.68.536.86.205.2]The capability Poverty Measure index (cPM) brings a different view of the socio-economic backwardness.
Table 1. hDi in the industrial countries in 1870
country Per capita gDP (1990 USD) Life expectancy (years) Adult literacy (%) Education (%) hDi
great Britain 3 263 41.3 76 35.4 0.496
USA 2 457 44.0 75 43.8 0.466
France 1 858 42.0 69 40.7 0.400
germany 1 913 36.2 80 41.6 0.397
Austria-hungaria 1 585 38.0 65 20.0 0.393
italy 1 467 28.0 32 16.3 0.187
Source: crafts (2005)
10The first calculations regarded the year 1987. At present, there exist also the ex post computed values for the past
periods (in some cases down to 1060 or even further). in the five-year periods, the values have been calculated ex post to the year 1975 and are published every year in the human Development report.
11During the last years, it is also often calculated for the individual regions, parts of the regions, different groups of
population or the backward regions.
12UnDP: human Development report 2006, pp. 283–286, and iMF: World Economic outlook 2006
13The largest differences were reached by: guinea (–103), Botswana (–67), South Africa (–66), gabon (–50), namibia
(–48), Saudi Arabia (–33), cuba (39) and Uzbekistan (45).
in difference to the hDi, it is aimed at three basic shortcomings (McKinley 2006):
– nutrition and health, expressed by the percentage of children up to 5 years suffering from malnutri-tion
– healthy reproduction represented by the percentage of births without a qualified assistance
– illiteracy of women expressed by the percentage of illiterate women and girls over 15 years
The arithmetic average reaches the values from 0 to 100. The lower the reached value, the lower the poverty level in the given country. This represents a supporting indicator of poverty, which is valuable as it considers the women deprivation and the develop-ment of families (Jeníček 2007).
At the end of the 90s, the indicator was computed for 101 developing countries and the cPM values dif-fered from 2.8 (chile) to 76.9 (Bangladesh). Similar as with the hDi, also the cPM then serves to the corrections of the sequence of countries according to the per capita gDP and for the evaluation of the economic growth effects and the economic level growth for the wider socio-economic environment in the given country.
however, the cPM has not reached a wider ap-plication and in 1997, it was replaced by the human Poverty index (Table 3).
HPI-1 and HPI-2 Indices
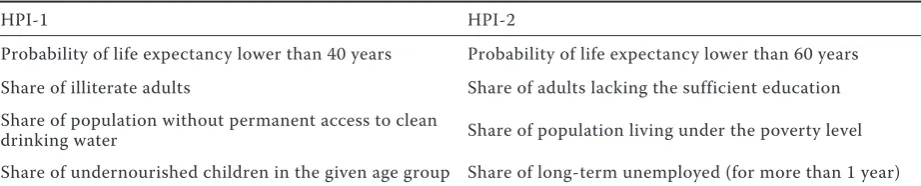
Another index operating with poverty, in contrast to the hDi, which uses the “success” of human devel-opment values, is the human Poverty index 1 and 2 (hPi-1 and hPi-2), which issue from the cPM idea and measure the level of human deprivation. For their computation, the data from the same areas as for the hDi are utilised, i.e. the life expectancy and quality, the education of the population and the standard of living. With regard to the enormous difference between the poverty definitions in the developed and developing countries, two indices are computed: the hPi-1 for developed economies, and hPi-2 for developing countries (Table 2).
The UnDP regards the hPi as an even more expres-sive indicator of the level of living of the individual countries than the hDi. Alas, the hPi-1 values do not present a sufficiently long time series, what is a very limiting factor for their utilisation in the statis-tical research of the 1975–2005 period (Srnec and Svobodová 2010).
DEVELOPING COUNTRIES DIFFERENTIATION
There are many ways how to differentiate devel-oping countries into groups, as well as the methods to utilise for it – from very simple up to the most sophisticated ones. The simple ones are using one or two basic criteria to classify countries into groups, what has been proved by many studies as insufficient (heston et al. 2006).
A chance to express in a more detailed way the socio-economic level of developing countries regards the more demanding methods, which cannot, how-ever, be utilised for this study. Five of the most usual methods for the developing countries differentiation are presented by the report of the Swedish Bureau for Agriculture, the Foreign relations branch, under the heading of the WTo (Marrewijk 2002).
GDP per capita
This method is utilised namely by the organisations like the World Bank, the UncTAD or the oEcD and it is the continuation of the countries differentiation used for the first time by Paul hoffman in 1960. countries are divided into several groups according to a simple criterion (in this case, the per capita gDP per year in USD) (Lucas 2004).
[image:4.595.67.528.84.177.2]The criterion is used as a basic tool for the dif-ferentiation of (developing) countries namely by the World Bank (WB). it is inclined to use rather the gross national Product (gnP) and it differentiates the countries into the following groups according to the reached values (WB 2006):
Table 2. Difference between the hPi-1 and the hPi-2 calculation
hPi-1 hPi-2
Probability of life expectancy lower than 40 years Probability of life expectancy lower than 60 years Share of illiterate adults Share of adults lacking the sufficient education Share of population without permanent access to clean
– Low income countries less than 875 USD (54 countries) – Lower middle income 876–3465 USD
countries (58 countries) – Upper middle income 3465–10 725 USD
countries (40 countries)
– high income countries 10 765 USD and more (56 countries)
owing to this approach, it is possible to divide countries very quickly and easily according to back-wardness into four groups by just one criterion. A great disadvantage of this approach is, however, namely its orientation on the purely economic side of development and also defining of the individual categories margins. For example, in the lower middle income group, we can find side by side the coun-tries like guatemala, Thailand, Swazi or Brazil, the socio-economic level of which is completely differ-ent (measured by the hDi). And if we consider the re-calculation of the gDP to the purchasing power parity (PPP), which considers the price relations in the individual countries, we get quite different results again.
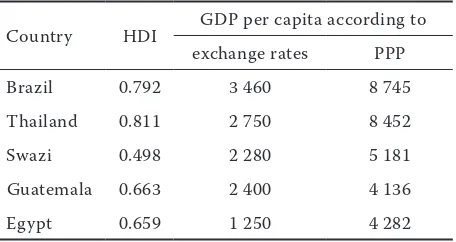
The re-calculation of the gDP according to PPP lets aside the real strength of the economy from e.g. the foreign trade and the methodologies of calculation are often very variable. however, for measuring of the standard of living, it is at present far better usable. To support this statement, we present the hDi and gDP values per capita, according to exchange rates as well as to the PPP (Table 3).
States like Brazil and Thailand with the hDi values around 0.800 belong, according to the WB, among poorer countries (countries with the lower middle income), but if we consider the values re-calculated by the purchasing power parity, they are immediately
differentiated from the countries like guatemala or Egypt, therefore, from the countries with a low level of the hDi. This proves that we have to consider the PPP re-calculation.
Net trade position
According to the FAo statistics, developing coun-tries can be divided according to the agrarian foreign trade balance into four categories:
– net Agricultural Exporters – net agricultural importers – net Food Exporters – net Food importers
The FAo statistics follow also the food self-suf-ficiency, the share of the agrarian sector and the agrarian foreign trade in the gDP or the re-calcula-tion of these values per 1 inhabitant etc.
These statistics give some evidence on the socio-economic situation of the followed countries, namely the data on the trade with food; however, with regard to the scope of this work, they are mentioned just for the complexity reasons (Jeníček 2008).
Common characteristics
The U.n.o. system defines several categories of developing countries according to the common cri-teria as follows:
– Least Developed countries – LDcs – Land-Locked Developing countries – Small islands Developing States – Transition Markets
– Low-income Food Deficit countries
The last mentioned group is closely connected to the income level of the countries. in 2005, the FAo stated that 82 countries from the whole world belong to this category, 72 of which are defined as developing. Practically, this category includes almost all Sub-Saharan Africa countries and a considerable part of the other sub-regions. The least participa-tion is shown by the Latin America and caribbean countries – only 4 from 33 countries.
[image:5.595.64.292.108.229.2]According to the FAo, including into this group of countries depends on one hand on the reached level of the gnP per 1 inhabitant, and that on the level of USD 1495 per year in the exchange rate, what is the first problem of this methodology with regard to the above mentioned reasons regarding the preference of the gDP values in the purchasing power parity. The further criterion is the food deficit expressed not in monetary units but in the balance of the calories “export and import” (Mc Kinley 2006).
Table 3. comparison of the per capita gDP according to the exchange rates and the purchasing power parity to hDi of the selected countries
country hDi gDP per capita according to exchange rates PPP
Brazil 0.792 3 460 8 745
Thailand 0.811 2 750 8 452
Swazi 0.498 2 280 5 181
guatemala 0.663 2 400 4 136
Egypt 0.659 1 250 4 282
Similarly, the group of countries labelled as the Least Developed countries, often mentioned in the literature, has the income per capita as one of the criteria which have to be fulfilled for a country to be included into this group. At present, there are 50 countries of this category in all sub-regions of developing countries. The criteria of evaluating a country as a least developed one can be divided into 3 groups:
(1) Per capita income of a certain level (at present, it is set at USD 750 per inhabitant per year in exchange rates). Again, the purchasing power parity is not regarded, but the WB methodology and its way of the gnP computation is considered.
(2) Shortcomings in the human resources devel-opment, including the nutrition values, health, education and literacy.
(3) Economic vulnerability of the country based on the shortcomings in agriculture, the export of goods and services, the importance of the non-tradi-tional activities, impacts of natural catastrophes on the population etc.
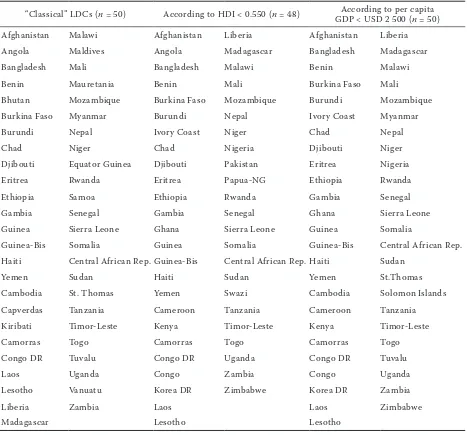
[image:6.595.66.533.318.753.2]The whole calculation method is very complex, but also very demanding for the data and information collection. Then, similar results could be reached by the substitution of these values by the gDP per capita in the purchasing power parity or by the hDi. As a suitable gDP per capita margin, there was set USD 2500, for the hDi then the margin of 0.550 (the level derived from the LDcs average values). in this way, it is possible to ascertain quite easily and quickly the least developed countries, and in the case of the hDi, also to define clearly under which
Table 4. The least developed countries
“classical” LDcs (n = 50) According to hDi < 0.550 (n = 48) gDP < USD 2 500 (According to per capita n = 50)
Afghanistan Malawi Afghanistan Liberia Afghanistan Liberia
Angola Maldives Angola Madagascar Bangladesh Madagascar
Bangladesh Mali Bangladesh Malawi Benin Malawi
Benin Mauretania Benin Mali Burkina Faso Mali
Bhutan Mozambique Burkina Faso Mozambique Burundi Mozambique
Burkina Faso Myanmar Burundi nepal ivory coast Myanmar
Burundi nepal ivory coast niger chad nepal
chad niger chad nigeria Djibouti niger
Djibouti Equator guinea Djibouti Pakistan Eritrea nigeria
Eritrea rwanda Eritrea Papua-ng Ethiopia rwanda
Ethiopia Samoa Ethiopia rwanda gambia Senegal
gambia Senegal gambia Senegal ghana Sierra Leone
guinea Sierra Leone ghana Sierra Leone guinea Somalia
guinea-Bis Somalia guinea Somalia guinea-Bis central African rep.
haiti central African rep. guinea-Bis central African rep. haiti Sudan
Yemen Sudan haiti Sudan Yemen St.Thomas
cambodia St. Thomas Yemen Swazi cambodia Solomon islands
capverdas Tanzania cameroon Tanzania cameroon Tanzania
Kiribati Timor-Leste Kenya Timor-Leste Kenya Timor-Leste
camorras Togo camorras Togo camorras Togo
congo Dr Tuvalu congo Dr Uganda congo Dr Tuvalu
Laos Uganda congo zambia congo Uganda
Lesotho Vanuatu Korea Dr zimbabwe Korea Dr zambia
Liberia zambia Laos Laos zimbabwe
Madagascar Lesotho Lesotho
conditions the country would not be regarded as the least developed one anymore.
The country would have to reach at least the gDP of USD 1 500 and to overcome the life expectancy level of 60 years, the adult literacy rate of 65% and the combined school attendance level of 45%. The overview of the least developed countries according to the classical computation and using the per capita gDP, resp. the hDi is given by the Table 4.
in total, all evaluation methods were in agreement in the least developed countries evaluation in 36 cases (marked in gray). in the cases we would have compared the hitherto used evaluation with the evaluation ac-cording to hDi only, the results would agree in 37 cases, what represents ¾ of all countries.
This analysis offers some conclusions. if we need, at a lack of data, to evaluate a country as a least devel-oped one, it is relevant to use the hDi indicator. The second conclusion is that the hDi is not as complex and including such a wide scale of indicators as the LDcs evaluation method. however, with regard to the wide scale of the necessary data, the hDi and the gDP are sufficient for evaluation.
Human development
The method used namely by the UnDP, which divides countries according to the hDi into three groups:
countries with a high hDi level 0.8–1.0 countries with a medium high hDi level 0.5–0.8 countries with a low hDi level 0.0–0.5
The hDi represents at present a very good tool for the socio-economic development of the countries level. notwithstanding its shortcomings, it is the most suitable indicator which can replace even the more demanding methods of the developing countries differentiation.
Geographic location
The U.n.o. differentiates developing countries also from the geographic viewpoint:
– Latin America and caribbean – Sub-Saharan Africa
– Arab countries – South Asia
– East Asia and Pacific
in the need of a deeper analysis, it is then necessary to look for countries which are not connected only by their geographic location, but also by a wider set of common features, e.g.:
– Least Developed countries – LDcs
– oil exporting countries – oPEc and non-oPEc – Muslim countries, christian countries
[image:7.595.67.526.462.756.2]– new industrialised countries
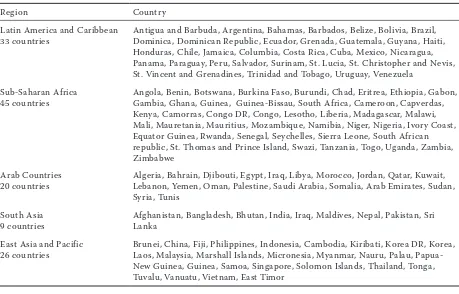
Table 5. geographic differentiation of developing countries according to the UnDP
region country
Latin America and caribbean
33 countries Antigua and Barbuda, Argentina, Bahamas, Barbados, Belize, Bolivia, Brazil, Dominica, Dominican republic, Ecuador, grenada, guatemala, guyana, haiti, honduras, chile, Jamaica, columbia, costa rica, cuba, Mexico, nicaragua, Panama, Paraguay, Peru, Salvador, Surinam, St. Lucia, St. christopher and nevis, St. Vincent and grenadines, Trinidad and Tobago, Uruguay, Venezuela
Sub-Saharan Africa
45 countries Angola, Benin, Botswana, Burkina Faso, Burundi, chad, Eritrea, Ethiopia, gabon, gambia, ghana, guinea, guinea-Bissau, South Africa, cameroon, capverdas, Kenya, camorras, congo Dr, congo, Lesotho, Liberia, Madagascar, Malawi, Mali, Mauretania, Mauritius, Mozambique, namibia, niger, nigeria, ivory coast, Equator guinea, rwanda, Senegal, Seychelles, Sierra Leone, South African republic, St. Thomas and Prince island, Swazi, Tanzania, Togo, Uganda, zambia, zimbabwe
Arab countries
20 countries Algeria, Bahrain, Djibouti, Egypt, iraq, Libya, Morocco, Jordan, Qatar, Kuwait, Lebanon, Yemen, oman, Palestine, Saudi Arabia, Somalia, Arab Emirates, Sudan, Syria, Tunis
South Asia
9 countries Afghanistan, Bangladesh, Bhutan, india, iraq, Maldives, nepal, Pakistan, Sri Lanka East Asia and Pacific
26 countries Brunei, china, Fiji, Philippines, indonesia, cambodia, Kiribati, Korea Dr, Korea, Laos, Malaysia, Marshall islands, Micronesia, Myanmar, nauru, Palau, Papua-new guinea, guinea, Samoa, Singapore, Solomon islands, Thailand, Tonga, Tuvalu, Vanuatu, Vietnam, East Timor
The UnDP divide the developing world from the geographic viewpoint into sub-regions. Their over-view, including the countries included into the indi-vidual sub-regions, is given by Table 5.
DEVELOPING COUNTRIES IN THE WORLD ECONOMY AT THE BEGINNING OF THE 21ST CENTURY
Since the 2nd half of the 20 century, when the
colo-nial empire of the European powers had become to dissolve definitely, developing countries became an independent segment of the world economy. Their share in the natural as well as human resources of the planet changed in time, as well as their share in the world economy.
Developing countries and the agricultural land fund utilisation
At the beginning of the 21st century, developing
countries are spread over the area of little less than one half of the Earth surface (38% without Antarctica). They farm on 62% of the total agricultural and 54% of arable land. in absolute numbers, this represents 77.9 million km2 of the Earth surface, 31 million km2
of agricultural and 7.6 million km2 of arable land.
compared to developed countries, their rate of agricultural and namely arable land per 1 inhabitant is very low. its values reach 0.64 ha of agricultural land, resp. 0.16 ha of arable land per 1 inhabitant, while in the developed countries; it is 1.40 ha of agricultural, resp. 0.47 ha of arable land. Moreover, developed economies reach, compared to the de-veloping countries, higher values of per hectare of agricultural, resp. arable land output.
Developing countries and world population
in developing countries, there live more than ¾ of the total world population (79.9% in 2005). Their total population amounts almost to 5.16 billion people, in that 2.3 billion of economically active population (76% of the world economically active population). The lowest number of people lives in the Arab coun-tries (less than 300 million), on the other hand the highest number of the population lives in South Asia (1.5 billion inhabitants), and namely in the East Asia and Pacific (almost 2 billion inhabitants, 1.4 billion of which live in one country – china).
Population density in developing countries amount-ed to 66.5 inhabitants per 1 km2 in 2005. it surpassed
the average population density of the whole planet,
which was 47.5 inhabitants per 1 km2 in the same year.
The highest population density was reached in the South Asia countries (252.5 inhabitants per 1 km2).
however, in reality the population cummulation is not evenly spread and many areas are facing a very high population density, while on the other hand, there exist also extensive areas which are practically not populated at all.
A very important feature of developing countries is the occurrence of several multi-million agglomera-tions. in these areas, population density reaches the values of almost 10 thousand inhabitants per 1 km2
or even more. Living conditions are often very bad there, however, in total they record very high values both of the per capita gDP and the hDi, and the absolute poverty, expressed by the percentage of people living on the income lower than 1 USD per day, belongs among the lowest in the whole country, what is the example of the Brazil Sao Paolo (Bujard and Shardin 2003). Also the gDP of the indian Delhi surpasses the national average by 55.6%. Worse results are reached by e.g. the province of West Bengali with the capital calcutta, which still reaches only 80% of the total indian hDi.
in this direction, the critical point seems to be the fact with what success these metropolises are able to reach economic growth and how efficiently they then transform it into the socio-economic development. it is still valid that the above mentioned values are the quantitative expression of development only and that they do not respect the considerable differences among the individual groups of population, what is proven e.g. by the still high number of people living in absolute poverty in Sao Paolo. As Bagulin states, absolute poverty regards 22% of people in this me-tropolis, what is under the Brazil national average. it represents, however, almost 4 million people living for less than 1 USD per day.
Developing countries and the economic potential
Also in this aspect, the level reached by developing countries is much differentiated. The highest values of the per capita gDP are reached by the regions of Latin America and caribbean (8187 USD) and the lowest by the Sub-Saharan Africa (2015 USD). individually then the highest level of per capita gDP is reached by the oil states of the Persian gulf (catar 29 607 USD, Arab Emirates 23 723 USD), guinea gulf (Equator guinea 23 154 USD) and the South-East Asia states (Singapore 28 228 USD, Taiwan 27 122 USD, and South Korea 22 543 USD).
in total, there are 49 countries with per capita gDP in purchasing power parity lower than 2500 USD. From them, the majority is in the Sub-Saharan Africa – 35. Seven such countries are found in South-East Asia and Pacific, 3 in South Asia and near South-East and 1 in Latin America and caribbean. in total, in these countries live 979 million inhabitants and they create in total 1364 billion USD of gDP. in percent-age, it represents 18.96%of the developing countries population, resp. 5.27% of their gDP. The number of the countries is almost equal to the Lest Developed countries, which is 50. With only slight differences, it regards the same countries, what brings about the following conclusions:
– The indicator of gDP in PPP at a certain level, in this case 2500 USD, can basically substitute the criteria of including a country among the LDcs – Economic level of the countries measured by per
capita gDP represents still a considerable share of the total development level of the country. For a better overview of the country efficiency, gDP is re-calculated per the economically active popula-tion. The aim is to remove the social backwardness of developing countries. into economically active population, we include only the population able to
work, what excludes the factors like the high share of population up to 15 years (demographic development of developing countries) and disabled population (bad health care) etc.
The share of economically active population in the total population is also fluctuating considerably. in the Arab countries, it reaches 37%, while in East Asia and Pacific already 54%. in the absolute values of gDP per economically active population, again the Latin America and caribbean reach the highest values of 16 850 USD and then near East with 12 780 USD. The Sub-Saharan Africa states reached the value of only 4300 USD. The weakest point of this re-calculation lays in the fact that it does not respect the real situa-tion in developing countries, where e.g. child labour is a common part of the economic life.
The highest share in the total volume of gDP is that of the two giant Asian economies, china and india, which in common produce almost 9 billion USD. important is also the share of the Latin America economies, Brazil, Mexico and Argentina with the total of approx. 3 billion USD.
The accelerated growth of the developing econo-mies compared to the developed ones contributed during the almost two decades, notwithstanding the inclusion of the transforming economies and the ex-clusion of the Anic, to the increase of this group of countries weight in the world economy. The change in the developing countries position is obvious both in the shares of the two big groups of countries in the world gDP as well as in the world export of goods and services (see Table 6).
[image:9.595.66.532.578.732.2]The share of developing countries in gDP, including the former centrally planned economies, reached in 2003, according to the data of Table 6, 55.5%, resp. 52.2% without the Anic, which amounted to 3.3%.
Table 6. World economy: gDP, export of goods and services and population in 2007 – developed and other forming market and developing economies (in %)
groups of countries gDP Export of goods and services Population
Developed economies 56.3 66.2 15.2
Anic 3.7 8.9 1.3
other forming market and developing economies 43.7 33.8 84.8
Africa 3.0 2.5 12.7
central and East Europe 4.0 4.6 2.8
Asia 20.1 13.3 52.9
Middle East 3.8 4.8 3.7
Western hemisphere 8.3 5.1 8.5
note: gDP in PPP
if the Anic are perceived as a part of the developing world, then the rate between the two main groups of the world economy changes from 55.5: 44.5 to 52.2: 47.8 in favour of developing countries. Such a result is positive for the “third world countries”, it is not, however, still sufficient for the creation of the prevailing 50+% share in the frame of the world economy.
Before outlining the main development tendencies in the world economy in the past period, it is useful to briefly outline the difference in measuring of the total as well as
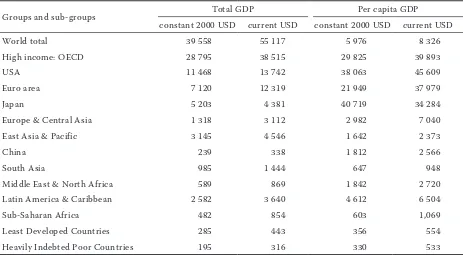
in Table 7, we can see the comparison of the gDP and the per capita gDP in both values for the individual groups, resp. for the world economy. The official market exchange rate does not in most economies, namely in the developing and transforming economies, express the purchasing power of income – the PPP. in the USA, where goods and services are paid for in USD, of course no difference between the official exchange rate and the PPP exists, as they are of the same value. Therefore, in the USA, the per capita gDP in both expressions is identical. Also in the EU, the differences between the per capita gDP in PPP and the market exchange rate are not considerable, regarding the free exchange between the Euro and the USD and the small differences in the prices of goods and services.
in Japan, the difference is already bigger, but in the opposite, rate compared to the transforming and developing economies. in Japan, the per capita gDP was 37.482 USD according to market exchange rate, but only 26.894 USD according to PPP. The reason of this difference lays in the higher prices of goods and services compared to the USA. regarding the rate between PPP and the official market exchange rate, it was lower than 1 in Japan in 2000 (0.954), while in the developed market economies, it slightly overreached 1 (1.008). in the USA, it of course was and is still equal 1, as the equality is the definition sign of both exchange rates.
The PPP exchange rate is, on the opposite, with only few exceptions several times higher in develop-ing countries than the official USD exchange rate. it issues namely from the demand for the USD, namely in some developing and transforming economies. in developing countries as a whole, this coefficient is 2.8444. it was relatively low in West Asia (2.025), in Latin America it amounted to 2.060, in South and East Asia to 2.847, in Africa 3.024 and in china it amounted to the top v value of 4.847. For comparison, in transforming economies as a whole it was in the same period 3.658.
[image:10.595.67.530.96.351.2]it is necessary to add one more note to the compu-tation of gDP or any similar aggregate indicator in PPP or official market exchange rate. it is necessary Table 7. World economies and country groupings 2007 – gDP (in bill. USD) and per capita gDP (in USD) according to the constant 2000 USD and current USD
groups and sub-groups Total gDP Per capita gDP
constant 2000 USD current USD constant 2000 USD current USD
World total 39 558 55 117 5 976 8 326
high income: oEcD 28 795 38 515 29 825 39 893
USA 11 468 13 742 38 063 45 609
Euro area 7 120 12 319 21 949 37 979
Japan 5 203 4 381 40 719 34 284
Europe & central Asia 1 318 3 112 2 982 7 040
East Asia & Pacific 3 145 4 546 1 642 2 373
china 239 338 1 812 2 566
South Asia 985 1 444 647 948
Middle East & north Africa 589 869 1 842 2 720
Latin America & caribbean 2 582 3 640 4 612 6 504
Sub-Saharan Africa 482 854 603 1,069
Least Developed countries 285 443 356 554
heavily indebted Poor countries 195 316 330 533
to consider that the world economy growths more quickly if the data are expressed in PPP. it is supposed to be because the developing countries as a whole grew more quickly than the rest of the world in the 90s of the 20 century and the first years of the 21 century. The share of developing and transforming economies in the world gDP is higher when measured in PPP than in the market exchange rate. This is valid not only for developing countries as a whole, but namely for china which reached by far the highest growth rates in the period mentioned.
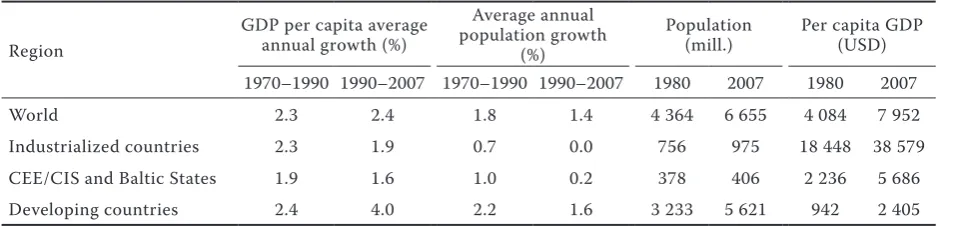
The dynamics of the gDP presented in Table 8 considers also the changes in the growth dynam-ics and numbers of the population. The data are in PPP, what slightly advantages developing countries. This advantage is not that important that it would distort the reached results in any considerable way, as the differences in the growth rates are only in the tenths of per cent.
At the slowing down, but in absolute numbers quickly growing number of inhabitants, the gDP per capita growth rate was 1.3% in the average of world economy in the 80s and 1.8% in the following period (1991–2003).
The acceleration of economic growth recalculated per capita can be regarded as a positive feature of the world economy development in the mentioned period.
The main contribution in this development was that of developing countries. This group of coun-tries accelerated the average gDP from 3.4% in the 80s to 5% in the following period and at the same time slowed down population growth from 2.1% to 1.6% per year. The gDP per capita growth rate has therefore increased in them at the same time from 1.3% to 3.4%. Such an increase of the per capita gDP growth rate is probably the best average result reached by developing countries since the end of the classical colonialism. Both remaining main groups
of the world economy – developed market econo-mies and transforming econoecono-mies – did not reach such results. The developed economies gDP growth slowed down from 3% in the 80s to 2.3% in the fol-lowing period with the population growth of 0.6% in the whole period. Their per capita gDP growth has then slowed down, and that from 2.4% to 1.7% in the yearly average. The worst results were in this comparison reached by transforming economies. in the 80s, they recorded a very slow growth of 1.9% per year. With the population increase by 0.7% per year, their average gDP growth rate was only 1.2% per year. in the consequence of the transformation crisis, the gDP fell down into red numbers of –0.9% and to the stagnation, resp. zero population growth in the following period, so that the per capita gDP decreased by 0.0% per year. This was the worst and longest decrease of this group of countries in the whole post-war period.
Developing countries and human development level
[image:11.595.63.540.96.209.2]According to the hDi values re-calculated to the in-terval of 0–1, developing countries are reaching 71.2% of the oEcD countries (which represent developed countries) level. This is a by far higher value than in the per capita gDP case, which represents mere 14.9% in this comparison (UnDP 2007). however, the differences e.g. in the life expectancy or higher education are still enormous, and that notwithstand-ing the world-wide efforts to increase the literacy level in developing countries. Life expectancy in these countries represents only 82.4% of the oEcD countries level and the value of literacy is still lower – 79%. The most problematic region in this aspect is without doubt the Sub-Saharan Africa, where the life expectancy is still on the level of the 70s of the 20 century and literacy increased only by 13% from Table 8. World economy: main groups of countries and the developing countries regions – growth of the total and per capita gDP (in %, mill. and USD) in the years 1970–2007
region
gDP per capita average annual growth (%)
Average annual population growth
(%)
Population
(mill.) Per capita gDP (USD) 1970–1990 1990–2007 1970–1990 1990–2007 1980 2007 1980 2007
World 2.3 2.4 1.8 1.4 4 364 6 655 4 084 7 952
industrialized countries 2.3 1.9 0.7 0.0 756 975 18 448 38 579
cEE/ciS and Baltic States 1.9 1.6 1.0 0.2 378 406 2 236 5 686
Developing countries 2.4 4.0 2.2 1.6 3 233 5 621 942 2 405
55.5 to 68.3% , what are values lower than those com-mon for the LDcs. compared to the oEcD countries, the Sub-Saharan Africa reaches only 58.5% of the life expectancy level and 63.4% of the literacy level (UnDP 2007).
Life expectancy in some Sub-Saharan Africa coun-tries is even decreasing owing to the spreading of the hiV/AiDS. in this region, one tenth of the population is suffering from this disease according to estimates, while in some countries like Swazi, Botswana or South Africa; this number might be even threefold (U.n.). People not suffering from the hiV/AiDS live up to 66 or even more years in these countries, which in this connection also certifies on the insufficient education and information access for most of this sub-region population, and also on the unequal ac-cess to education for men and women.
The highest hDi values in the developing world are reached by the sub-regions of Latin America and caribbean (0.770) and the near East (0.728), on the contrary, the Sub-Saharan Africa countries as a whole reach only the value of 0.477, i.e. less that the great Britain 150 years ago. The level of 0.700 is overreached also by the East Asia and Pacific (0.716). The South Asia hDi represents the value 0.609 and the value of china as the specific sub-region is 0.782, which is the highest among the developing sub-regions of the world.
however, we can find among the developing coun-tries also such the hDi of which surpasses the 0.800 level. These countries succeeded in transforming their economic growth also into the social sphere and thus improved the length as well as quality of their inhabitants’ life. These states can be found almost in every sub- region of developing countries, i.e. they do not form any complex from the geographic viewpoint.
The human Development report from 2006 registers in total 25 developing countries the hDi value, which is higher than 0.800. From them, 12 are found in the Latin America and caribbean (Barbados, Argentina, chile, Uruguay, costa rica, cuba, St. christopher and nevis, Bahamas, Mexico, Trinidad and Tobago, Panama, Antigua and Barbuda), 6 in the near East (israel, Kuwait, Bahrain, catar, Arab Emirates, oman), 5 in South-East Asia and pacific (Singapore, Korea, Brunei, Tonga, Malaysia) and 2 in Sub-Saharan Africa (Mauritius and Seychelles). The only sub-region which has no participation in this category is South Asia. regarding the oil producing countries which reached these values, it is necessary to evaluate their effort to invest the incomes from oil also into the human potential development (improvement and prolonga-tion of life, increasing literacy) (Vošta 2010).
CONCLUSIONS
World economy entered a new etap of its develop-ment at the beginning of the 21st century. one of the
important characteristic features of this etap was the dominance of the market relationships. They pre-vailed, on one hand, in the former centrally planned economies, on the other hand, also in the existing developing economies in consequence of the market-oriented reforms. notwithstanding the fact whether developing economies are understood in a wider or a more narrow understanding, what means as a bigger or smaller part of the world economy, together with the transforming economies (according to the iMF) or separately (according to the Uno), they recorded a relatively high, even if regionally not balanced, growth dynamic during the last approx. 20 years.
A relatively quick economic growth of developing countries since the beginning of the 90s brought about also important structural changes in their economies. in most developing countries, there is still going on the industrialisation process followed namely by the growth of the processing industry. The most dynamic sector in developing countries, similar to the developed countries, has become the sector of services. however, its structure still kept its specifics from the previous period and its quantitative as well as qualitative characteristics still did not in most cases approach the service sector structure in the developed countries. The most accelerated development could be seen in the commercial and state administration services, much less in the social services.
The unique position in the developing world frame and their still growing importance in the world econ-omy were reached namely owing to their economic size, a specific structural development and the reached economic development growth rates. This is namely true of china, which is one of the quickest and for the longest period growing economy of the world. The increasing importance of china in the world economy, as well as the increasing importance of developing economies, evoke a whole series of questions and discussions regarding the future development. it can be stated, that there are many reasons for following the developing countries development in the frame of the world economy and that together with the analy-sis of the developing countries position in the world economy, it is also necessary to analyse the different regional development in the developing world.
– even if the gDP growth rate, resp. the per capita gDP showed rather positive values for the develop-ing world (namely in the 90s), it was namely the East Asia sub-region, which increased these over-average values. other sub-regions lagged behind after the average values. This phenomenon can be evaluated as positive, as namely the gDP per capita increased in the last period in all the followed sub-regions (in difference from the previous decades).
obvious is, from the input and output indicators, the dominant position of Asia among the develop-ing regions, from the global efficiency viewpoint; however, Latin America sustains its priority. it is caused namely by the excessive human potential Asia disposes of. The macroeconomic indicators analysis hinted at a certain improvement of the mac-roeconomic stability in Latin America, however, it revealed the inconsistency in the economic policies of the individual countries, which is, among other, reflected in the worsening social situation of their inhabitants. Africa is still the most backward region of the developing world, however, reaching posi-tive values of the per capita gDP growth rates, after several decades of stagnation, and also improving other macroeconomic indicators. Asia represents a very heterogeneous region, in which the deepening economic differentiation is the most manifested. in general, it is valid that the gDP growth rates reached by some courtiers (china, Anic of the first as well as second generation, Brasilia, india) are admirable. on the other hand, the financial and economic crises indicated the sustained dependence of the world economies on the external environment what in future might negatively impact not only their development, but the development of the whole world economy.
REFERENCES
Barke M., o’hare g. (1991): The Third World. oliver & Boyd, London.
Bujard h., Shradin h. (2003): Managing Economic crises and natural Disasters in the Third World countries. University of cologne. cologne.
crafts n.F.r. (2005): Development history. London School of Economics. London.
Davies A., Quinlivan g.n. (2006): A panel data analysis of the impact of trade on human development. The Journal of Socio-Economics, 35: 868–876.
hardi B., Barg S., hodge T., Pinter L. (2007): Measuring Sustainable Development: review of current Practice. international institute for Sustainable Development. occasional Paper 17. canada.
heston A., Summers r., Aten B. (2006): Pen World Table Version 6.1, 6.2. centre for international comparisons, University of Pennsylvania (cicUS).
iMF (2006). World Economic outlook 2006. WB-World Development indicators, n.Y.
Jeníček V. (2007): Development Economics. cULS, Prague.
Jeníček V. (2008): Foreign Trade and Development Eco-nomics, cULS, Prague.
Jeníček V. et al. (2010): global Problems of the World. c. h. Beck, Prague.
Lucas r.E. (2004): Lectures on Economic growth. harvard University Press, cambridge and London.
Marrewijk c. (2002): international Trade and the World Economy. Erasmus University of rotterdam. rotter-dam.
Mc Kinley T. (2006): What is Poverty? good Question. one Pager, no. 26, international Poverty center (icP), UnDP.
ranis g. (2004): human Development and Economic growth. centre Discussion Paper no. 88, Economic growth centre, Yale University. new haven.
Srnec K., Svobodová E. (2009): Microfinance in less-de-veloped countries: history, progress, present-char-ity or business? Agricultural Economics – czech, 55: 467–474.
UnDP (2006). human Development report. n.Y. Un (2004). World Economic and Social Survey. n.Y. Vošta M. (2010): Transformations in the World Economy
Allocation. oeconomica, Prague.
Arrived on 21st June 2010
Contact address: