rac
-3,3,3-Trifluorolactic acid
Thomas Gerber and Richard Betz*
Nelson Mandela Metropolitan University, Summerstrand Campus, Department of Chemistry, University Way, Summerstrand, PO Box 77000, Port Elizabeth, 6031, South Africa
Correspondence e-mail: [email protected] Received 29 January 2013; accepted 30 January 2013
Key indicators: single-crystal X-ray study;T= 200 K; mean(C–C) = 0.002 A˚;
Rfactor = 0.031;wRfactor = 0.081; data-to-parameter ratio = 16.0.
The title compound (systematic name: rac -3,3,3-trifluoro-2-hydroxypropanoic acid), C3H3F3O3, is a fluorinated derivative
of lactic acid. The O C—C—O(H) torsion angle is 13.26 (15). In the crystal, O—H O hydrogen bonds and C—H O contacts connect the molecules into sheets perpendicular to thecaxis.
Related literature
For the crystal structure of 2-hydroxy-2-(trifluoromethyl)-proprionic acid, see: Soloshonoket al.(2007). For background to chelate ligands, see: Gade (1998). For graph-set analysis of hydrogen bonds, see: Etteret al.(1990); Bernsteinet al.(1995).
Experimental
Crystal data
C3H3F3O3
Mr= 144.05 Orthorhombic,Pbca a= 10.586 (3) A˚
b= 9.248 (3) A˚
c= 10.826 (3) A˚
V= 1059.9 (5) A˚3
Z= 8
MoKradiation
= 0.22 mm1
T= 200 K
0.400.300.25 mm
Bruker APEXII CCD diffractometer
Absorption correction: multi-scan (SADABS; Bruker, 2008)
Tmin= 0.892,Tmax= 1.000
9450 measured reflections 1309 independent reflections 1133 reflections withI> 2(I)
Rint= 0.017
Refinement
R[F2> 2(F2)] = 0.031
wR(F2) = 0.081
S= 1.06 1309 reflections
82 parameters
H-atom parameters constrained
max= 0.31 e A˚
3
min=0.19 e A˚
3
Table 1
Hydrogen-bond geometry (A˚ ,).
D—H A D—H H A D A D—H A
O3—H12 O2i 0.84 2.03 2.7459 (13) 143
O1—H111 O3ii
0.84 1.80 2.6381 (13) 172
C2—H12A O1iii
1.00 2.60 3.4588 (16) 144
Symmetry codes: (i) x;yþ1;zþ1; (ii) x1 2;yþ
1
2;zþ1; (iii)
x;y;zþ1.
Data collection:APEX2(Bruker, 2010); cell refinement:SAINT (Bruker, 2010); data reduction:SAINT; program(s) used to solve structure:SHELXS97(Sheldrick, 2008); program(s) used to refine structure: SHELXL97 (Sheldrick, 2008); molecular graphics: ORTEP-3 for Windows(Farrugia, 2012) andMercury(Macraeet al., 2008); software used to prepare material for publication:SHELXL97 andPLATON(Spek, 2009).
The authors thank Mr Ulf Breddemann of McMaster University, Canada, for helpful discussions.
Supplementary data and figures for this paper are available from the IUCr electronic archives (Reference: ZL2532).
References
Bernstein, J., Davis, R. E., Shimoni, L. & Chang, N.-L. (1995).Angew. Chem. Int. Ed. Engl.34, 1555–1573.
Bruker (2008).SADABS. Bruker AXS Inc., Madison, Wisconsin, USA. Bruker (2010).APEX2andSAINT. Bruker AXS Inc., Madison, USA. Etter, M. C., MacDonald, J. C. & Bernstein, J. (1990).Acta Cryst.B46, 256–262. Farrugia, L. J. (2012).J. Appl. Cryst.45, 849–854.
Gade, L. H. (1998).Koordinationschemie, 1. Auflage, Weinheim: Wiley-VCH. Macrae, C. F., Bruno, I. J., Chisholm, J. A., Edgington, P. R., McCabe, P., Pidcock, E., Rodriguez-Monge, L., Taylor, R., van de Streek, J. & Wood, P. A. (2008).J. Appl. Cryst.41, 466–470.
Sheldrick, G. M. (2008).Acta Cryst.A64, 112–122.
Soloshonok, V. A., Ueki, H., Yasumoto, M., Mekala, S., Hirschi, J. S. & Singleton, D. A. (2007).J. Am. Chem. Soc.129, 12112–12113.
Spek, A. L. (2009).Acta Cryst.D65, 148–155.
Structure Reports
Online
supporting information
supporting information
Acta Cryst. (2013). E69, o336 [doi:10.1107/S1600536813003097]
rac
-3,3,3-Trifluorolactic acid
Thomas Gerber and Richard Betz
S1. Comment
Chelate ligands have found widespread use in coordination chemistry due to the increased stability of coordination
compounds they can form in comparison to monodentate ligands (Gade, 1998). Hydroxycarboxylic acids are particularily
interesting in this aspect as they offer two hydroxyl groups of markedly different acidity as potential bonding partners.
Upon varying the substitution pattern on the hydrocarbon backbone, the acidity of the respective hydroxyl groups can be
finetuned over a wide range and they may, thus, serve as probes for establishing the rules in which pKa range
coordination to various central atoms can be observed. To allow for comparisons of metrical parameters of the
carboxy-lic-acid-derived ligand in envisioned coordination compounds, the crystal and molecular structure of 3,3,3-trifluorolactic
acid as the free ligand was determined. The crystal structure of a related compound,
2-hydroxy-2-(trifluoromethyl)-proprionic acid, is apparent in the literature (Soloshonok et al., 2007).
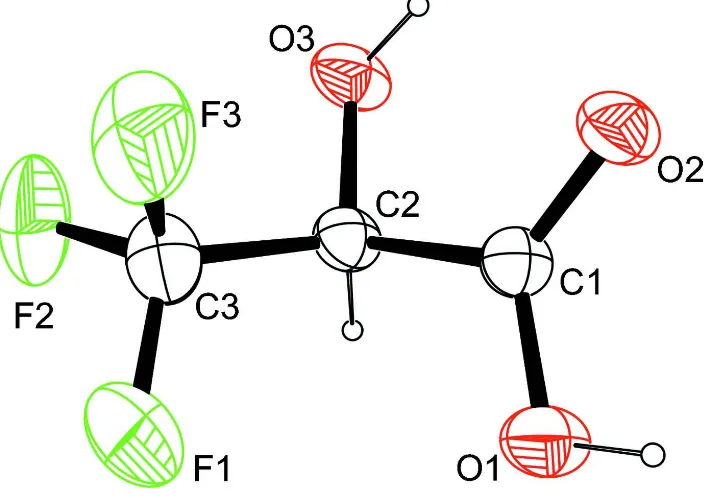
The carboxyl group is nearly in plane with the C–OH moiety. The respective O═C–C–O(H) dihedral angle was found at
13.26 (15) ° only (Fig. 1).
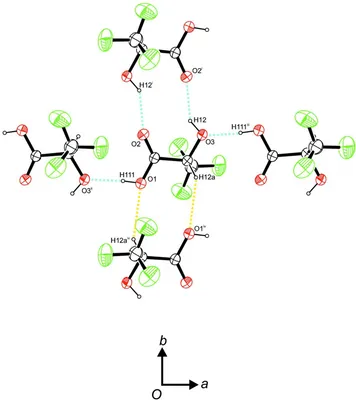
In the crystal, intra- as well as intermolecular hydrogen bonds are apparent. The former ones appear between the
alcoholic hydroxyl group as donor and the ketonic oxygen atom as acceptor and, therefore, might be the cause for the
small dihedral angle discussed above. The intermolecular hydrogen bonds are supported by the carboxyl group as donor
and the alcoholic hydroxyl group as acceptor. In addition, C–H···O contacts whose range falls by more than 0.1 Å below
the sum of van-der-Waals radii of the corresponding atoms can be observed. These stem from the hydrogen atom of the
methine group and apply the oxygen atom of the carboxylic hydroxyl group as acceptor. Metrical parameters as well as
information about the symmetry of these hydrogen bonds is summarized in Table 1. In terms of graph-set analysis (Etter
et al., 1990; Bernstein et al., 1995), the descriptors for the hydrogen bonds are C1
1(5) and R22(10) on the unary level while
the C–H···O contacts necessitate a R2
2(8) descriptor on the same level. In total, the intermolecular interactions connect the
molecules to planes perpendicular to the crystallographic c axis (Fig. 2).
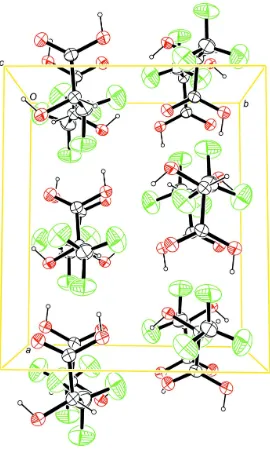
The packing of the title compound in the crystal structure is shown in Figure 3.
S2. Experimental
The compound was obtained from Alfa Aesar. Crystals suitable for the diffraction study were taken directly from the
provided product.
S3. Refinement
The carbon-bound H atom of the methine group was placed in a calculated position (C–H 1.00 Å) and was included in
the refinement in the riding model approximation, with U(H) set to 1.2Ueq(C). The H atoms of the hydroxyl groups were
allowed to rotate with a fixed angle around the C–O bond to best fit the experimental electron density (HFIX 147 in the
Figure 1
The molecular structure of the title compound, with atom labels and anisotropic displacement ellipsoids (drawn at 50%
supporting information
Figure 2
Intermolecular contacts, viewed along [0 0 - 1]. Blue dashed lines indicate hydrogen bonds, yellow dashed lines indicate
C–H···O contacts. Symmetry operators: i -x, -y + 1, -z + 1; iix - 1/2, -y + 1/2, -z + 1; iiix + 1/2, -y + 1/2, -z + 1; iv -x, -y, -z +
Figure 3
Molecular packing of the title compound, viewed along [0 0 - 1] (anisotropic displacement ellipsoids drawn at 50%
probability level).
rac-3,3,3-Trifluoro-2-hydroxypropanoic acid
Crystal data
C3H3F3O3 Mr = 144.05
Orthorhombic, Pbca
Hall symbol: -P 2ac 2ab
a = 10.586 (3) Å
b = 9.248 (3) Å
c = 10.826 (3) Å
V = 1059.9 (5) Å3 Z = 8
F(000) = 576
Dx = 1.806 Mg m−3
Mo Kα radiation, λ = 0.71073 Å Cell parameters from 4117 reflections
θ = 3.5–28.2°
µ = 0.22 mm−1 T = 200 K
supporting information
Data collection
Bruker APEXII CCD diffractometer
Radiation source: fine-focus sealed tube Graphite monochromator
φ and ω scans
Absorption correction: multi-scan (SADABS; Bruker, 2008)
Tmin = 0.892, Tmax = 1.000
9450 measured reflections 1309 independent reflections 1133 reflections with I > 2σ(I)
Rint = 0.017
θmax = 28.3°, θmin = 3.5°
h = −14→10
k = −12→12
l = −14→14
Refinement
Refinement on F2
Least-squares matrix: full
R[F2 > 2σ(F2)] = 0.031 wR(F2) = 0.081 S = 1.06 1309 reflections 82 parameters 0 restraints
Primary atom site location: structure-invariant direct methods
Secondary atom site location: difference Fourier map
Hydrogen site location: inferred from neighbouring sites
H-atom parameters constrained
w = 1/[σ2(Fo2) + (0.0349P)2 + 0.3452P]
where P = (Fo2 + 2Fc2)/3
(Δ/σ)max < 0.001
Δρmax = 0.31 e Å−3
Δρmin = −0.19 e Å−3
Fractional atomic coordinates and isotropic or equivalent isotropic displacement parameters (Å2)
x y z Uiso*/Ueq
F1 0.07491 (11) 0.07334 (11) 0.26362 (9) 0.0698 (3)
F2 0.24046 (9) 0.20543 (13) 0.26938 (9) 0.0670 (3)
F3 0.06121 (11) 0.29936 (12) 0.22550 (8) 0.0661 (3)
O3 0.16058 (7) 0.35907 (8) 0.46617 (9) 0.0346 (2)
H12 0.1084 0.4270 0.4731 0.052*
O1 −0.10270 (7) 0.12077 (8) 0.45966 (9) 0.0361 (2)
H111 −0.1790 0.1327 0.4782 0.054*
O2 −0.09203 (7) 0.35985 (8) 0.48706 (9) 0.0348 (2)
C1 −0.04410 (10) 0.24515 (11) 0.46318 (10) 0.0256 (2)
C2 0.09691 (10) 0.23181 (11) 0.43390 (10) 0.0260 (2)
H12A 0.1328 0.1499 0.4829 0.031*
C3 0.11835 (13) 0.20173 (15) 0.29671 (12) 0.0398 (3)
Atomic displacement parameters (Å2)
U11 U22 U33 U12 U13 U23
F1—C3 1.3227 (17) O1—H111 0.8399
F2—C3 1.3265 (17) O2—C1 1.2040 (13)
F3—C3 1.3325 (17) C1—C2 1.5310 (15)
O3—C2 1.4005 (13) C2—C3 1.5280 (17)
O3—H12 0.8400 C2—H12A 1.0000
O1—C1 1.3074 (13)
C2—O3—H12 109.5 C3—C2—H12A 108.8
C1—O1—H111 109.5 C1—C2—H12A 108.8
O2—C1—O1 125.56 (10) F1—C3—F2 107.55 (12)
O2—C1—C2 121.76 (10) F1—C3—F3 107.08 (12)
O1—C1—C2 112.68 (9) F2—C3—F3 107.21 (12)
O3—C2—C3 108.91 (10) F1—C3—C2 112.03 (11)
O3—C2—C1 110.48 (8) F2—C3—C2 110.91 (11)
C3—C2—C1 111.15 (9) F3—C3—C2 111.81 (11)
O3—C2—H12A 108.8
O2—C1—C2—O3 13.26 (15) C1—C2—C3—F1 −66.42 (14)
O1—C1—C2—O3 −166.37 (9) O3—C2—C3—F2 51.46 (14)
O2—C1—C2—C3 −107.76 (12) C1—C2—C3—F2 173.40 (11)
O1—C1—C2—C3 72.61 (12) O3—C2—C3—F3 −68.14 (13)
O3—C2—C3—F1 171.65 (10) C1—C2—C3—F3 53.80 (14)
Hydrogen-bond geometry (Å, º)
D—H···A D—H H···A D···A D—H···A
O3—H12···O2i 0.84 2.03 2.7459 (13) 143
O1—H111···O3ii 0.84 1.80 2.6381 (13) 172
C2—H12A···O1iii 1.00 2.60 3.4588 (16) 144