LOOKING INTO READING II: A FOLLOW-UP STUDY
ON TEST-TAKERS’ COGNITIVE PROCESSES WHILE
COMPLETING APTIS B1 READING TASKS
VS/2016/001
Tineke Brunfaut, Lancaster University
BRITISH COUNCIL VALIDATION SERIES SERIES EDITOR: VIVIEN BERRY
ISSN 2398-7979
ABSTRACT
This study investigated 25 ESL test-takers’ cognitive processing while completing a set of Opinion Matching tasks designed and piloted for use on the Aptis reading test and targeting the CEFR-B1 level. Insights were gained through the recording of participants’ eye traces during task completion, immediately followed by a stimulated recall after each task in which participants described, in their first language, how they had completed it.
The study follows up on the findings of Brunfaut & McCray (2015), who investigated test-takers’ task processing on the full Aptis reading test, and found support for the construct validity of the test. However, a somewhat weaker alignment between the intended and actual reading processes used by test-takers was found for the B1 banked gap-fill tasks of the Aptis reading test. The aim of this follow-up study, therefore, was to explore the cognitive processing on an alternative, newly designed set of Opinion Matching tasks to be able to evaluate the extent to which the new tasks elicited the specified processes for this level of the Aptis reading test (see O’Sullivan & Dunlea, 2015).
Test-takers were found to use a wide range of cognitive processes while they were completing the B1 Opinion Matching tasks, covering both lower- and higher-level processes as defined in Khalifa & Weir’s (2009) model of reading. Most often, when they successfully solved the item, the test-takers had adopted a careful and global reading approach (and sometimes they also did some expeditious reading), and they had combined lexical processing and/or meaning-making within sentences, across sentences or at textual and intertextual levels with inferencing. This global comprehension approach and the extensive engagement with higher-level processing associated with the B1 Opinion Matching
items not only differs substantially from the local and lower-level processing patterns associated with the original B1 banked gap-fill items, but also suggests a suitable match with the intended processes specified by the test developers for the Aptis B1 reading tasks.
Author
Tineke Brunfaut lectures in language testing at Lancaster University, UK. Her main research interests are language testing, and reading and listening in a second or foreign language. She has conducted research on factors affecting academic reading proficiency and second language listening task difficulty, the use of eye-tracking to look into second language reading, diagnostic assessment, and standard setting. Her work has been published in journals such as Applied Linguistics, Studies in Second Language Acquisition, TESOL Quarterly, Language Assessment Quarterly and Language Testing. Tineke has also been involved in test development in a range of languages and countries around the world.
Acknowledgements
CONTENTS
1. INTRODUCTION 5
2. THEORETICAL BACKGROUND 6
3. RESEARCH QUESTIONS 8
4. METHODOLOGY 8
4.1 Participants 8
4.2 Materials 9
4.2.1 Reading tasks 9
4.2.2 Full Aptis test 10
4.3 Data collection methodology and procedures 10 4.4 Ethical procedures and consent 12
4.5 Data analyses 12
4.5.1 Eye-tracking analyses 13
4.5.2 Stimulated recall analyses 14
5. FINDINGS 16
5.1 Descriptive statistics 16
5.2. Eye-tracking 17
5.2.1 Eye-tracking findings on cognitive processes when completing Aptis B1 Opinion Matching reading tasks (RQ1) and comparisons with the original Aptis B1 Banked Gap-fill reading tasks (RQ1a) 17 5.2.2 Eye-tracking findings on cognitive processes depending on
test-takers’ L2 (reading) proficiency (RQ1b & RQ1c) 23
5.3 Stimulated recall 25
5.3.1. Stimulated recall findings on cognitive processes during Aptis
B1 Opinion Matching reading task completion (RQ1) 25 5.3.2 Stimulated recall findings on differences in cognitive processes
between the ‘old’ and ‘new’ B1 task type 29 5.3.3 Stimulated recall findings on cognitive processes depending on
test-takers’ L2 (reading) proficiency (RQ1b & RQ1c) 30
6. DISCUSSION 33
7. CONCLUSION 34
LIST OF TABLES
Table 1: Eye-tracking metrics (Brunfaut & McCray, 2015, p.18) 13 Table 2: Adapted coding framework stimulated recalls 15 Table 3: Descriptive statistics – Aptis B1 Opinion Matching reading tasks used
for eye-tracking and stimulated recall (n=25) 16 Table 4: Descriptive statistics – full Aptis system (n=25) 16 Table 5: Aptis components – CEFR levels of participants (n=25) 16 Table 6: Descriptive statistics – Eye-tracking measures for the Aptis B1 Opinion
Matching tasks 19
Table 7: Results Aptis B1 Opinion Matching eye-tracking analyses compared
to Brunfaut & McCray (2015) study’s results (RQ1a) 20 Table 8: Eye-tracking support for RQ1a hypotheses 21 Table 9: Results eye-tracker analyses in relation to L2 reading proficiency (RQ1b)
and overall L2 proficiency (RQ1c) 23
Table 10: Eye-tracking support for RQ1b and RQ1c hypotheses 24 Table 11: Stimulated recall results on cognitive processes during Aptis B1
Opinion Matching reading task completion (RQ1) 26 Table 12: Stimulated recall results on cognitive processes when correctly
completing B1 banked gap-fill versus B1 Opinion Matching items (RQ1a) 29 Table 13: Stimulated recall results on cognitive processes of correct items
depending on test-takers’ L2 reading proficiency (RQ1b) 31 Table 14: Stimulated recall results on cognitive processes of correct items
depending on test-takers’ L2 proficiency (RQ1c) 33
LIST OF FIGURES
Figure 1: Khalifa & Weir’s model of cognitive processing in reading –
adapted from Khalifa & Weir (2009, p. 43) (Brunfaut & McCray, 2015, p. 7) 6 Figure 2: Key eye-tracking measures (Brunfaut & McCray, 2015, p. 10) 7 Figure 3: Adapted Opinion Matching task layout 9 Figure 4: Flowchart of the first data collection session 11 Figure 5: Heat maps of Aptis B1 Opinion Matching reading tasks 18 Figure 6: Heat maps of the old Aptis B1 Banked Gap-fill tasks
(Brunfaut & McCray, 2015, p. 28) 18 Figure 7: Reported combined uses of processes during B1 Opinion
1. INTRODUCTION
This study examined the cognitive processing of 25 test-takers while completing Aptis B1 reading tasks. The study follows up on the findings of the ‘Looking into Reading’ report by Brunfaut & McCray (2015), which investigated test-takers’ task processing on the full Aptis reading test by means of eye-tracking and stimulated recall methodologies. The Brunfaut & McCray (2015) study concluded that test-takers engaged in a wide range of cognitive processes while completing the Aptis reading tasks, including the lower- and higher-level processes defined in Khalifa & Weir’s (2009) model of reading, providing evidence of construct validity of the test for the sample of test-takers. Different patterns were observed in the main forms of processing used to complete the four different CEFR-linked Aptis reading task types (A1, multiple-choice gap-fill; A2, sentence ordering; B1, banked gap-fill; and B2, matching headings) and these differences appeared to be closely related to the task type. Generally, these patterns roughly matched the intended target processes for each CEFR-linked task level, as defined in the Aptis General Technical Manual, Version 1.0 (O’Sullivan & Dunlea, 2015). An exception to this, however, was test-takers’ processing of the Aptis B1 banked gap-fill reading items. Although these B1 tasks were found to elicit a range of reading comprehension processes, the reading processes test-takers used did not necessarily align with the expected processes (as outlined in O’Sullivan & Dunlea, 2015).
In response to the findings of Brunfaut & McCray (2015), the Aptis test developers explored alternative task types to ensure assessment of the intended cognitive processes for the B1-target reading task. In practice, a matching task type – the Opinion Matching task – was chosen, and a number of versions of the task were developed and piloted on the target population to screen for general functioning and quality of the task type.1 Subsequently, the British Council commissioned a study to investigate the cognitive processing of test-takers while completing the new B1 reading tasks, in order to evaluate the extent to which the new tasks elicited the specified processes for this level of the reading test (see O’Sullivan & Dunlea, 2015). The present report describes this follow-up study and its findings.
The follow-up study, entitled ‘Looking into Reading II’, aimed to examine test-takers’ cognitive processing while completing the new Aptis B1 reading task type, i.e. the Opinion Matching task. The study investigated test-takers’ task processing both in general and also relative to their L2 proficiency (as measured by the full Aptis test) and L2 reading proficiency (as measured by the Aptis reading component). In order to investigate this, and in a similar vein to the first ‘Looking into Reading’ study reported in Brunfaut & McCray (2015), a combination of eye-tracking and retrospective verbal protocols, with eye-tracking traces as recall enhancing stimuli, were used. The data, in combination with information on the processes intended to be assessed, provide key information on the validity of the Opinion Matching task.
1
2. THEORETICAL BACKGROUND
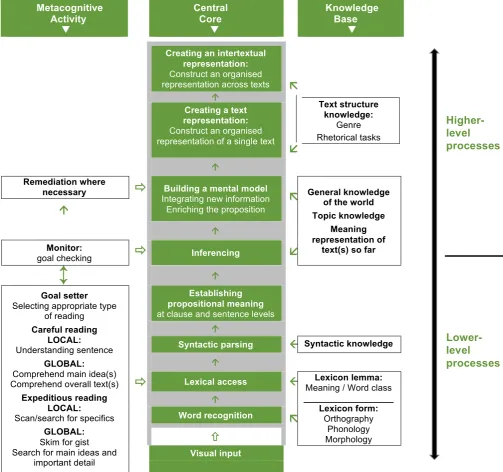
[image:6.595.63.567.280.752.2]In line with the first ‘Looking into Reading’ study (Brunfaut & McCray, 2015), Khalifa & Weir’s (2009) model of reading formed the theoretical foundation of this follow-up study due to the fact that it aligns with the socio-cognitive approach to test development and validation which has been adopted by the Aptis test developers (O’Sullivan, 2015). Thus, the inferences from the empirical data in this study on test-takers’ reading processes during Opinion Matching completion have been drawn with reference to the reading processes as theorised by Khalifa & Weir (2009). For ease of reference, the model is reproduced here in Figure 1, but for definitions and more detailed information on its components and the various processes, refer to Brunfaut & McCray (2015, pp. 5–6).
Figure 1: Khalifa & Weir’s model of cognitive processing in reading – adapted from Khalifa & Weir (2009, p. 43) (Brunfaut & McCray, 2015, p. 7)
Metacognitive Activity ▼
Central Core ▼
Knowledge Base ▼
Creating an intertextual representation:
Construct an organised
representation across texts
ã
å
Text structure knowledge:
Genre Rhetorical tasks
á
Creating a text representation:
Construct an organised representation of a single text
á
Remediation where
necessary
ð
Building a mental model Integrating new informationEnriching the proposition
ã
å
General knowledge of the world Topic knowledge
Meaning representation of
text(s) so far
á
á
Monitor:
goal checking
ð
Inferencing↕
áGoal setter
Selecting appropriate type of reading
Careful reading LOCAL:
Understanding sentence
GLOBAL:
Comprehend main idea(s) Comprehend overall text(s)
Expeditious reading LOCAL:
Scan/search for specifics
GLOBAL:
Skim for gist Search for main ideas and
important detail
Establishing propositional meaning
at clause and sentence levels á
Syntactic parsing
ß
Syntactic knowledgeá
ð
Lexical accessß
Meaning / Word class Lexicon lemma: __________________Lexicon form:
Orthography Phonology Morphology
á
Word recognition
ã
ñ
Visual inputHigher-level
processes
Empirical insights into reading and test completion increasingly come from mixed-methods research. In particular, the need to explore test-takers’ reading processes in a direct manner – not just relying on expert judgments of what readers might do – has been emphasised in the literature (e.g., Alderson, 2000). Therefore, in addition to quantitative analyses of reading test performance results, valuable insights into the nature of reading and the testing of reading have been gained through the use of qualitative methods such as verbal reports (e.g., Israel, 2015; Pressley & Afflerbach, 1995). Recently, language testing researchers have started experimenting with the use of eye-tracking technology to investigate test constructs and test validity. The combined use of eye-tracking and stimulated recalls, whereby test-takers are prompted to recall their thought processes by means of watching their own eye-movements as they responded to an item, has shown to be particularly useful (see e.g., Bax, 2013; Brunfaut & McCray, 2015). Therefore, as in the first study (Brunfaut & McCray, 2015), this study set out to investigate test-takers’ cognitive processes during reading test completion by means of eye-tracking and stimulated recall methodologies. For a description and review of eye-tracking methodology and a rationale for its use for the present research purpose, refer to Brunfaut & McCray (2015, pp. 8–10). To aid the reading of this current research report, however, this section very briefly explains four key terms related to eye movements and eye-tracking methodology: saccades, fixations, regressions, and areas of interest.
[image:7.595.77.519.505.591.2]When we read in English, our eyes do not move continuously across the lines, but they make series of forward saccades – small forward jumps from left to right going along the lines. The length of the forward saccades our eyes make may vary depending on issues such as the cognitive load involved in the task, the type of reading, or the proficiency of the reader. Our eyes may make several saccades while focused on one word, but they may also ‘bridge’ a number of words in one go. Sometimes, our eyes also make backward saccades from right to left, termed regressions. Regressions may happen for a number of reasons. Two common reasons for their occurrence while reading are, firstly, because our eyes ‘overshot’ an area we wanted to visually process and thus our brain ‘self-corrects’ to bring the area back into focus or, secondly, because of a comprehension breakdown we are attempting to repair, we need to move backwards and re-read a section of text. The number of regressions our eyes make may be associated with factors such as text difficulty and reading ability. At the end of each forward or backward movement, our eyes make a fixation – a short pause during which our eyes rest at a specific point on the page/screen in which information is taken in for processing. The time taken to fixate – the fixation duration – may also vary depending on factors such as word familiarity, lexical ambiguity, plausibility, the type of reading, etc. A visual representation of these eye movement characteristics is provided in Figure 2.
Figure 2: Key eye-tracking measures (Brunfaut & McCray, 2015, p. 10)
When working within a reading testing context, as opposed to reading per se, there are different aspects to a task that a test-taker is likely to process during test completion, for example, the task instructions, the reading input texts, and the items or questions asked to assess the test-taker’s comprehension of the textual input. Differences in test-taker ability, for example, may be associated with differences in time spent on different parts of the visual stimulus or switches between the parts. These different parts can be defined by the researcher on the basis of the study’s focus, and are called areas of interest (AOIs).
3. RESEARCH QUESTIONS
The aims of this study, as stated in section 1, were formulated as the following research questions.
Overarching question:
RQ1. What cognitive processes do test-takers employ during completion of the Aptis B1
Opinion Matching reading task?
Sub-questions:
RQ1a. Are there any differences in cognitive processes depending on the task type (i.e. the new
B1 Opinion Matching task as compared to the original Aptis B1 banked gap-fill task)?
RQ1b. Are there any differences in cognitive processes depending on test-takers’ L2 reading
proficiency, as measured by the Aptis reading component?
RQ1c. Are there any differences in cognitive processes depending on test-takers’ overall L2
proficiency, as measured by all Aptis test components?
4. METHODOLOGY
Given the effective methodological design of the first Aptis reading study (Brunfaut & McCray, 2015), this follow-up investigation similarly combined eye-tracking and stimulated recall methodology to obtain data on test-takers’ cognitive processes during completion of the Aptis B1 Opinion Matching
reading task. This also enabled comparisons between the two studies (i.e., Looking into Reading I & II – Brunfaut & McCray (2015) and the present study), and specifically between the ‘new’ and the ‘old’ Aptis B1 reading tasks. Also, to further ensure comparability of the two studies, this follow-up study recruited participants similar in profile to the first study’s participant group, followed similar data collection procedures, and adopted the same data analytical approaches.
4.1 Participants
The participants in this study were 25 English as a Second Language (ESL) speakers from three different first language backgrounds: 10 Thai-L1, 10 Chinese-L1, and 5 Russian-L1 speakers.
In terms of gender, 44% were male and 56% were female. Their ages ranged between 18 and 29 years old (M=21.5).
4.2 Materials
4.2.1 Reading tasks
To investigate the cognitive processes when completing the new Aptis B1 task, the Opinion Matching
task, the British Council provided three versions of the new task type which had previously been piloted. One task was used as a sample task for participant familiarisation and two tasks were used for data collection on participants’ cognitive processing. This matched the size of the dataset of the first study: the Brunfaut & McCray (2015) study similarly looked into processing on two versions of each CEFR-target level task (so two B1 banked gap-fill tasks). Each Opinion Matching task consisted of seven items, thus data was collected on a total of 14 items per participant.
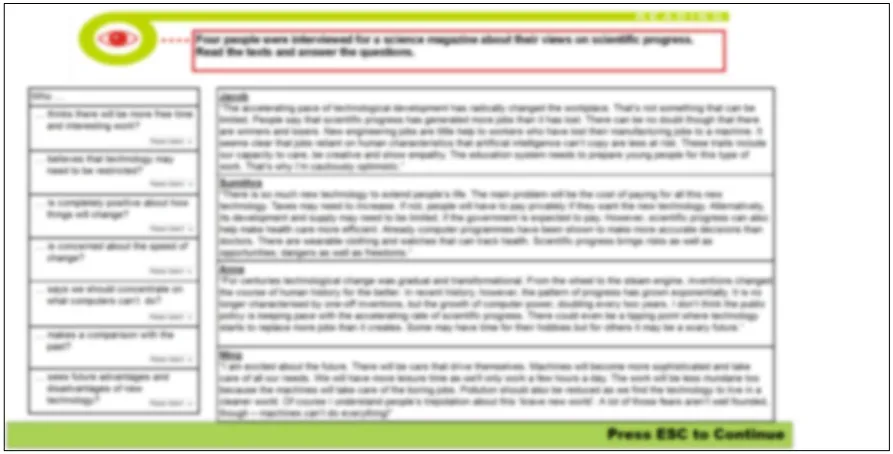
The Opinion Matching task consists of four (4) short texts, each one paragraph in length, which reflect four people’s interview replies on a common theme. The shared topic and a description of the publication outlet are provided to the test-takers in the task instructions. The task requires the test-takers to match each of a set of seven (7) questions to one of the interviewees, on the basis of the information provided in the texts.
Given the use of eye-tracking and stimulated recall methodology in the study, the Aptis task
presentation was mirrored in an offline format to ensure compatibility with the eye-tracking software, and to allow for pausing and replays of eye traces for the purposes of the stimulated recall.
To maintain ecological validity, only minimal formatting changes were made to the task presentation to enable the interpretation of eye traces. On the British Council’s test delivery platform, the Aptis
Opinion Matching presentation allows for scrolling up and down the text, however, in this study the stimulus was presented on a single screen. This is because moving screens interfere with interpreting the link between a particular eye trace and what the participant was focusing on at that point.
[image:9.595.74.521.455.682.2]Therefore, the questions and all text paragraphs were presented together so that no scrolling up and down was needed. The screenshot in Figure 3 shows the task layout as designed for the purposes of the study.
Figure 3: Adapted Opinion Matching task layout
4.2.2 Full Aptis test
To obtain a measure of participants’ overall English language proficiency and their English reading proficiency, the full computer-based Aptis test – consisting of the components grammar/vocab, reading, listening, writing, and speaking – was administered. This was done to enable the exploration of potential differences in cognitive processing depending on test-takers’ L2 reading proficiency and overall L2 proficiency (RQs1b & 1c).
The same version of the test used in the first study (Brunfaut & McCray, 2015) was used again to allow for comparison across projects and to avoid duplication of items between the full Aptis and the specific reading tasks used for eye-tracking. The regular Aptis test administration procedures stipulated by the British Council were strictly adhered to.
4.3 Data collection methodology and procedures
The data collection protocols were kept as similar as possible to those in the first study (Brunfaut & McCray, 2015), i.e. the data were gathered in two phases.
Phase 1
The aim of the first phase was to collect data that would inform the response to the overarching research question (RQ1 – What cognitive processes do test-takers employ during completion of the Aptis B1 Opinion Matching reading task?) and the first sub-question (RQ1a – Are there any
differences in cognitive processes depending on the task type, i.e. the B1 Opinion Matching task as compared to the original Aptis B1 banked gap-fill task?)
In this phase, the participants completed the Opinion Matching tasks while their eye traces were being recorded. The eye traces were collected using a Tobii TX300 eye-tracker, an unobtrusive, high-precision eye-tracker (300Hz sampling rate, accuracy 0.4°). The tasks were displayed in the Verdana font with a font size of 24px/18pt on a 23” monitor with an aspect ratio of 16:9 and a resolution of 1920x1080.
Each task was immediately followed by a retrospective verbal report of participants’ cognitive processes during task completion, i.e. the participants were prompted to verbalise the thoughts they had during task completion. To assist them with recall, they were shown screen recordings of their eye traces from when they had been completing the tasks (i.e. the eye traces functioned as stimuli for retrospection).
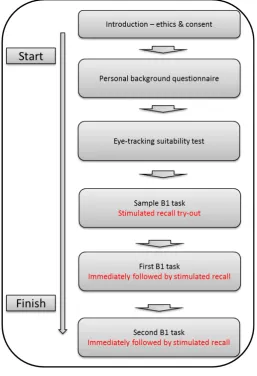
Figure 4: Flowchart of the first data collection session
As visualised in Figure 4, each participant was first given an introduction to the nature and purposes of the study. Then, the participant was asked for their written consent and asked to fill out a paper-based participant background questionnaire. This was followed by a technical eye-tracking suitability test to determine whether the participant’s eye-traces could sufficiently be captured by the hardware.2 In practice, all participants met the conditions for inclusion in the study. After this, the eye-tracking and stimulated recall procedure began.
First, the participant was asked to complete an example Opinion Matching task to familiarise themselves with the task type. At the same time, the participant’s eye traces were recorded. When the participant had completed the sample task, the stimulated recall procedure was trialled. The screen recordings with eye traces overlaid were replayed to the participant and the participant was asked to recall and verbalise his/her task completion processes. If necessary, feedback was given to the participant on the functioning of the task to aid their understanding of what was expected, or on how to conduct the recall. Five participants had assumed that some of the questions served as distractors and thus only answered four questions at first, whereas all seven need to be completed. The latter was pointed out to these participants by a research assistant.
2
After the sample task, the main data were collected. The participant was asked to complete two
Opinion Matching tasks while their eye traces were simultaneously recorded. Each completed task was followed by an immediate replay of the eye traces, pausing after each item completion attempt or when a participant felt suitable, and a request to verbalise was given as to how they approached the reading task and items in general, what they had been thinking during task completion, and how they had arrived at each of the answers they gave. For consistency, all stimulated recalls were conducted following a script with instructions and questions posed by the researcher. The stimulated recalls were audio- and video-recorded to enable and facilitate the understanding and interpretation of the stimulated recall data at the analysis stage.3
To ensure that the participants would be able to express their thoughts with ease, the stimulated recalls were conducted in the participant’s first language (L1), with the option of using English if the participant wished. The recall data were collected by three research assistants who had the same L1 as the participants (Thai, Chinese or Russian). These assistants were all linguists, specialised in language testing and second language acquisition (SLA), and had also conducted the recalls in the Brunfaut & McCray (2015) study. They were given refresher training for the purposes of this follow-up study. Furthermore, to generate high-quality eye-tracking data, calibration was refreshed before each individual task.
Phase 2
During the second data collection session, the same participants that took part in the eye-tracking/ stimulated recall session were administered the full Aptis test (all five components). This was to obtain a measure of the participants’ English reading proficiency and of their overall English language proficiency. The combination of the eye-tracking/stimulated recall data (from Phase 1) with the Aptis results (Phase 2) was necessary to be able to analyse potential differences in cognitive processes relative to test-takers’ L2 reading proficiency (RQ1b) and depending on their overall L2 proficiency (RQ1c).
The full Aptis test was administered in small groups (depending on the participants’ availability) in a computer lab at the researcher’s institution. The session was supervised by the researcher, and the official Aptis test’s procedures were strictly adhered to.
Prior to the main data collection, all instruments and procedures were piloted with two people.
4.4 Ethical procedures and consent
Adhering to the regulations at the researcher’s institution, ethical approval for the study was sought and granted. The participants were provided with a written information sheet. In addition, the nature of the study, the participant’s involvement, and the contact details of the researcher and Head of Department were also explained orally. All participants gave their consent in writing.
4.5 Data analyses
Based on the findings and experiences of the first study (Brunfaut & McCray, 2015), data from eye-tracking and stimulated recall can be triangulated and can also be combined to address weaknesses inherent in either method. For example, eye-tracking data is useful to shed light on low-level processes such as word recognition speed, whereas stimulated recalls can provide information on test-takers’ use of higher level processes such as inferencing. In what follows, brief descriptions of the data analysis approaches for both data sources – eye movements and stimulated recalls – are given.
3
4.5.1 Eye-tracking analyses
Measures
[image:13.595.70.519.230.676.2]For reasons of comparability between the ‘new’ and the ‘old’ B1-target task, the same eye-tracking measures were looked into and the same analyses were conducted as in Brunfaut & McCray (2015). These can be summarised as follows4: the data were analysed according to 11 eye-tracking metrics which relate to the test-takers’ fixations, saccades and regressions, and which can be subdivided into three processing-type groups – global processing, text processing, and task processing.5 Fixations were determined using the Tobii I-VT velocity and acceleration-based filter with its default settings. Table 1 provides an overview of the measures and their technical definitions.
Table 1: Eye-tracking metrics (Brunfaut & McCray, 2015, p.18)
Processing
focus Measure Technical definition
Global processing
Total number of fixations The sum of the number of fixations as defined by the fixation filter.
Total fixation time on text and responses
The sum of all fixation durations on text and response, expressed in seconds.
Text
processing
Number of forward saccades*
A forward saccade is a movement between two fixations, as defined by the fixation filter, from point x to point y where point y lies to the left of point x and is within plus or minus 10 degrees horizontally.
Median length of forward saccades*
Median length, expressed in pixels, of all forward saccadic movements.
Number of regressions
A regression is a movement between two fixations, as defined by the fixation filter, from point x to point y where point y lies to the right of point x, is within plus or minus 10 degrees horizontally, and is below some defined threshold designed to stop line returns being classified as regressions. Median length of
regressions*
Median length, expressed in pixels, of all regressions movements.
Proportion of regressive movements
The number of regressive movements divided by the sum of all eye movements (i.e. the number of forward saccades and the number of regressions).
Median fixation duration* The median of the fixation durations, expressed in milliseconds.
Sum fixation time on text per word
The sum of the fixation time on the text, measured in seconds, divided by the number of words in the text of the item.
Task processing
Proportion of time spent
fixating on response options The total fixation time on response options divided by the total fixation time on the text and response options. Number of AoI
switches between text and response options
The number of movements between Areas of Interest (AoIs) containing text and an AoI containing the response options.
*Scaled for font size (see below).
4
For more detailed info on the analyses and their rationale, see Brunfaut & McCray (2015). 5
Font scaling
To fit the texts and items of each task onto a single slide for presentation on the eye-tracker, the font sizes had to be set to a slightly different standard to that of some of the task types (A1, A2, B2) used in Brunfaut & McCray (2015). To allow for comparisons across all Aptis CEFR-linked reading task types, some measures were scaled. Namely, distance measures which would reduce with a smaller font size (indicated with * in Table 1), were scaled by 1.07 for the new B1 Opinion Matching tasks (which is the same as the old B1 banked gap-fill tasks).
Analyses
To explore test-takers’ processing while completing the Aptis B1 Opinion Matching reading tasks (RQ1) and potential differences in processing to the original Aptis B1 banked gap-fill reading tasks (RQ1a), the eye-tracking data collected on the two Opinion Matching tasks were visually
represented in heat maps and analysed according to the 11 metrics listed in Table 1. Differences in eye movements with the old B1 banked gap-fill tasks, as well as with the other Aptis reading tasks (A1, A2, B2) were established through Mann-Whitney U tests.
In order to investigate differences in test-takers’ cognitive processing depending on their English L2 reading proficiency (RQ1b) and their overall English L2 proficiency (RQ1c), Spearman’s correlations were run between each of the 11 eye-tracking measures (from test-takers’ eye movements during
Opinion Matching task completion) and the measures of test-takers’ L2 (reading) proficiency.
4.5.2 Stimulated recall analyses
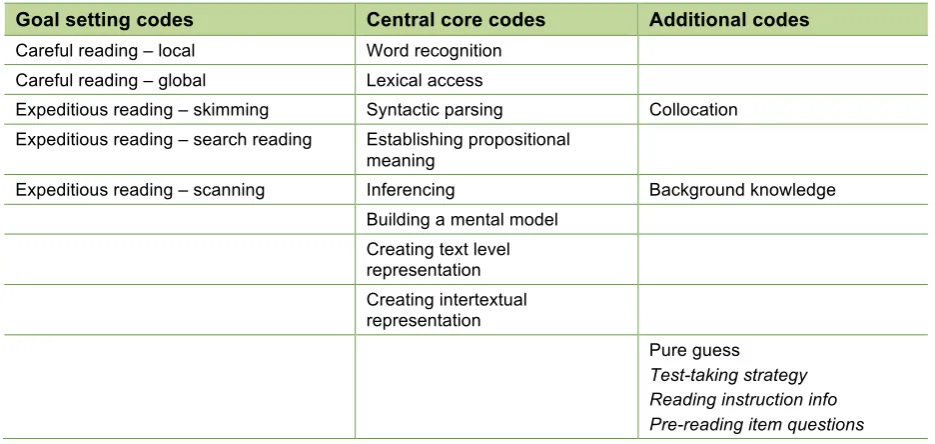
To analyse participants’ verbal reports of their task completion processes, the same methodology was followed as that in Brunfaut & McCray (2015).6 The verbal protocols, which had been video- and audio-recorded, were transcribed and translated from the participants’ L1 into English by the research assistants. The English transcripts were then coded by the principal investigator, using the qualitative data analysis software Atlas.ti v7, adopting Khalifa & Weir’s (2009) model of cognitive processing in reading as the basis of the coding framework. In addition, three extra codes were added to the coding framework used in Brunfaut & McCray (2015, p. 22), on the basis of observations made on the nature of the data during the coding process. Specifically, the codes ‘Reading instruction info’ and ‘Pre-reading item questions’ were added since a number of participants explicitly mentioned starting by reading the information given in the instruction and/or by reading the questions of the Opinion Matching task to gain an overall idea of the texts’ topic, text type, content and/or what to pay attention to while reading. The code ‘Test-taking strategy’ was developed to capture some participants’
reasoning regarding the number of times an interviewee’s text can/should be matched to the seven questions (e.g. at least once). The code ‘Creating paragraph level representation’, which had been specifically created to capture processing on the multi-paragraph texts of the B2 matching headings task in the Brunfaut & McCray (2015) study was dropped from the coding framework because the B1
Opinion Matching task consists of four separate text excerpts (texts in their own right) each only one paragraph in length, thus rendering this code irrelevant. The adapted coding framework is provided in Table 2.
The coding framework was applied to items answered correctly, as well as items answered incorrectly, with an additional tag of ‘W’ for wrongly answered items. This distinction was made for the purpose of test validation analyses, whereby it is vital to know what leads to a correct answer or what may cause construct-irrelevant variance.
6
Table 2: Adapted coding framework stimulated recalls
Goal setting codes Central core codes Additional codes
Careful reading – local Word recognition Careful reading – global Lexical access
Expeditious reading – skimming Syntactic parsing Collocation Expeditious reading – search reading Establishing propositional
meaning
Expeditious reading – scanning Inferencing Background knowledge Building a mental model
Creating text level representation Creating intertextual representation
Pure guess Test-taking strategy Reading instruction info Pre-reading item questions
Once the data were coded, the frequency of codes was calculated to establish whatcognitive processes test-takers employ while completing B1 Opinion Matching tasks (RQ1). Furthermore, a number of subanalyses were conducted to inform the answers to RQs1a-1b-1c. Namely, to evaluate the effectiveness and validity of the B1 Opinion Matching task, the codings were tallied and compared with those of the ‘old’ B1 banked gap-fill task (RQ1b).
5. FINDINGS
5.1 Descriptive statistics
Participants’ performance results on the Aptis B1 Opinion Matching readings tasks are presented in Table 3. The mean score and scoring range indicate that the participants performed well on these tasks (on which participants’ eye movements were recorded and in relation to which they produced the stimulated recalls).
Table 3: Descriptive statistics – Aptis B1 Opinion Matching reading tasks used for eye-tracking and stimulated recall (n=25)
Max. possible score Min. Max. M SD
B1 Opinion
Matching tasks 14 8 14 12.36 1.66
Table 4 provides descriptive statistics for participants’ performances on the full Aptis test which was administered to obtain an L2 proficiency and L2 reading proficiency measure for the participants.
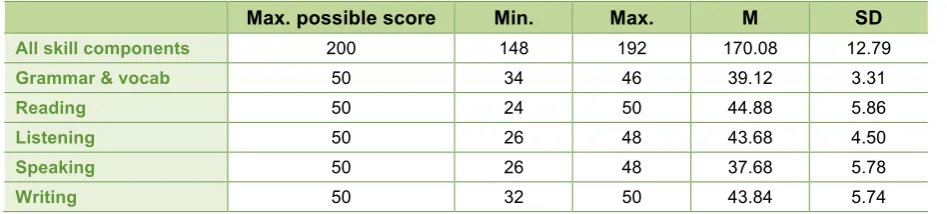
[image:16.595.63.537.467.574.2]In Table 5, these results have been translated into the number of participants performing at a particular CEFR level, as stated in the score reports retrieved from the British Council. The table shows that, similar to the first study (Brunfaut & McCray, 2015), the volunteer group willing to participate can be characterised as mostly “independent and proficient users” (Council of Europe, 2001).
Table 4: Descriptive statistics – full Aptis system (n=25)
Max. possible score Min. Max. M SD
All skill components 200 148 192 170.08 12.79
Grammar & vocab 50 34 46 39.12 3.31
Reading 50 24 50 44.88 5.86
Listening 50 26 48 43.68 4.50
Speaking 50 26 48 37.68 5.78
Writing 50 32 50 43.84 5.74
Table 5: Aptis components – CEFR levels of participants (n=25)
Aptis Component A1 A2 B1 B2 C
Reading 0 1 0 4 20
Listening 0 0 1 0 24
Speaking 0 1 7 15 2
To gauge the comparability of the first study (Brunfaut & McCray, 2015) and the present study, an independent-samples t-test was conducted to compare the L2 proficiency of the participant groups. No significant differences were found in full Aptis scores of the first study’s participants (M=166.72, SD=12.89) and the present study’s [M=170.08, SD=12.79, t(48)=-.93, p=.36], or in Aptis reading scores of the first study’s participants (M=42.32, SD=5.09) and the present study’s [M=44.88,
SD=5.86, t(48)=-1.65, p=.11]. The magnitude of the differences in the means was small (eta squared
full Aptis=.018; eta squared Aptis reading=.054) (following Cohen, 1988). In addition to the fact that the
participants in the present study were strictly recruited according to the same test-taker characteristics profile of the first study, these statistical results provide support for the validity of making comparisons between the two studies (in particular RQ1a).
5.2. Eye-tracking
Two types of data were collected to help uncover test-takers’ cognitive processing while completing Aptis B1 Opinion Matching reading tasks: eye-movement data and verbal reports of test-takers’ thought processes. This section presents the results of the eye-movement analyses.
5.2.1 Eye-tracking findings on cognitive processes when
completing Aptis B1 Opinion Matching reading tasks (RQ1)
and comparisons with the original Aptis B1 Banked Gap-fill
reading tasks (RQ1a)
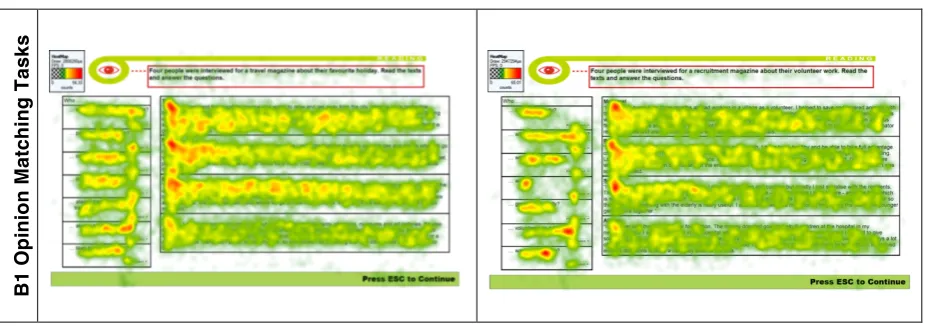
Initial insights into test-takers’ cognitive processing while completing Aptis B1 Opinion Matching
reading tasks (RQ1) were gained from heat map inspection. Heat maps are visualisations resulting from participants’ eye movements and which plot the aggregate amount of time participants spent focusing on particular areas of the input. The colours – ranging from transparent (no fixations) over green and through yellow to red – indicate increasing amounts of time visually focusing on an area. Figure 5 shows these visualisations for all items of the two Opinion Matching tasks, with each participant’s data carrying the same weight.
Figure 5: Heat maps of Aptis B1 Opinion Matching reading tasks
B1
Opi
n
io
n
M
a
tc
h
in
g
Ta
sk
s
For comparison (RQ1a), the heat maps of the old B1 banked gap-fill tasks showed a rather different picture (see Figure 6): test-takers’ attention seemed to particularly be drawn to the words surrounding the gaps, which suggested more careful local reading and lower-level processing (Brunfaut & McCray, 2015).
Figure 6: Heat maps of the old Aptis B1 Banked Gap-fill tasks (Brunfaut & McCray, 2015, p. 28)
B1
Ba
nk
e
d
G
a
p
-fi
ll
Ta
sk
s
[image:18.595.67.528.403.561.2]Table 6: Descriptive statistics – Eye-tracking measures for the Aptis B1 Opinion Matching tasks
Global processing
measures
Text processing measures
Item processing measures Tota l n u m b e r o f fi x a ti o n s To ta l fi x a ti o n t im e o n t e x t a n d re s p o n s e s ( s e c o n d s ) Nu m b e r o f fo rw a rd s a c c a d e s Me d ia n l e n g th o f fo rw a rd saccades (px) Nu m b e r o f re g re s s io n s Me d ia n l e n g th o f r e g re s s io n s (p x ) Pr o p o rt io n o f re g re s s ive mo v e me n ts Me d ia n f ix a ti o n d u ra ti o n ( ms ) Su m o f fi x a ti o n t im e o n t e x t per w or d (seconds) Nu m b e r o f A o I s w it c h e s bet w een text and responses Pr o p o rt io n o f ti m e spent fi x a ti n g o n r e s p o n s e s B1 Op in io n Ma tc h in
g Median 749 222 413 107 193 -70 0.25 210 0.43 47 0.20
IQR 306 98 173 30 67 27 0.07 23 0.18 25 0.04
Min 495 119 256 67 84 -110 0.14 167 0.23 24 0.10
Max 1321 368 759 179 370 -47 0.37 240 0.74 89 0.24
Table 7 presents the results of the eye-movement analyses of the Aptis B1 Opinion Matching tasks, i.e. the “New B1 items”, together with the results of the eye-movement analyses of all Aptis reading tasks investigated in the first study (Brunfaut & McCray, 2015) – A1 multiple-choice gap-fill, A2 sentence ordering, B1 banked gap-fill, and B2 matching tasks. As was the case in the first study, differences can be observed in the eye-tracking measures between the B1 Opinion Matching tasks and the A1-, A2- and B2-target level tasks. In addition, the results for the new B1 Opinion Matching
task (in green print) are noticeably different from those of the first study’s B1 banked gap-fill tasks (in red print). Significance testing of these differences was conducted via the Mann-Whitney U tests, which confirmed that the new B1 tasks resulted in different eye-movement patterns from the old B1 tasks in almost all respects (in orange print) (RQ1a).
Table 7 shows that, with the exception of the measures Medianlength of regressions and Median fixation duration, there are statistically significant differences between the two B1-target level task types for all the measures:
§
global processing measures: ‘total number of fixations’ and ‘total fixation time spent on text and responses’§
text processing measures: ‘number of forward saccades’, ‘median length of forward saccades’, ‘number of regressions’, ‘proportion of regressive movements’, ‘sum of fixation time on text per word’§
item processing measures: ‘number of AoI switches between text and responses’ and ‘proportion of time spent fixating on responses’.Table 7: Results Aptis B1 Opinion Matching eye-tracking analyses compared to Brunfaut & McCray (2015) study’s results (RQ1a)
Si g n if ic a n c e t e s
ts A1 – new B1 *** *** *** *** *** *** *** *** ***
A2 – new B1 *** *** *** *** *** * *** *
Old B1 –
New B1 *** *** *** *** *** *** *** *** ***
B2 – new B1 *** *** * * *** *** *** ***
Note: The statistics expressed for each measure on CEFR task level are the median values across all participants.
In the first study, a set of hypotheses were formulated on the direction of the relationship between each of the 11 eye-tracking measures and processing in relation to the CEFR-target level of the tasks (Brunfaut & McCray, 2015, p. 19). Table 8 reproduces these hypotheses and gives an indication of whether they can be supported on the basis of the new B1 Opinion Matching tasks in relation to the first study’s results on the A1-, A2-, and B2-target level tasks. A tick signifies that the hypothesis was fully supported; a cross means that support was not found; and both a tick and a cross indicates that there was limited support for the hypothesis.
Global processing
measures
Text processing measures
Item processing measures To ta l n u m b e r o f fi x a ti o n s To ta l fi x a ti o n t im e o n t e x t a n d re s p o n s e s ( s e c o n d s ) Nu m b e r o f fo rw a rd s a c c a d e s Me d ia n l e n g th o f f o rw a rd saccades (px) Nu m b e r o f re g re s s io n s Me d ia n l e n g th o f re g re s s io n s (p x ) Pr o p o rt io n o f re g re s s ive mo v e me n ts Me d ia n f ix a ti o n d u ra ti o n ( ms ) Su m o f fi x a ti o n t im e o n t e x t p e r wo rd ( s e c o n d s ) Nu m b e r o f A o I s w it c h e s b e tw e e n te x t a n d r e s p o n s e s Pr o p o rt io n o f ti m e s p e n t fi x a ti n g on responses Fi rst st udy
A1 Items 188 49.7 55.5 70.75 54.5 -69 0.36 220 0.64 71 0.45
A2 Items 301 76.1 145 77 74.5 -66 0.25 209 0.72 34 0.16
Old B1
Items 362 127.2 185 66.61 108 -68.35 0.33 224 0.72 71 0.33
B2 Items 859 280 606 77.95 189 -64.77 0.19 237 0.29 72 0.28
Th
is
s
tu
d
y A1 Items 188 49.7 55.5 70.75 54.5 -69 0.36 220 0.64 71 0.45
A2 Items 301 76.1 145 77 74.5 -66 0.25 209 0.72 34 0.16
New B1
Items 749 222 413 107 193 -70 0.25 210 0.43 47 0.20
Table 8: Eye-tracking support for RQ1a hypotheses
Measure Hypothesis with reference to RQ1a Met?
Gl o b a l p ro c e s s in
g Total number of fixations As the CEFR level of the tasks increases, the total number of fixations will increase. This directly is due to the fact that the texts for the harder
tasks are longer. Longer texts are required in order to test higher-level cognitive processes which relate to comprehension at the sentence level and above.
Total fixation time on text and responses
As the CEFR level of the tasks increases, the total fixation time on the text and responses will increase. This measure is closely linked with ‘total number of fixations’, but it is more sensitive to the total time spent on the text and less sensitive to movement around the text.
Te x t p ro c e s s in g
Number of forward
saccades As the CEFR level of the tasks increases, the number of forward saccades will increase. This measure represents the fact that higher-level tasks have longer and more complex texts that require more processing.
Median length of
forward saccades As the CEFR level of the tasks increases, the median length of a forward saccade will decrease. This is due to the increased cognitive load on the test-taker as a function of CEFR level (higher level, higher cognitive processing load).
Number of
regressions As the CEFR level of the tasks increases, the total number of regressions will increase. This is due to two factors; firstly, a regression is more likely in a longer text, and secondly, regressions are more likely as the text becomes more challenging.
Median length of regressions
As the CEFR level of the tasks increases, the median length of the regressions will increase. This relates to the notion that more complex texts in the higher-level CEFR tasks will generate more between-word regressions, as they are designed to measure more higher-level cognitive processing, than the lower CEFR level tasks.
Proportion of regressive movements
As the CEFR level of the tasks increases, the proportion of regressive movements will decrease. As the texts increase in complexity, there will be a greater need to perform regressions in order to facilitate
comprehension. Median fixation
duration As the CEFR level of the tasks increases, the median fixation duration will increase. This would be due to the test-takers requiring longer fixations to comprehend the more complex texts and perform the more complex operations required by the higher-level tasks.
Sum fixation time on text per word
As the CEFR level of the tasks increases, so does the proportion of time spent on the text per word. This would be due to the fact that the increasing cognitive demands placed on the test-takers by the higher-level texts require greater processing per word.
Ta s k p ro c e s s in g
Number of AoI switches between text and response options
As the CEFR level of the tasks increases, the number of switches between the text and the responses will increase. This would be due to the increasing difficulty in integrating the information contained in the text with the response in the selection of the correct answer.
Proportion of time spent fixating on response options
The support for the hypotheses on the global processing measures Total number of fixations and
Total fixation time on text and responses show that the B1 Opinion Matching tasks follow the
expectation that more complex tasks (i.e., higher CEFR-level target) elicit more processing in a much more pronounced manner than the B1 banked gap-fill tasks. Intuitively, the tendency is logical due to the lengthier texts used at the higher CEFR levels of the test. However, whereas the B1 banked gap-fill tasks’ results on these measures were quite similar to the A2-target tasks and there was a vast difference with the B2-target level tasks, the processing on the B1 Opinion Matching tasks show significantly different results to the A2-target level tasks on the two global processing measures and, overall, the results show a pattern that is more in line with the hypotheses. Similar conclusions can be drawn for the Number of forwards saccades and Number of regressions on the text of the B1 Opinion Matching tasks as compared to the eye-tracking results of the Brunfaut & McCray (2015) study.
The Median length of forward saccades on the texts of the B1 Opinion Matching tasks was
significantly longer than on the other Aptis reading tasks. Potentially, this relates to the nature of this specific task type which consists of four individual text excerpts, which, although on the same topic, are not continuous prose, rather standalone passages. At the same time, the test-takers need to answer seven items in relation to only four texts. As evidenced in the eye trace videos, test-takers often ‘visited’ one or all texts more than once, potentially using more expeditious reading when searching for answers to later items or after initial reading.7 This additional use of expeditious reading approaches, which followed the initial careful reading (or preceded it), may be associated with longer forward eye movements.
In the first study with the B1 banked gap-fill texts, a greater Proportion of regressive movements was found on the A1 and B1 than the A2 and B2 texts, which suggested more local parsing and careful (re)processing of the texts on the A1 and B1 gap-fill tasks. The eye-trace videos had also indicated that participants concentrated on local reading of the gaps and the words immediately surrounding the gaps – going back and forth. While completing the B1 Opinion Matching tasks, however, this pattern was not observed and proportionally fewer regressions were made than on the old B1 texts,
suggesting less local and more global reading.
Similar to the first study, the original hypotheses for the Median regression length, and for the Median fixation duration and Sum of fixation time on text per word were violated. However, as discussed in Brunfaut & McCray (2015), measures related to the duration of fixations on the text may not so much relate to the CEFR-target level per se, but to the reading approach required by the task. Lower total fixation times per word indicate that readers may not process the text as thoroughly or may not do so every time they re-read. In essence, this measure seems to indicate more expeditious and global approaches to text processing. Thus, the results of this follow-up study suggest that the test-takers did more global reading, and also sometimes expeditious reading, on the new B1 tasks as compared to the old B1 tasks. With reference to the Median fixation duration and the Median regression length, potentially, these results might relate to the nature of the task, which requires test-takers to consider seven items in relation to only four texts. This may have led many test-takers to access the texts more than once8, using careful and expeditious reading approaches at different points in the (re-)reading process, which might have balanced out differences in these median measures.
The findings provide only partial support for the hypothesis regarding the item processing measure
Number of AoI switches between text and responses, with test-takers making fewer switches between the text and the items of the B1 Opinion Matching tasks as compared to the A1, old B1, and B2 tasks. Proportionally, the test-takers also spent a more limited amount of time looking at the item side of the B1 Opinion Matching tasks – as demonstrated through the significant differences between the different CEFR-target level tasks in terms of the measure Proportion of time spent fixating on responses.
7
Note that this interpretation is also supported by the stimulated recall data presented in Section 5.3. 8
A potential explanation might be that the item side of the B1 Opinion Matching tasks consists of a list of questions with the same four answer options (i.e. the names of the people associated with each text fragment, which are also printed above each excerpt) and test-takers may have relied on their memory when having processed the item side already.9
To summarise, the analyses of 11 eye-tracking measures show that eye movements on the B1 banked gap-fill items (old B1 items) and the B1 Opinion Matching items (new B1 items) differ statistically significantly on 9 of the 11 measures, which suggests substantial differences in the cognitive processes associated with these two sets of items. Whereas the eye traces on the B1 banked gap-fill items suggested a largely local careful reading approach, the eye traces on the B1
Opinion Matching items support suggestions of a more global reading approach.
5.2.2 Eye-tracking findings on cognitive processes depending
on test-takers’ L2 (reading) proficiency (RQ1b & RQ1c)
A further aim of the study was to establish whether there are any differences in test-takers’ cognitive processing while completing the B1 Opinion Matching tasks depending on their L2 reading proficiency (RQ1b) or their overall L2 proficiency (RQ1c). To this end, measures of (reading) proficiency were obtained through test-takers’ performances on the full Aptis test, and their eye-movements were analysed according to their English reading proficiency and overall English language proficiency (as determined by their Aptis test scores) through Spearman’s rank-order correlations.
[image:23.595.99.499.471.676.2]Similar to the Brunfaut & McCray (2015) study, the results of these analyses of eye-movements as a function of test-taker L2 (reading) ability uncovered very few significant relationships. Table 9 presents the three measures which showed statistically significant relationships (at the 0.05 level; highlighted in grey) with test-takers’ overall L2 proficiency: Total number of fixations, Number of regressions, and Proportion of regressive movements. No significant associations were found between the eye-movement data and test-takers’ L2 reading proficiency.
Table 9: Results eye-tracker analyses in relation to L2 reading proficiency (RQ1b) and overall L2 proficiency (RQ1c)
To tal n u m b er o f fi x a ti o n s Nu m b e r o f re g re s s io n s Pr o p o rt io n o f re g re s s iv e m o v e m e n ts Ne w B1 L2 reading proficiency
Coefficient -0.261 -0.241 -0.293
P-Value 0.207 0.246 0.156
Overall L2 proficiency
Coefficient -0.423 -0.486 -0.422
P-Value 0.035 0.014 0.036
9
The statistically significant relationships between L2 proficiency and the eye-tracking metrics (see Table 9) are all in a negative direction, which indicates that the measures diminished as the L2 proficiency of the test-taker was higher, and which might be interpreted as exemplifying different facets of the greater efficiency of processing by the better performing test takers. More specifically, it was found that participants’ L2 proficiency negatively correlated with their total number of fixations, or, in other words, the more proficient test-takers fixated fewer times on the B1 Opinion Matching
tasks’ texts and responses while completing the tasks. Negative correlations were also found between participants’ overall L2 proficiency and their number and proportion of regressive movements while reading the texts. Thus, the more proficient test-takers made fewer, in the absolute sense, and also proportionally fewer, backward saccades. Taken together, the results indicate that the difference between the lower- and higher-level test-takers was their ability to process the information in the text the first time they read it, rather than having to re-read and thus increase the total number of fixations and regressions.
In Brunfaut & McCray (2015, p. 20), a number of hypotheses were put forward on test-takers’ processing – as demonstrated through their eye movements – in relation to their L2 (reading) proficiency. These hypotheses are repeated in Table 10. Similar to the first study, the above findings on the B1 Opinion Matching tasks regarding the relationship between the 11 eye-tracking measures and test-takers’ L2 (reading) proficiency can be plotted against these hypotheses. A tick indicates that the hypothesis was fully supported, whereas a cross shows that no support was found.
[image:24.595.66.534.427.753.2]Overall, on the basis of participants’ eye movements, limited processing differences were found according to the test-takers’ L2 (reading) proficiency (RQ1b and RQ1c). It should be noted, however, that the relatively small sample size in this study may have masked some smaller yet extant effect sizes, but it should also be taken into consideration that most participants in the study had high levels of (reading) proficiency (see Table 4). Thus, the limited number of relationships found may at least partly reflect the nature of the participant group. Potentially, more hypotheses would be confirmed with a participant group comprising a much wider range of abilities.
Table 10: Eye-tracking support for RQ1b and RQ1c hypotheses
Measure Hypothesis with reference to RQ1b & RQ1c RQ1b
Met?
RQ1c Met?
Gl
o
b
a
l
p
ro
c
e
s
s
in
g
Total number of
fixations As the ability of the test-taker increases, the number of fixations required to complete a task will decrease. This reflects the increased processing efficiency of higher ability test-takers who are able to process the text with fewer fixations, i.e. they have fewer breakdowns in comprehension leading to re-reading text, they use longer
saccades (thus fewer fixations) to process text and/or they find the correct response quickly, and are confident in their selection, without the need for extensive searches or validation of their response. Total fixation
time on text and responses
As the ability of the test-taker increases, the amount of time it takes fixating on a task will decrease. This reflects the increased processing efficiency of higher ability test-takers (see ‘Total number of fixations’).
Te
x
t
p
ro
c
e
s
s
in
g
Number of forward saccades
As the ability of the test-taker increases, the number of forward saccades on the text of a task will decrease. This reflects the
increased processing efficiency of higher ability test-takers (see ‘Total number of fixations’).
Median length of forward saccades
As the ability of the test-taker increases, the median length of forward saccades on the text will increase. This is dueto more skilful readers being able to process more information during each fixation.
Number of
regressions As the ability of the test-takers increases, the number of regressions will decrease. This is because higher-ability test-takers need to solve fewer processing issues.
Median length of regressions
Measure Hypothesis with reference to RQ1b & RQ1c RQ1b Met?
RQ1c Met?
Proportion of
regressive movements
As the ability of the test-taker increases, the proportion of regressive movements will decrease. This would be due to the effect of poorer test-takers’ need to re-read sections of the text to facilitate comprehension.
Median fixation duration
As test-taker ability increases, the median fixation duration will decrease. This would be due to the better readers processing the information at each fixation faster than the poorer readers. Sum
fixation time on text per word
As the ability of the test-takers increases, the sum fixation time per word will decrease. This reflects the ability of the higher level test-takers to process the information contained in the text more quickly than the lower level test-takers.
Ta
s
k
pr
ocessi
ng
Number of AoI switches between text and response options
As the ability of the test-taker increases, the number of switches between the text and the responses will decrease. This would reflect the better test-takers being more able to process the text of the task and hold the representation in memory and not require extensive switching to the responses.
Proportion of time spent fixating on response options
As the ability of the test-takers increases, the proportion of time spent fixating on the responses will increase. This would be due to thecomprehension of the texts of the tasks presenting a
proportionally smaller challenge to the better readers than to the poorer readers.
5.3 Stimulated recall
Insights into test-takers’ cognitive processing while completing the B1 Opinion Matching tasks was additionally gained with a second set of data, namely, stimulated recalls produced immediately after completing the tasks.
5.3.1. Stimulated recall findings on cognitive processes during
Aptis B1 Opinion Matching reading task completion (RQ1)
The overarching research question (RQ1) was: What cognitive processes do test-takers employ during Aptis B1 Opinion Matching reading task completion? To shed light on this, stimulated recalls with eye-movement recordings as the stimulus were conducted with the 25 participants on two versions of the task (14 items in total). The test-takers provided the correct answer in 88% of the cases (309 cases), but were unsuccessful in 12% of the cases (41 cases). An overview of the cognitive processes the test-takers used while completing these tasks, as evidenced in their stimulated recalls, is provided in Table 11. A distinction is made between processes reported for correctly-answered items versus incorrectly-answered items. To enable this comparison, percentages are provided. For example, for the 309 times that test-takers gave a correct answer, they reported 297 times using a global careful reading approach, i.e. for 96% of the 309 cases. For the 41 times they gave an incorrect answer, they reported 21 times using a global careful reading approach, i.e. for 51% of the 41 cases. In addition, when reading Table 11, it should be kept in mind that often the participants reported using more than one kind of process to establish the answer to a particular item.