© 2019, IRJET | Impact Factor value: 7.211 | ISO 9001:2008 Certified Journal | Page 6333
SIMULATION AND ANALYSIS OF STEP LIGHT MID PART USING MOLD
FLOW ANALYSIS
Netaji Subhash Chandrashekhar
1, Dr. S. S. Shinde
21PG Student, Dept. of CAD/CAM/CAE, K.I.T.’s College of Engineering, Kolhapur Maharashtra, (India)
2Mechanical Engineering, Dept, K .I.T.’s College of Engineering, Kolhapur Maharashtra, (India)
---***---Abstract -
Mold flow simulation helps designers to seehow their designs will be resulted after injection molding process. The use of simulation programs saves time and reduces the costs of the Molding system design. Injection molding design simulation holds an important role in analyzing the outcome of the design. Today, many manufactures have proven mold flow analysis (MFA) to be the medium between a flawless design and production. Taguchi method is used for optimizing the molding process parameters. This thesis presents use of taguchi method for Design of Experiment in plastic injection Molding. The study applies Taguchi’s L9 orthogonal array design technique to study the effect of process settings of plastic injection molding on part quality. Experimental trial data is used to compare the results with moldflow simulation. The optimum levels for mold surface temperature, melt temperature, injection time and v/p switch over are determined.
Key Words: Molding window, design of experiment
(DOE), mold flow analysis, taguchi method..
1. INTRODUCTION
Mold flow simulation helps designers to see how their designs will be resulted after injection molding process without needing to do the Injection Molding process. The use of simulation programs saves time and reduces the costs of the Molding system design. Injection molding design simulation holds an important role in analyzing the outcome of the design. Creating a high performing mold is a vital part of the injection molding process, but can be challenging. While one might think liquid plastic simply takes on the shape of the mold it’s injected into. Today, many manufactures have proven mold flow analysis (MFA) to be the medium between a flawless design and production. CIPET Aurangabad provides the scope for research in plastic engineering.
The Autodesk Simulation Moldflow results help to identify the main problem areas before the part is manufactured that are particularly difficult to predict with traditional methods. Analysis is essential for designing and mould making through simulation step-up and result interpretation to show how changes to wall thickness, gate location, material and geometry affects manufacturability and also experiments with “what-if” scenarios before
finalizing a design. Injection Moulding simulation software into the mould design process in order to analyze the product, foresee the possible defects, and optimize the design to achieve the maximum outcome of the products with minimum cycle time in each production cycle.[18]
On the study of injection moulding process the most important point that lies under is the mould. The mould, which is the most important component part, that gives the product the shape required and designing the part product associated with the mould, hence worth study.
Back in time before the involvement of product, mould designing and appearance of mould designers, artisans and die makers were taking part. After the second world war when plastic technologies was beginning this artisans were engaged on mould designing but as time pass by and there emerged a demand for increased verities of plastic products designing with different moulding parameters and high specialization seeks enabling the level of mould makers, mould and product designing on a specific profession.[19]
1.1 LITERATURE REVIEW
J. Rao, at al [1] had focused on the analysis of plastic flow in two plate injection mold. Mold flow analysis software is used to perform the analysis of filling, wrap and best gate location. The analysis begins with the origin of the flow channels such as Barrel, nozzle, sprue, runners, and gates until the cavity is completely filled. The main objectives their research were to design plastic part, to design feeding system like sprue, runner and gate in two plate injection mold, to set optimum process parameter like injection pressure, speed, temperature and other, analysis plastic flow in two plate injection Mold.
© 2019, IRJET | Impact Factor value: 7.211 | ISO 9001:2008 Certified Journal | Page 6334
P. P. Shinde, at al [3] had analysed analytically andexperimentally injection mold for Auto component. Injection molding process is much widely spread; it can produce very complex shaped parts with minimal time compared to other process. Even parts with metal inserts can also be produced on injection molding machine. Injection molding dies are expensive to produce but each die can be used to manufacture thousands of components with rapid rate, so that per-part cost is very low. Dealing analytically, the tonnage (clamping force for both halves) required for Plastic Injection Molding is derived from the projected surface area of the component. Then 3D model of component and its mold design was created by using CAD software such as CATIA. On the other hand experimentation carried out using physical tests to find out the defects such as porosity, air traps and blow holes.
J. Ganeshkar, at al [4] This paper presents the design of plastic injection mold an Automotive Component “air Vent Bezel” through mold flow analysis for design Enhancement, Before proceeding, the part was analyzed by mold flow software to remove defects such as air trap, weld line, Shrinkage of part, Dimension not exact and incorrect Clamping Force, Cooling Channels not Properlyto Remove Heat such Problems are and try to Eliminate or Minimized, also Flow of plastic is observed. Dimensional accuracy is measured and checked with the specified dimensions. Visual and actual inspection did while attempting to identify the defects. Further, for fitment in the subassembly the component is checked.
S.M. Nasir, at al [15] In this paper the authors have identified the best setting for single and double gate, which affect the warpage for thick component using Taguchi and ANOVA methods. Mold Temperature, Melt Temperature, Packing Pressure and Packing Time are the selected parameter that used in this study. These experiments were performed by Autodesk Moldflow Insight (AMI) software based on L9 orthogonal array designed by Taguchi. Effects of single and double gates to the warpage formation also were compared. The results show that Taguchi method is capable to minimize the warpage deflection. Moreover, double gate design was better than single gate in minimizing the warpage deflection.
A.M. Gwebu, at al [16] The authors have used Taguchi method to determine the optimum values of the injection moulding process parameters for high density polyethylene (HDPE.) plastic parts. A moulding processing window in which the process achieved maximum quality, with major focus being on mould filling is developed.
P. Sanap, at al [17] In this paper the authors have focused on optimization, this paper deals with the optimization of plastic moulding by reducing warpage with the application of Taguchi optimization technique & part design
modifications. Taguchi optimization technique is used for determining the optimum plastic injection moulding process parameters. In part design modifications, ribs are added to the wash lid component to provide additional strength to the washing machine. Analysis of the process parameters are initially carried out by utilizing the combination of process parameters based on three-level of L27 Taguchi orthogonal design. Further, signal-to-noise (S/N) ratio is applied to find the optimum process parameters for warpage defect in the wash lid component. The design modifications and analysis for warpage using optimum parameters obtained from S/N ratio using Pro-E design software and Solid Edge Plastic analysis software. The results obtained reveals that improvement in total warpage is 22.0% & in X-direction it is 37% and stress distribution is by 28% which proves that the strength of the wash lid has increased.
1.2
Objectives
1. 3D modeling of the plastic product using suitable software and meshing using dual domain mesh with proper aspect ratio.
2. To study the component design and identify the critical parameters in the molding window analysis.
3. To set optimum process parameters like injection pressure, speed, and temperature.
4. To simulate the flow and finding the fill time, injections molding defects and deciding the best gate location.
5. Validation through trials and testing by comparing the results of trials and DOE.
2. METHODOLOGY
Methodology presented here is accepted after reviewing several studies done to do similar moldflow analysis. This will lead to better understanding of the objectives and analyzed characteristics to make a one to one comparison between the process parameters.
2.1 Research Issues
1. After studying various papers in this context the major findings are the defects arising in injection molding viz; unequal filling, over filling, warpages and sink marks, silver linings, etc. For enhancing the product quality these defects are needed to be minimised. For this, setting of the process parameters must be optimum which will give the molten plastic a proper way for manufacturing. 2. As injection molding is a trial and error basis
© 2019, IRJET | Impact Factor value: 7.211 | ISO 9001:2008 Certified Journal | Page 6335
2.2. Problem Definition“Simulation and Analysis of Step Light Mid Part using Mold flow Analysis”.
1. 3D modeling of the plastic product (Plastic part selection, meshing using dual domain mesh with proper aspect ratio)
2. Identify the critical parameters in the molding window analysis. (Material Selection, Experimental setup for injection molding machine, determining the molding conditions.) 3. To set optimum process parameters setting.
(Design of Experiments using minitab and Trials on Injection molding machine)
4. To simulate the flow and finding fill time, injection time and molding defects, best gate location analysis using moldflow software
5. Validation of results by comparing the moldflow results and trials.
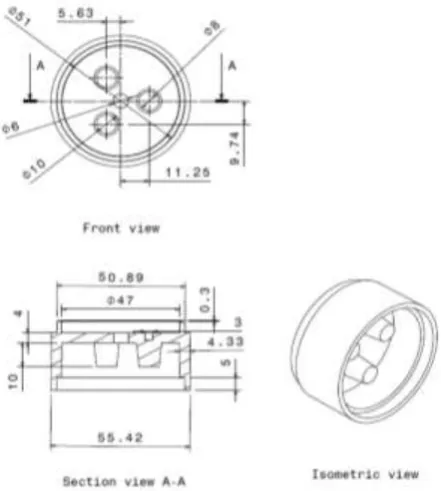
[image:3.595.47.268.368.614.2]2.3. 3D model of step light mid part
Figure 1.1. CAD Model Step light Mid Part
2.4. Mesh Procedure
1. Import the part .stp file in Autodesk Mold flow Insight
2. Mesh Now, using dual domain type mesh.
3. After the meshing command is executed and processing finished the following mesh part result of the Step Light Mid Part is obtained for dual domain mesh.
Figure 1.2 Meshing result of the Step Light Mid Part
The implication is that the software disintegrate the part design in to triangular or /and tetrahedral elements and joined by nodes, at the node connection points been a transferring point of load and force for the analysis. From the above mesh analysis it is done perfectly to result the mesh version of the product design and revels that the part design in Creo is completely compatible and matches for melt simulation and analysis. Hence, there are no overlapping nodes so that the simulation carried out and generates the result that would have been not so if the mesh is not proper.[22]
2.4. Material:
Polycarbonate (PC) Grade: Romawhite, Macrolon, 2407
3. TAGUCHI EXPERIMENTAL DESIGN
The Taguchi method involves reducing the variation in a process through robust design of experiments. The overall objective of the method is to produce high quality product at low cost to the manufacturer. The Taguchi method was developed by Genichi Taguchi. He developed a method for designing experiments to investigate how different parameters affect the mean and variance of a process performance characteristic that defines how well the process is functioning. The experimental design proposed by Taguchi involves using orthogonal arrays to organize the parameters affecting the process and the levels at which they should be varied. Instead of having to test all possible combinations like the factorial design, the Taguchi method tests pairs of combinations. This allows for the collection of the necessary data to determine which factors most affect the product quality with a minimum amount of experimentation, thus saving time and resources. The Taguchi method is best used when there are an intermediate number of variables (3 to 50), few interactions between variables, and when only a few variables contribute significantly.
© 2019, IRJET | Impact Factor value: 7.211 | ISO 9001:2008 Certified Journal | Page 6336
Table.3.1. Critical parameters [image:4.595.313.550.208.383.2]Four super plastic forming parameters are considered as controlling factors. They are Mold surface temperature, melt temperature, Injection time and V/P Switch over. Each parameter has three levels – namely low, medium and high, denoted by 1, 2 and 3 respectively. According to the Taguchi method, if four parameters and 3 levels for each parameter are consider, L9 orthogonal array should be employed for the experimentation. Table shows the parameters and their levels considered for the experimentation.
Table.3.2. Critical parameters
For four parameters and three levels L9 orthogonal array was selected from the array selector
.
The trials were takenon JIT80T injection molding Machine in accordance with Table and inspection of the formed component was done. Experimental data hence measured is as a shown in table. Taguchi method of optimization involves finding out Signal-to-Noise ratio (S/N) in order to minimize quality characteristic variation due to uncontrollable parameter. Cooling time belongs to “larger the better” quality characteristics.
Table.3.3. DOE by L9 OA
Total 9 experiments were conducted and the runs for the experiment are as shown in the table 3.3
4. RESULTS & DISCUSSIONS
[image:4.595.309.566.450.612.2]Figure 4.1 Graph For S-N Ratio – Larger is better.
[image:4.595.37.291.600.728.2]© 2019, IRJET | Impact Factor value: 7.211 | ISO 9001:2008 Certified Journal | Page 6337
Table.4.1. Optimized parameters and output resultsFigure 4.2 Fill time analysis result
Filling time starts with the blue region where the optimum injection point set for the maximum filling and propagates to peripherals of the cavity as it passes the blue, green and finally maximum filling time of red region which takes for all full filling of the cavity to be a duration of 3.231 s.
Figure 4.3 V/P switch over
Figure 4.4 Pressure analysis result
The result obtained from the simulation of the analysis shows that though a maximum pressure in the red zone is allowed as high as 45.46 MPa the melt can completely fill the cavity with the yellow region of maximum optimum operating pressure of 34.10 MPa that would be enough for complete filling, and hence this pressure is enough for the operating pressure of the mould
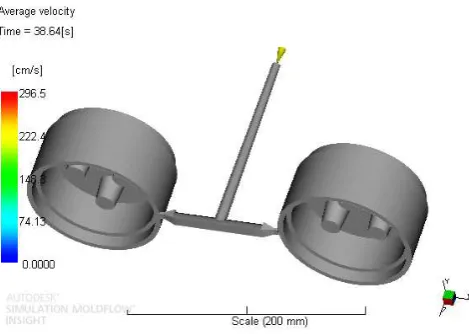
Figure 4.5 Average velocity result
[image:5.595.312.547.410.577.2]© 2019, IRJET | Impact Factor value: 7.211 | ISO 9001:2008 Certified Journal | Page 6338
Figure 4.6 Temperature analysis resultBased on this the simulation analysis resulted as shown in the figure below of about a maximum of 310.3 degree Celsius on the red zone of the melt part on the cavity which then drops after filling with a time interval of 38.64 s to a blue part on the region to a temperature range of 100 degree Celsius where then on wards thermal stabilization achieved and the mould temperature stays in equilibrium.
Figure 4.7 Clamp force analysis Result
From the analysis result a clamp force of 13 tonne is required for the maximum filling of the cavity as an optimum result. On the analysis setting for the machine the clamp force is assigned as 1.04 tonne after several trials and it is near the simulation analysis results and feasible being optimum for the result. Moreover the analysis tells there need this 13 tonne amount of clamp force for the part product manufacturing which is on average feasible range of JIT 80T machine operation practically. The plot of the clamp force versus time is shown.
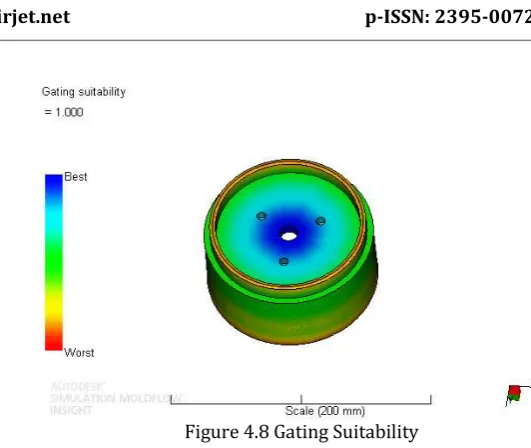
Figure 4.8 Gating Suitability
[image:6.595.308.564.328.485.2]The best gate location is near node number =2351.
Table 4.2 Observations from moldflow simulation
.
[image:6.595.58.283.416.571.2]
As shown in table 4.2. the moldflow simulation is run on Autodesk moldflow insight. The input parameters such as mold s/f temperature, melt temperature, injection time and v/p switch over are analyzed and output parameters like 1)Cooling time and 2)Fill time observations are recorded. The Trial 2 readings (highlighted) for Input parameters and output parameters are compared with DOE and actual trial readings.
Table 4.3 Optimized Process Parameters
.
[image:6.595.306.558.622.727.2]© 2019, IRJET | Impact Factor value: 7.211 | ISO 9001:2008 Certified Journal | Page 6339
the process parameters are highlighted as shown in table4.3
.
Table 4.4 Observations from trials
The mold trials are done at CIPET, Aurangabad under the stated molding conditions and the observations for the different trials are recorded. The trial 4 readings are compared with mold flow simulation results and design of experiment optimum readings and it is found that there is similarity between all the results.
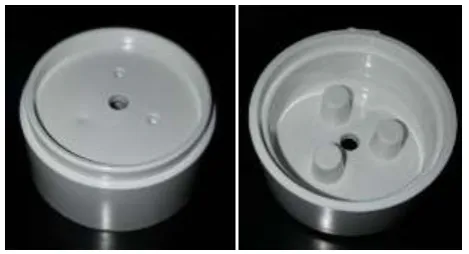
[image:7.595.36.291.148.279.2]4.1 Manufacturing of step light mid part during trial
Figure 4.9 Step Light Mid Part
Figure 4.10 Trials at CIPET, Aurangabad
As shown in the figure 4.9. the step light mid part is manufactured by using the stated molding conditions and visual inspection is done for identifying the defects if any. The part is acceptable.
6. CONCLUSIONS
The mid part, keeping its complexity in mined was tried designing several times until the desired functional part geometry is achieved. Design of Experiments was done by Taguchi’s technique. For four parameters and three levels L9 orthogonal array was selected. Through pilot study experiments the levels of parameters were selected. These experiments were conducted between 80ºC to 120 º C mold surface temperatures and 285ºC to 310ºC melt temperature. From the pilot study the selected levels of mold surface temperature were 80ºC, 100ºC, 110ºC. The melt temperature was 285ºC, 300ºC, 310ºC. Cooling Time and Fill time were two response variables. Total nine experiments were conducted and S/N ratios for cooling time and fill time were plotted. Confirmation tests were conducted using the higher the better values for cooling time and fill time.
After making the prototype simulation with mold flow, it can be concluded that it makes the ground for the manufacturing of Step light mid part practically in industries for injection molding.
6.1. Scope
Analysis of the product using Autodesk Mold flow (Simulation tool) software helps us validate and optimize plastic parts, injection molds, and the injection molding process. This software is essential for designing and mold making through simulation setup and results interpretation to show how changes to wall thickness, gate location, material, and geometry affect manufacturability. and also experiments with “what-if” scenarios before finalizing a design.
REFERENCES
1. J. Rao , Dr. Ramni “Analysis of Plastic Flow in Two Plate Multi Cavity Injection Mold for Plastic Component for Pump Seal” International Journal of Scientific and Research Publications, Volume 3, Issue 8, August 2013 ISSN 2250-3153.
2. J. Liu, “Application of Mold Flow Technology in the Warp Analysis”, przegląd elektrotechniczny, R. 89 NR 1b/2013, ISSN 0033-2097
[image:7.595.45.280.404.531.2]© 2019, IRJET | Impact Factor value: 7.211 | ISO 9001:2008 Certified Journal | Page 6340
4. J. Ganeshkar, R B Patil, “plastic Injection MoldDesign for An Automotive Component “air Vent Bezel” Through Mold Flow Analysis for Design Enhancement ” International Journal of Innovation in Engineering, Research and Technology [IJIERT] ICITDCEME’15 Conference Proceedings ISSN No - 2394-3696.
5. N.A.Shuaib, M.F. Ghazali, Z. Shay full, M.Z.M. Zain, S.M. Nasir, “Warpage Factors Effectiveness of a Thin Shallow Injection-Molded Part using Taguchi Method”, International Journal of Engineering & Technology IJET-IJENS Vol: 11 No: 01 PP 182-187. 6. T. C. Chang and E. Faison,”Optimization of Weld Line Quality in Injection Molding Using an Experimental Design Approach”, Journal of Injection Moulding Technology, JUNE 1999, Vol. 3, No. 2 PP 61-66.
7. M. Salunke, “Injection molding methods design, analysis and Simulation of plastic cup by mold flow analysis”, international journal of current engineering and scientific research (IJCESR), ISSN (print): 2393-8374, (online): 2394-0697, volume-4, issue-6, 2017.
8. N.Subramani, J.Ganesh Murali, P.Vijaya Rajan, C.Godwin Jose, “optimization of injection moulding mould flow analysis using Taguchi approach”, International Journal of Pure and Applied Mathematics, Volume 118 No. 11 2018, 241-250, ISSN: 1311-8080 (printed version); ISSN: 1314-3395 (on-line version)
9. S. Kamaruddin, Z. A. Khan and S. H. Foong, “Application of Taguchi Method in the Optimization of Injection Moulding Parameters for Manufacturing Products from Plastic Blend” International journal of Engineering and Technology, IACSIT, 2, ISSN 1793-8236, 2010. 10.V. K.Modi, “Analysis of Use of Taguchi Method with
Design of Experiment (DOE) and Analysis of Variance( ANOVA) in Plastic Injection Molding for Quality Improvement by Optimization”, International Journal for Research in Applied Science & Engineering Technology (IJRASET) ISSN: 2321-9653; IC Value: 45.98; Volume 5 Issue VII, July 2017.
11. W. C. Chen, T. T. Lai, G. L. Fu, “A Systematic Optimization Approach in the MISO Plastic Injection Molding Process”, IEEE 2008 PP 2741-2746.
12. E. Bociga, T. Jaruga, K. Lubczyñska, A. Gnatowski. Warpage of injection moulded parts as the result of mould temperature difference; Archives of material Science and Engineering, 44, 2010, 28-34.
13. S.Selvaraj, P.Venkataramaiah, “Measurement of warpage of injection moulded Plastic components using image processing”, International journal of
innovative research in science, 2, IJIRSET, ISSN 2319-8753, 2013.
14. S. Y.Yang, S. C. Jiang, and W. S. Lu, “Ribbed Package Geometry for Reducing Thermal Warpage and Wire Sweep During PBGA Encapsulation”, Transactions on component and packaging technologies, IEEE, 23, 2000.
15. S.M. Nasir, K.A. Ismail, Z. Shayfull, M.A. Md. Derus. “Warpage Improvement of Thick Component Using Taguchi Optimization Method for Single and Double Gates in Injection Molding Process”, Australian journal of basic and applied sciences, 7(5), ISSN 1991- 8178, 2013, 205-212.
16. A.M. Gwebu, L. Nyanga, S.T. Nyadongo, A.F. Van der Merwe, S Mhlanga, “Effect of mould temperature on the filling behavior of molten resin in plastic injection moulding of HDPE”, SAIIE 26, 2014.
17. P. Sanap, H M Dharmadhikari, and A J Keche, “Optimization of Plastic Moulding by Reducing Warpage With the Application of Taguchi Optimization Technique & Addition of Ribs in Washing Machine Wash Lid Component”, IOSR Journal of Mechanical and Civil Engineering (IOSR-JMCE) e-ISSN: 2278-1684,p-ISSN: 2320-334X, Volume 13, Issue 5 Ver. I.
18. V. V Andhalkar, Dr. S. R. Dulange, “Injection molding methods design, optimization, Simulation of plastic flow reducer part by mold flow analysis”, International Research Journal of Engineering and Technology (IRJET) e-ISSN: 2395 -0056 Volume: 04 Issue: 06.
19. G. Cheng, “Injection mold sprue and runner”, Injection mold making and molding, [ONLINE] Available at: http://imoldmaking.com/mold-
making-2/mold-design/runner-andgate/Injection-mold-sprue-and-runner/. [Accessed 21October 11].
20. S. Teklehaimanot, “Simulation and Design of a plastic injection Mold”, Identification number: 9639 Degree Thesis PTE, 2011.
21. K. Mesfin, “Product design, simulation and analysis of manual juice maker”,Identification Number 10328, Degree Thesis PTE, 2014.