warwick.ac.uk/lib-publications
Original citation:
Bergenholm, Linnéa, Parkinson, J., Mettetal, J., Evans, N. D., Chappell, M. J. (Michael J.) and Collins, T.. (2017) Predicting QRS and PR interval prolongations in humans using nonclinical data. British Journal of Pharmacology, 174 (19). pp. 3268-3283.
Permanent WRAP URL:
http://wrap.warwick.ac.uk/97730
Copyright and reuse:
The Warwick Research Archive Portal (WRAP) makes this work by researchers of the University of Warwick available open access under the following conditions. Copyright © and all moral rights to the version of the paper presented here belong to the individual author(s) and/or other copyright owners. To the extent reasonable and practicable the material made available in WRAP has been checked for eligibility before being made available.
Copies of full items can be used for personal research or study, educational, or not-for profit purposes without prior permission or charge. Provided that the authors, title and full bibliographic details are credited, a hyperlink and/or URL is given for the original metadata page and the content is not changed in any way.
Publisher’s statement:
"This is the peer reviewed version of the following Bergenholm, Linnéa, Parkinson, J., Mettetal, J., Evans, N. D., Chappell, M. J. (Michael J.) and Collins, T.. (2017) Predicting QRS and PR interval prolongations in humans using nonclinical data. British Journal of
Pharmacology, 174 (19). pp. 3268-3283. which has been published in final form at
http://doi.org/10.1111/bph.13940 . This article may be used for non-commercial purposes in accordance with Wiley Terms and Conditions for Self-Archiving."
A note on versions:
The version presented here may differ from the published version or, version of record, if you wish to cite this item you are advised to consult the publisher’s version. Please see the ‘permanent WRAP URL’ above for details on accessing the published version and note that access may require a subscription.
1
Predicting QRS and PR interval prolongations in humans using
1nonclinical data
2RUNNING TITLE 3
Predicting QRS and PR prolongations in humans. 4
5
Authors 6
L Bergenholm,1,2 J Parkinson,3 J Mettetal,4 N D Evans,1 M J Chappell,1 T Collins4 7
8
Affiliations 9
1Biomedical & Biological Systems Laboratory, School of Engineering, University of
10
Warwick, Coventry, UK; 11
2Drug Metabolism and Pharmacokinetics, Cardiovascular and Metabolic Diseases,
12
Innovative Medicines and Early Development, AstraZeneca, Gothenburg, Sweden, 13
3Early Clinical Development, Quantitative Clinical Pharmacology, Innovative Medicines
14
and Early Development, AstraZeneca, Gothenburg, Sweden; 15
4Safety and ADME Translational Sciences, Drug Safety and Metabolism, Innovative
16
Medicines and Early Development, AstraZeneca, Cambridge, UK. 17
18
19
"This is the peer reviewed version of the following article:
20
Bergenholm, L., Parkinson, J., Mettetal, J., Evans, N.D., Chappell, M.J., Collins, T.,
21
2017. Predicting QRS and PR interval prolongations in humans using nonclinical data. Br.
22
J. Pharmacol. 174, 3268–83., which has been published in final form at
23
https://www.ncbi.nlm.nih.gov/pubmed/28675424. This article may be used for
non-24
commercial purposes in accordance with Wiley Terms and Conditions for Self-Archiving."
25
2 ABSTRACT
1
2
Background and Purpose: Risk of cardiac conduction slowing (QRS/PR prolongations) is 3
assessed prior to clinical trials using in vitro and in vivo studies. Understanding the quantitative 4
translation of these studies to the clinical situation enables improved risk assessment in the 5
nonclinical phase. 6
Experimental Approach: Four compounds that prolong QRS and/or PR (AZD1305, 7
flecainide, quinidine and verapamil) were characterised using in vitro (sodium/calcium 8
channels), in vivo (guinea pigs/dogs) and clinical data. Concentration-matched translational 9
relationships were developed based on in vitro and in vivo modelling and the in vitro to clinical 10
translation of AZD1305 was quantified using an in vitro model. 11
Key Results: Meaningful (10%) human QRS/PR effects correlated to low levels of in vitro 12
Nav1.5 block (3-7%) and Cav1.2 binding (13-21%) for all compounds. The in vitro model 13
developed using AZD1305 successfully predicted QRS/PR effects for the remaining drugs. 14
Meaningful QRS/PR change in humans correlated to small effects in guinea pigs and dogs 15
(QRS 2.3- 4.6% and PR 2.3-10%), suggesting that worst case human effects can be predicted 16
by assuming four times greater effects at the same concentration from dog/guinea pig. 17
Conclusion and Implications: Small changes in vitro and in vivo consistently translate to 18
meaningful PR/QRS changes in humans across compounds, and accurate characterisation of 19
concentration-effect relationships therefore require a model-based approach. Assuming broad 20
applicability of these approaches to assess the safety risk for non–arrhythmic drugs, this study 21
provides means to predict human QRS/PR effects of new drugs using in vitro and in vivo effects 22
3
NON-APPROVED ABBREVIATIONS
1
BSV (between subject variability); 2
ECG (electrocardiogram); 3
FTIM (first time in man); 4
hCav1.2 (human cardiac calcium channel); 5
hNav1.5 (human cardiac sodium channel); 6
iv (intravenous); 7
rCav1.2 (rat cardiac calcium channel); 8
PD (pharmacodynamic); 9
PK (pharmacokinetic); 10
PPB (plasma protein binding); 11
QTc (heart rate corrected QT) 12
4
INTRODUCTION
1
Adverse effects on vital processes involved in heart function are a major cause of drug 2
withdrawal and late stage attrition (Laverty et al., 2011; Redfern et al., 2010). Important 3
biomarkers for heart function include the duration of key intervals in the electrocardiogram 4
(ECG), such as QT, QRS and PR. Identifying effects on these biomarkers in nonclinical studies 5
is vital for the progression of safe compounds into first clinical trials. Numerous investigations 6
provide insights for predicting risk of prolongation of the heart-rate corrected QT (QTc) 7
interval (Chain et al., 2013; Gintant, 2011; Jonker et al., 2005; Parkinson et al., 2013). Much 8
less is known of the nonclinical to clinical translation of drug-induced conduction slowing 9
manifested as QRS and PR prolongations, despite their association with increased risk of CV 10
mortality and morbidity, especially in risk populations (Nada et al., 2013). 11
QRS complex duration corresponds to conduction through the ventricular myocardium, 12
and is a predictor of sudden cardiac death (Kurl et al., 2012). In addition, treatment with 13
conduction-slowing drugs (type 1C antiarrhythmics) increased mortality in patients with 14
structural heart disease in the Cardiac Arrhythmia Suppression Trial (CAST) trials (Epstein et 15
al. 1993). Drug-induced QRS widening is primarily linked to inhibition of the sodium ion 16
channel Nav1.5. Recent studies suggest that <10% block of the human Nav1.5 (hNav1.5) may 17
lead to QRS widening in humans (Cordes et al., 2009; Harmer et al., 2011). Despite limitations 18
including use-dependency, nonlinear translation to conduction slowing, variability across 19
laboratories and platforms (Gintant, Gallacher & Pugsley 2011), this suggests that small 20
disturbances in the sodium current are of relevance. 21
PR interval duration represents time of conduction through the atria and the atrio-22
ventricular (AV) node and prolongations are associated with increased risk of atrial fibrillations 23
and death in risk populations (Cheng et al., 2009). The primary mechanism for drug-induced 24
PR prolongation is AV block through inhibition of the cardiac L-type calcium (Cav1.2) channel 25
(Nada et al., 2013). In addition to PR prolongation, Cav1.2 block can cause bradycardia 26
(slowed heart beat), reduced contractility and sinus arrest. Potential conduction liabilities may 27
be detected by functional human Cav1.2 (hCav1.2) electrophysiology assays (Cao et al., 2010) 28
or radioligand binding to rat Cav1.2 (rCav1.2) (Morton et al., 2014). Radioligand binding to 29
the diltiazem site of rat Cav1.2 is the most predictive of contractility in canine myocytes in 30
vitro compared to radioligand binding at the verapamil and nifedipine sites and conventional 31
and to automated functional hCav1.2 electrophysiology (Morton et al., 2014). It is not known 32
5 Morton and colleagues, the converse might be expected to be true. For example, the radioligand 1
assay was performed using rat brain Cav1.2 while the functional assay was performed using 2
human cardiac Cav1.2. Also, a functional assay should theoretically detect the effects elicited 3
by binding to any site, while the binding assay is site-specific. PR prolongation may also be 4
caused by Nav1.5 block causing slowed conduction through the atria (P wave prolongation) 5
and/or the His-Purkinje system (Vaughan Williams, 1992). Safety margins have to our 6
knowledge not been suggested for hCav1.2 inhibition or rCav1.2 binding. 7
During lead identification, different series of molecules are investigated to identify 8
candidate compounds for further optimisation. At this stage, in vitro Cav/Nav studies may be 9
conducted and the obtained results (IC50) used, in the context with other data, to drive chemistry
10
and select compounds to progress into in vivo studies. Later, in vivo investigations of drug-11
induced effects on CV effects such as ECG intervals and haemodynamics are typically 12
conducted in anaesthetised and/or conscious rats, guinea pigs, dogs and non-human primates 13
(Cros et al., 2012; Erdemli et al., 2012; Heath et al., 2011; Marks et al., 2012), although rats 14
are insensitive to hERG-mediated effects (Mcdermott et al., 2002). During lead optimisation, 15
when a final candidate drug molecule is not yet selected, rodent cardiovascular studies may be 16
conducted to evaluate the CV safety risks of a number of often structurally related molecules, 17
alongside other testing such as efficacy studies. Prior to first time in man (FTIM) studies, ICH 18
S7A/B guidance requires a non-rodent (typically dog or non-human primate) telemetry study 19
to assess cardiovascular risk, including QRS/PR changes, as part of the pre-clinical safety 20
package. Qualitative analyses have confirmed links between hNav1.5 inhibition, conduction in 21
isolated rabbit heart tissue and QRS/PR prolongations in dogs and non-human primates 22
(Erdemli et al., 2012). Also, conscious dog studies identified and differentiated QRS effects of 23
two anti-arrhythmics (Heath et al., 2011). In this work, we wish to expand on this knowledge 24
to investigate quantitative in vivo to clinical translations of QRS widening or PR 25
prolongations, applying pharmacokinetic-pharmacodynamic (PKPD) and translational 26
modelling. In this study, two approaches to translation were adopted to quantify the 27
translational relationships between nonclinical effects and clinical QRS and PR prolongations. 28
Firstly, empirical (top-down) in vitro and in vivo to clinical translations were investigated for 29
the anti-arrhythmic compounds AZD1305, flecainide, quinidine and verapamil. In the top-30
down approach, no assumption was made regarding the nature of the translational relationships, 31
and these were visualised by plotting concentration-matched effects for each compound 32
independently. The translational relationships were used to identify nonclinical effects of each 33
6 prolongation in humans. Thresholds of 10% effect in humans were selected as such effects 1
were deemed clinically relevant and quantifiable in clinical studies, in the absence of generally 2
accepted thresholds for concern (Nada et al., 2013). Secondly, mechanism-based translation 3
using the operational model (Black and Leff, 1983) was investigated to identify the system 4
parameters linking ion channel effects (measured in vitro) to clinical QRS and PR 5
prolongations induced by AZD1305. In the middle-out approach, the in vitro to clinical 6
translation is quantified by assuming a model for this relationship. While the empirical 7
translations were investigated for all compounds, middle-out modelling was only performed 8
for AZD1305, as high quality exposure and ECG data were available from a clinical study. In 9
contrast to the first approach, this approach allows direct simulation of clinical effects given 10
the estimated model and any PK curve. Objectives of this study were to i) compare the 11
translational relationships between in vitro, in vivo and clinical effects on cardiac conduction 12
for four anti-arrhythmic compounds, ii) identify nonclinical effects corresponding to 10% QRS 13
and PR prolongations in humans and iii) quantify the systems parameters describing the 14
relationship between ion channel effects in vitro and clinical QRS and PR prolongations. 15
Results of these analyses will provide a starting point for predicting QRS widening and PR 16
prolongation in humans based on nonclinical observations. 17
18
METHODS
19Compounds 20
Four anti-arrhythmic compounds were investigated: the proprietary small molecule AZD1305 21
(Sigfridsson et al., 2012) and the three marketed anti-arrhythmic compounds flecainide, 22
quinidine and verapamil. AZD1305 is a mixed ion channel blocker (hERG, hNav1.5, rCav1.2) 23
previously in development for the treatment of atrial fibrillations, which was discontinued due 24
to safety concerns regarding QTc prolongations and TdP risk (Rónaszéki et al., 2011). 25
Quinidine, flecainide and verapamil are class 1a, 1c and 4 anti-arrhythmics, respectively. 26
27
Nonclinical data 28
In vivo data were collected from previous studies in routinely conducted AstraZeneca assays 29
in anaesthetised guinea pig (Marks et al., 2012) and conscious dog (Prior et al., 2009). All 30
animal care and experimental procedures had local ethics committee approval and conformed 31
7 conducted as part of routine safety pharmacology validation work, and not operator/analyst 1
blinded. 2
3
Guinea pig telemetry data were available for flecainide and verapamil as these compounds 4
were assessed during assay validation, while no data were available for AZD1305 and 5
quinidine. Details of the experimental setup are described by Marks and colleagues (Marks et 6
al., 2012). Briefly, exposure and CV biomarkers were investigated in sodium pentobarbitone 7
anaesthetised guinea pigs using parallel study designs. Four male Dunkin Hartley guinea pigs 8
(Harlan UK Limited, weight range 496 to 614 g, age 7-8 weeks) were randomised to each 9
treatment and vehicle group. Baseline variability was minimised by controlled body 10
temperature and respiratory rate. Animals were housed in groups of two in cages with Aspen 11
chip bedding and sizzle nest (supplied by Datesand Limited). Dry pellet (Teklad Global Higher 12
Fibre Guinea-pig Diet 2041, Harlan UK Ltd) and water was offered ad libidum, fresh fruits and 13
vegetables daily and environmental enrichment was provided in the form of chew sticks. 14
Temperature was kept within 16-23°C and 12/12 hour light/dark cycles were maintained. 15
Guinea pigs were prepared under continuous sodium pentobarbitone anaesthesia as previously 16
described (Marks et al. 2012). Guinea pigs were artificially ventilated following a tracheotomy 17
and body temperature was controlled using a homeothermic blanket system. Catheters were 18
inserted to into the jugular veins for administration of drug and anaesthetic and for blood 19
sampling and the carotid arteries for monitoring left ventricular and arterial pressure and 20
contractility. Needle electrodes were placed in a lead II configuration for monitoring the ECG. 21
Guinea pigs were allowed to stabilise for 20 minutes following surgical preparation, monitored 22
continuously during anaesthesia and terminated by an overdose of pentobarbitone at the end of 23
the procedure. Lead II ECGs were monitored continuously by needle electrodes during a 20 24
minute stabilisation period followed by an intravenous infusion of three 15-minute ascending 25
doses and a 30-minute washout period. Exposure data were collected and 1 minute averages of 26
continuous ECG recordings extracted at 10 time points each. Doses, the achieved exposure and 27
the resulting change in QRS and PR interval durations are summarised in Table 1. 28
29
Details of the experimental setup for the dog telemetry assays are described by Prior et al. 30
(2009) and Bergenholm et al. (2016). Briefly, exposure and CV biomarkers were investigated 31
in conscious male beagle dogs (Dog Breeding Unit, Alderley Park, AstraZeneca, weight 11.2-32
18.3 kg, age 19-31 months) using cross-over study designs. Animals were housed in groups of 33
8 temperature was kept within 20±5°C and 12/12 hour light/dark cycles were maintained. Dry 1
pellet (350g SDS-Dog-D3(E) SQC diet (Special Diet Services Ltd) was offered in the 2
afternoon, water provided ad libitum and toys offered for environmental enrichment. Cardiac 3
effects were monitored using telemetry devices (DSI® PhysioTel) surgically implanted under 4
anaesthesia prior to this study as previously described (Prior et al., 2009). The telemetry 5
transmitter had been placed in the abdominal muscle and the ECG electrodes sutured in a lead 6
II configuration across the chest. A minimum of four weeks recovery was allowed between 7
surgery and each study. Animal welfare was monitored using CCTV cameras, by examining 8
all animals for abnormal signs prior to the start of dosing and at each blood sampling time 9
point, and by recording food consumption. Four dogs were orally administered vehicle and 10
each treatment dose in single ascending doses separated by 2-5 days. ECG were extracted as 11
mean values of 5 ECG complexes and exposure collected from 1h pre-dose and at 13 (CV) or 12
6 (exposure) time points up to 24h post-dose. Doses, achieved exposure and resulting change 13
in QRS and PR interval durations are summarised in Table 1. 14
15
The relationships between drug concentration and hNav1.5 inhibition were simulated 16
using estimates of concentrations at 50% inhibition (IC50) and Hill coefficients (γ) measured
17
by automated IonWorks electrophysiology using hNav1.5 transfected Chinese hamster ovary 18
cells (Harmer et al., 2008). This assay is routinely conducted at AstraZeneca, and was 19
consistently evaluated at 8 concentrations using physiological pacing rates (3 Hz) for all 20
compounds. Compound interactions with human Cav1.2 were studied by automated 21
electrophysiology (Morton and Main, 2013; Morton et al., 2014) and with brain Cav1.2 from 22
male Wistar rats by radioligand binding to the diltiazem, verapamil and nifedipine sites 23
(Morton et al., 2014) (Table 1). Data from both assays and all binding sites were initially 24
explored, and the estimated concentrations at 50% binding to the diltiazem site (Ki) were
25
chosen to simulate in vitro Cav1.2 effects based on these initial results and the findings by 26
Morton and colleagues (Morton et al., 2014). 27
28
Clinical data 29
Exposure, QRS and PR intervals following AZD1305 treatment were collected from a 30
randomised, double-blinded and placebo-controlled phase I study in 29 healthy male 31
volunteers. Subjects were assigned to a dose group and thereafter randomised to placebo or 32
9 Declaration of Helsinki, is consistent with the International Conference on Harmonisation 1
(ICH)/Good Clinical Practice. Details of this clinical study are described elsewhere (Parkinson 2
et al., 2013). Healthy volunteers were administered two separate doses of placebo or AZD1305 3
(six oral doses (10-500 mg) and two iv doses (10 and 70 mg)). Lead II ECGs were monitored 4
continuously and extracted at baseline and at 18 specific time points and plasma samples were 5
taken pre-dose and at 14 time points within 24 hours following dose administration. 6
Literature searches were conducted in Pubmed to identify the clinical effects of 7
flecainide, quinidine and verapamil on QRS and PR. Search criteria and references to the 8
identified studies are described in Supplementary materials 1. Measured individual 9
exposures together with QRS and PR intervals over time or at pre-dose were rarely reported. 10
Therefore, associated pairs of exposure and QRS and PR change from baseline were collected, 11
such as pairs of maximal exposure and effect or exposure and effect sampled at the same time 12
point. Information in text, tables and/or figures was used to extract the data and percentage 13
change in QRS or PR intervals was converted to change in ms. Collected additional information 14
included number of subjects, dose, route of administration, dosing history and if the subjects 15
were healthy volunteers or patients. Studies of verapamil effects following iv administration 16
were excluded to increase consistency with dog data as verapamil more potently induces PR 17
prolongations following iv compared to oral administration (Reiter et al., 1982), primarily due 18
to different metabolism and potency of its two enantiomers (Echizen et al., 1985a, 1985b). 19
20
Plasma protein binding 21
Free (unbound) plasma concentrations were calculated using in vitro estimates of plasma 22
protein binding (PPB) for each compound in guinea pig, dog and human plasma by a standard 23
equilibrium dialysis method (Banker et al., 2003) for all compounds except flecainide, where 24
dog PPB was acquired from Heath et al. (2011). Unbound fractions originated from AZ 25
laboratories, contracting laboratories and literature sources. 26
27
Nonclinical to clinical translation 28
Two approaches were adopted to quantify the translational relationships between nonclinical 29
effects and clinical QRS and PR prolongations (Figure 1). 30
31
10 Empirical translational relationships between in vitro, guinea pig or dog effects and 1
effects in humans were investigated for the anti-arrhythmic compounds AZD1305, flecainide, 2
quinidine and verapamil, following the approach visualised in Figure 1A. 3
Exposure-effect relationships for each compound were characterised in each species 4
using PKPD modelling (all guinea pig and dog data, clinical AZD1305 data) or nonlinear 5
regression (clinical literature data for flecainide, quinidine and verapamil). Monolix 4.3.2 6
(Lixoft) and MATLAB 2013b (The MathWorks) were used to develop and analyse the models. 7
Detailed methods are described in Bergenholm et al., (2016) (dog PKPD models), 8
Supplementary materials 1 (human regression models) and in Supplementary materials 2 9
(guinea pig and human PKPD models). Briefly, a model was developed to describe baseline 10
and drug-induced effects on QRS and PR intervals for each compound in each species. A single 11
phase cosine function was applied to describe potential circadian variations and an RR interval 12
correction model was applied to describe potential changes due to heart rate variations, both at 13
baseline and due to drug effects. Direct and delayed (effect compartment) proportional and 14
Emax drug effect models were evaluated. Estimated drug effect parameters were extracted from
15
the selected models to simulate the predicted change from baseline. Assuming no uncertainty 16
in the baseline was required as this information was not available for the literature models. Ion 17
channel effects were simulated using the collected in vitro parameters. 18
The resulting exposure-effect models and the in vitro models were used to simulate QRS 19
or PR prolongations, hNav1.5 inhibition or rCav1.2 binding at 100 evenly spaced, matched 20
concentrations within the supported concentration ranges. Each translation was investigated at 21
matching total and unbound concentrations by converting the estimated drug effect parameters 22
accordingly, and in millisecond and percentage change from baseline by scaling the simulated 23
responses. Uncertainty and variability in the estimated drug effects were estimated and 24
visualised by 95% confidence intervals (CIs) for the typical effects and prediction intervals 25
(PIs) for new observations. The CIs provide a range for the estimated average drug effects as 26
predicted by the model, and are useful for cross-species translation as they represent the typical 27
behaviour. As CIs represent uncertainty in typical effects, they get tighter as the amount of data 28
increases. PIs provide a range for new observations, take both variability and residuals into 29
account, and do not get smaller when the amount of data increases. PIs are therefore wider than 30
CIs, and of importance to predict new data. For the population PKPD models, the CIs and PIs 31
were generated using Monte Carlo methods. CIs were constructed from the covariance matrices 32
of the typical parameters for the PD drug effects and PIs from the estimated typical parameters, 33
11 sets were simulated and sorted at each concentration, and the 2.5th and 97.5th percentiles were 1
extracted. Non-physiological parameter values (e.g., EC50 below 0) were removed. CIs and PIs
2
for the regression models based on literature data were produced using the built-in Matlab 3
function predict. 4
Predicted in vitro, guinea pig and dog effects were plotted against the predicted human 5
effect at matched total and unbound concentrations to visualise the translations for each 6
compound. Nonclinical effects corresponding to a 10% change in humans were extracted. 7
8
Translation method 2: Middle-out (semi-mechanistic) translation 9
A middle-out translation method was applied to quantify the in vitro to clinical translation, 10
where a mathematical description for the translational relationship was assumed and quantified. 11
AZD1305 was selected for this analysis as high-quality, high-resolution clinical data were 12
available, rather than the literature analyses combining many studies. In vitro and clinical 13
AZD1305 data were combined to estimate the signal transductions from effects at the ion 14
channel level to clinical QRS or PR prolongations using the operational model of agonism 15
(Black and Leff, 1983) as visualised in Figure 1B. The model was applied according to 16
17
∆𝐸𝐶𝐺𝑑 =
𝐸𝑚(𝜏𝑐𝑒,𝑢𝛾)𝑛
(𝐾𝑑𝛾+ 𝑐𝑒,𝑢𝛾)𝑛+ (𝜏𝑐
𝑒,𝑢𝛾)𝑛 (1)
18
where ce,u is the predicted unbound drug concentration in the effect compartment, Kd the
19
concentration at 50% bound or inhibited receptor, γ the Hill factor of the drug-ion channel 20
interaction, Em the maximal QRS or PR prolongations possible in the system, τ the transducer
21
ratio and n the exponent of the sigmoidal relationship between bound/inhibited ion channel and 22
QRS or PR prolongation. The transducer ratio τ is the ratio of the maximum inhibited/bound 23
ion channels to the inhibited/bound ion channels corresponding to the half-maximum response. 24
The Em values could not be estimated from the AZD1305 data, as maximum prolongations
25
were not reached causing practical identifiability issues. To allow estimation of the remaining 26
parameters, the Em values were therefore fixed. A range of Em values (20-100 ms) was
27
investigated by performing parameter estimation and simulating the resulting models. Kd and
28
γ were fixed to the in vitro estimates describing the ion channel inhibition or binding. Also, 29
baseline variability was minimised as described in Supplementary materials 2 and an effect 30
compartment was applied to account for the short delay between exposure and QRS and PR 31
12 The operational model was developed using in vitro and high-quality phase I clinical data 1
for AZD1305. As the operational model has been shown to be structurally identifiable (Janzen 2
et al. 2016), and assuming that the mechanisms of new compounds are similar, the system-3
specific parameters of this model (Em, τ and n) may be fixed and effects of such compounds
4
predicted by incorporating the in vitro potency (Kd and γ) of the new compounds. Such
5
predictions were produced for flecainide, quinidine and verapamil by combining their specific 6
in vitro potencies with the estimated systems parameters. These predictions were then 7
compared to the collected QRS and PR prolongation data from the literature study. This can be 8
viewed as a form of validation of the system-specific parameters, as this evaluates the 9
performance of the system model to predict new data on which it was not trained. 10
Finally, the systems parameters were used to predict QRS and PR prolongations at 0-11
100% inhibition/binding and generate 95% confidence intervals for this relationship using 12
Monte Carlo methods similar to the PKPD models. Also, percentage inhibition/binding 13
corresponding to 10% QRS or PR prolongations were extracted. 14
15
Nomenclature of Targets and Ligands 16
Key protein targets and ligands in this article are hyperlinked to corresponding entries in 17
http://www.guidetopharmacology.org, the common portal for data from the IUPHAR/BPS 18
Guide to PHARMACOLOGY (Southan et al., 2016), and are permanently archived in the 19
Concise Guide to PHARMACOLOGY 2015/16 (Alexander et al., 2015). 20
21
RESULTS
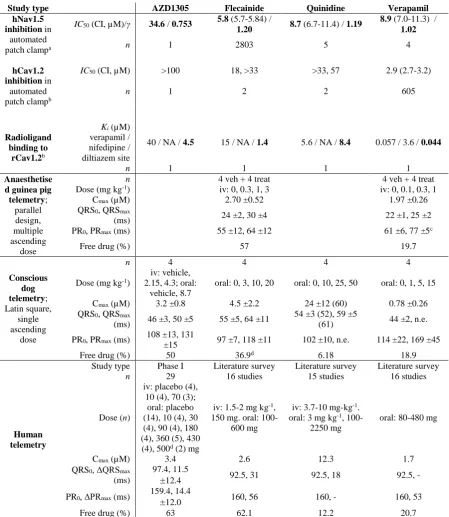
22Nonclinical and clinical data 23
The acquired data are summarised in Table 1, including effects of the investigated compounds 24
on Nav1.5 and Cav1.2 in vitro and QRS and PR intervals in humans, dogs and guinea pigs. 25
Changes in heart rate and blood pressure were also observed. Both were slightly increased 26
following AZD1305 treatment in dogs and humans and decreased following quinidine, 27
flecainide and verapamil treatment in dogs and verapamil treatment in guinea pigs, while only 28
heart rate was decreased following flecainide treatment in guinea pigs. 29
30
Translation to QRS complex widening in humans
31
13 Translation method 1: Top-down translation to clinical QRS widening
1
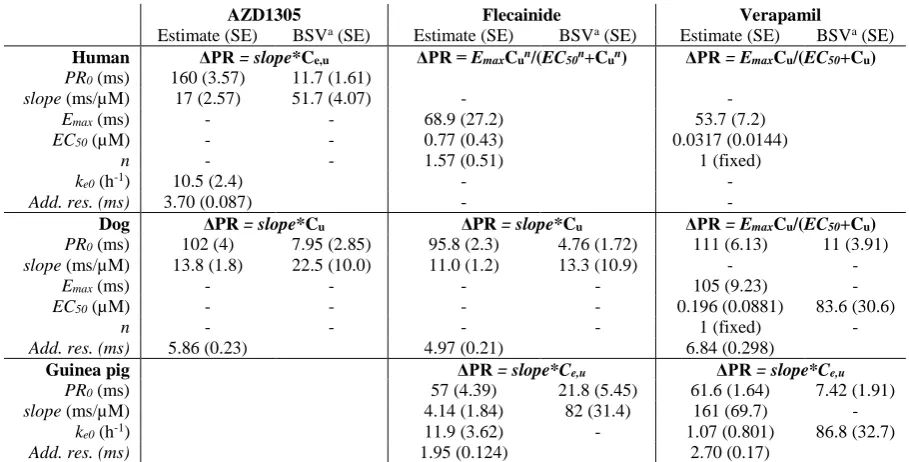
PKPD or regression models were developed to describe drug-induced QRS effects for all 2
compounds, and the parameters describing the drug effects were extracted and simulated to 3
generate the CIs and PIs (Figure 2, Table 2). QRS effects of AZD1305, flecainide and 4
quinidine were described by proportional models in dogs, while effects of flecainide in guinea 5
pigs were better described by an effect compartment power model. QRS prolongations by 6
AZD1305 and quinidine in humans were captured by proportional models, while a sigmoid 7
model better described the larger prolongations reached following treatment with flecainide. 8
The wide PIs indicate large variability and residuals in the data sets. Details of the PKPD and 9
regression modelling results are described in Supplementary materials 1 (human regression 10
models) and Supplementary materials 2 (human and guinea pig PKPD models) and in 11
Bergenholm et al. (2016) (dog PKPD models). 12
Simulated QRS widenings in humans were plotted against in vitro and in vivo effects at 13
matched total or unbound exposures to visualise the translational relationships for each 14
compound. Uncertainty in the mean predictions and variability in the data were visualised by 15
overlaying the CIs and PIs, respectively. Nonclinical effects corresponding to 10% QRS 16
widening in humans were extracted. Typical QRS widenings of 10% occurred at unbound 17
concentrations corresponding to 3-7% (CI range 2-9%) hNav1.5 inhibition in vitro (Figure 18
3A). This indicates that conduction liabilities may occur well below the IC50 of a compound,
19
where Hill factors have large impact. Hill factors were 0.75-1.2 for the investigated 20
compounds. Assuming Hill factors of 1 resulted in considerably less consistent translational 21
relationships (2-10% hNav1.5 inhibition compared to 3-7% when Hill factors were included). 22
CIs for AZD1305 and quinidine were overlapping, whilst QRS widening by flecainide were 23
larger at equal in vitro changes. Accounting for the fractions unbound was vital for consistent 24
in vitro to human translational relationships between the compounds. 25
For the in vivo to clinical translations, 10 % QRS widening in humans corresponded to 4.6 % 26
(CI range: 2.1-9.9) in guinea pig (Figure 3B) and 2.3-3.3 % (CI range: 0.8-4.5) in dog (Figure 27
3C) at matched total concentrations. The confidence intervals for all three compounds 28
overlapped for the dog to human translation. The guinea pig to human translation was only 29
investigated for flecainide and therefore has lower confidence compared to dogs. Higher 30
sensitivity to detect flecainide changes was observed in guinea pigs compared to dogs, while 31
humans were the most sensitive. QRS interval baselines were shorter in guinea pigs and dogs 32
14 further increased the translational gap. Similar results were acquired for translating effects of 1
total and unbound drug in vivo as PPB fractions were similar between the species. 2
3
Translation method 2: Middle-out translation to clinical QRS widening Identifiability issues 4
led to high correlation between Em and τ, and was solved by fixing Em. Goodness of fit values
5
were improved when Em was increased from 20 ms to 40 ms, and remained similar up to 100
6
ms. Simulations of optimised models with fixed Em values between 40 and 100 ms showed
7
similar predictions up to 20 ms change (Figure in Supplementary Materials 3). As widenings 8
above 20 ms are unlikely to occur in a safety setting (by a drug not intended to cause QRS 9
widening), and highest observed widenings for all investigated compounds were 31 ms, an Em
10
value of 40 ms was selected. The selected value for Em influenced the estimated value for τ.
11
The operational model with Em = 40 ms well described AZD1305-induced QRS widenings
12
(Figure 4A). Final estimates for τ was high (8.0±0.4), suggesting an efficient signal 13
transduction with some signal amplification, as the exponent n was larger than 1 (1.5±0.1). 14
Baseline and effect compartment parameters were similar to the estimated values in the PKPD 15
models (Supplementary materials 2). 16
In order to test whether the systems properties of AZD1305 could be used in the 17
prediction of other compounds, the systems parameters were combined with in vitro potency 18
parameters for flecainide and quinidine and used to predict the QRS widening of these 19
compounds in the measured range of unbound concentrations (Figure 4B). QRS widenings 20
induced by quinidine were well predicted while flecainide effects were slightly under-21
predicted. 22
The translational relationship between inhibited hNav1.5 and QRS widening in humans 23
was simulated and the CIs and PIs generated (Figure 4C). These results indicate that only 6% 24
(CI range: 5-7%) inhibition of hNav1.5is required to induce 10% QRS widening. 25
26
Translation to PR interval prolongation in humans 27
Translation method 1: Top-down translation to clinical PR prolongation 28
PKPD or regression models were developed to describe drug-induced PR effects for all 29
compounds, and the parameters describing the drug effects were extracted and simulated to 30
generate CIs and PIs (Figure 5, Table 3). PR effects of AZD1305 and flecainide in dogs were 31
described by proportional models and verapamil by an Emax model, and effects of flecainide
32
and verapamil in guinea pigs were described by effect compartment proportional models. PR 33
15 or Emax models better described the larger prolongations reached following treatment with
1
flecainide or verapamil. The wide PIs indicate large variability in the data sets. Details of the 2
PKPD and regression modelling results are described in Supplementary materials 1 (human 3
regression models) and Supplementary materials 2 (human and guinea pig PKPD models) 4
and in Bergenholm et al. (2016) (dog PKPD models). 5
6
Simulated PR prolongations in humans were plotted against in vitro and in vivo effects 7
at matched total or unbound exposures to visualise the translational relationships for each 8
compound. Nonclinical effects corresponding to 10% PR prolongation in humans were 9
extracted. Typical PR prolongations of 10% occurred at unbound concentrations corresponding 10
to 13-21% (CI range 8-24%) rCav1.2 binding at the diltiazem site in vitro (Figure 6A). PR 11
prolongations by verapamil were slightly larger compared to AZD1305 and flecainide at equal 12
in vitro effects, although the CIs were largely overlapping. Accounting for the PPB was vital 13
for consistent in vitro to human translational relationships between the compounds. 14
For the in vivo to clinical translations, 10 % PR prolongation in humans corresponded to 15
a 2.3-4.3 % change in guinea pigs (CI range: 0.3-7.6) (Figure 6B) and 2.4-10 % change in dogs 16
(CI range: 1.9-28) (Figure 6C) at matched total concentrations. The CIs for flecainide and 17
verapamil overlapped for the guinea pig to human translations and for AZD1305 and verapamil 18
for the dog to human translations, whilst PR prolongations by flecainide were larger in humans 19
for equal prolongations in dogs. Different administration routes were used, and may primarily 20
have influenced the guinea pig to human translation of verapamil, as iv infusion of verapamil 21
induces more PR prolongation in humans compared to oral administration (Reiter et al., 22
1982).Typical PR interval point baselines were 170 ms in humans, 103 ms in dogs (61 % of 23
human) and 62 ms in guinea pigs (37 % of human), and absolute differences between effects 24
in guinea pigs, dogs and humans were thus larger than relative differences. Similar results were 25
acquired for translating effects of total and unbound drug in vivo as PPB fractions were similar 26
between the species. 27
28
Translation method 2: Middle-out translation to clinical PR prolongation Practical 29
identifiability issues led to high correlation between Em and τ, and was solved by fixing Em.
30
Similar results were obtained, where simulations of optimised models with fixed Em values
31
between 40 and 100 ms showed similar predictions up to 30 ms change (Figure in 32
Supplementary Materials 3). As highest observed prolongations for all investigated compounds 33
were 56 ms, an Em value of 60 ms was selected. The operational model with Em = 60 ms well
16 described AZD1305-induced PR prolongations (Figure 7A) although the high variability in 1
the data led to wider CIs and PIs compared to the QRS model. The final estimate for the system 2
parameter τ was lower for PR compared to QRS and with larger uncertainty (4.0±0.7 vs. 3
8.0±0.4), reflecting a less efficient signal transduction and reduced precision due to the more 4
variable data. The exponent n was estimated to be 2.1±0.2, suggesting some signal 5
amplification. Baseline and effect compartment parameters were similar to the estimated values 6
in the PKPD models (Supplementary materials 2 and 3). 7
The systems parameters were combined with in vitro potency parameters for flecainide 8
and verapamil and used to predict the PR prolongation of these compounds in the measured 9
range of unbound concentrations (Figure 7B). To account for the different potency and 10
metabolism of the two verapamil enantiomers (Echizen et al., 1985a, 1985b), the efficacy of 11
verapamil was assumed to be mediated only by the more potent S enantiomer. The estimated 12
Ki for verapamil of 0.044 µM was therefore corrected to account to the predicted enantiomer
13
composition in vivo by Ki,invivo = Ki*0.5/0.18 (fraction S enantiomer in vitro/fraction S
14
enantiomer in vivo; human verapamil ratio: Echizen, Vogelgesang, et al. 1985). PR 15
prolongations induced by flecainide were slightly over-predicted while verapamil effects were 16
well predicted by the model. 17
The translational relationship between bound rCav1.2 and PR prolongation in humans 18
was simulated and the CIs and PIs generated (Figure 7C). These results predict that 15% (CI 19
range: 12-22%) binding of rCav1.2 at the diltiazem site is required to induce 10% PR 20
prolongation. 21
22
DISCUSSION AND CONCLUSIONS
23Small in vitro interactions lead to relevant QRS/PR prolongations 24
Translation between in vitro effects and QRS/PR change in humans show that relatively low 25
hNav1.5 inhibition (3-7%) and rCav1.2 binding (13-21%) correlate with 10% QRS/PR change 26
(Figure 3A and 6A). Translation using the middle-out approach resulted in similar thresholds, 27
strengthening the confidence in the predicted relationships. Since only low inhibition/binding 28
is necessary to induce human QRS/PR changes, using IC50 in margin calculations may over-
29
or understate risk when Hill (sigmoidicity) factors are different from 1, as Hill factors have a 30
high impact at these inhibition levels. For example, 10 % inhibition occurs at concentrations 9 31
times lower than IC50 with a Hill factor of 1, but only 4 times lower with a Hill factor of 1.5.
32
17 therefore provide safer margins, such as 5% hNav1.5 inhibition and 15% rCav1.2 binding. 1
However, technical issues may lead to difficulties measuring these relatively small inhibition 2
levels and to large variability in the range of IC5-IC15 compared to IC50. Considering the full
3
concentration-response curve is therefore important, and extrapolation from IC50 values as has
4
been done for unbound Cmax and hERG channel inhibition (Redfern et al., 2003) may be
5
necessary. 6
In vitro to clinical translations to human QRS widenings were highly consistent, although 7
QRS widening by flecainide was higher at similar inhibition levels compared to AZD1305 and 8
quinidine (Figure 3A). This reflects the mechanisms of action of type 1a and 1c 9
antiarrhythmics (quinidine and flecainide, respectively), which bind to the open state of Nav1.5 10
(Hondeghem, 1987) and dissociate to the closed states with different rates. Flecainide 11
dissociates slower compared to quinidine (>1500 ms vs. 300-1500ms, Wilde 1998), leading to 12
increased accumulation of Nav1.5 block between heart beats. More Nav1.5 block therefore 13
remains at the beginning of each action potential, causing more QRS widening. 14
Translation of in vitro effects to clinical PR prolongations were relatively consistent 15
between the investigated compounds. Similar inhibition levels resulted in larger PR 16
prolongations for verapamil, possibly resulting from differences in the selectivity of the 17
compounds towards additional binding sites on Cav1.2, as verapamil binds to the verapamil 18
site on Cav1.2 in addition to the diltiazem site (Table 1). Also, while QRS prolongations are 19
strongly linked to the block of a single ion channel, multiple mechanisms contribute to 20
AZD1305-, flecainide- and verapamil-induced PR prolongations that were not taken into 21
account in this work. For example, AZD1305 and flecainide prolong the P wave (by Nav1.5 22
block) and flecainide also reduces intra-cellular Ca2+ release (Bannister et al., 2015; Watanabe
23
et al., 2009). 24
While the top-down in vitro to clinical relationships provide predictions of human effects 25
at specific in vitro levels such as the predicted therapeutic Cmax, they cannot directly be used to
26
predict effects at full PK curves. However, this is possible with the semi-mechanistic approach 27
using the estimated system parameters in combination with in vitro (unbound) potency. Such 28
predictions may be used to predict exposure-effect relationships as exemplified in Figure 4B 29
and Figure 7B, or alternatively over time simulating QRS/PR effects at a predicted PK. While 30
large QRS/PR effects may be under-predicted due to the assumed maximal (Em) values, such
31
large side effects are unlikely to occur. This approach may also be used to combine all available 32
18 effects of unknown entities. The approach has yet to be proven by predicting clinical PR and 1
QRS change using preclinical data of an unknown entity. 2
QRS and PR prolongations are smaller in dogs and guinea pigs compared to humans 3
The translational relationships for QRS/PR effects demonstrated smaller changes at 4
matched exposures in the nonclinical species compared to humans. However, across 5
compounds, the effects were consistent, especially for QRS where low percent changes were 6
3-4 times larger in humans compared to dogs. PR translations were more variable, with human 7
changes 1-4 times larger compared to dogs. Fewer compounds were investigated in guinea 8
pigs, reducing the confidence in these results and limiting the possibility to evaluate the 9
consistency in the translation between compounds. However, guinea pigs did show similar 10
trends as dogs, with lower sensitivity compared to humans. 11
It is important to note that the levels of effects in dogs and guinea pigs that correspond 12
to meaningful clinical changes of 10% (2-5% for QRS, 2-10% for PR) are well below the effect 13
levels that these studies are typically powered for (guinea pig: 19/21% QRS/PR, Marks et al., 14
2012). However, this power analysis is based on point-wise statistics, whereas employing a 15
PKPD modelling approach increases sensitivity and specificity (Gotta et al., 2015) as all dose 16
levels and time points are used simultaneously. Conducting PKPD modelling of nonclinical in 17
vivo data as a routine analysis is therefore recommended to improve power to identify small 18
QRS/PR effects. Furthermore, nonclinical effects should be evaluated well above the expected 19
therapeutic exposure to ensure that potential side effects in cardiac conduction are developed. 20
21
Possible mechanisms for the reduced sensitivity of dogs and guinea pigs 22
Anatomically, guinea pig and dog hearts are 300 and 6 times lighter than human hearts 23
(Joseph, 1908) and have smaller specialised tissues, e.g. AV node (reviewed in Abolghassem, 24
2009) resulting in shorter QRS and PR intervals. Therefore, evaluating relative rather than 25
absolute changes from baseline reduces the translational gap between guinea pigs, dogs and 26
humans. 27
A major assumption is that the in vitro, in vivo and clinical (unbound) plasma 28
concentrations all are equivalent to the target tissue exposure. For these compounds, the same 29
fraction unbound was applied as the measured PPBs were similar across species, and 30
considered to be within the variability of the assay. However, small errors in these fractions 31
have direct impact on the translational relationships, and high quality data of the free fractions 32
in each species could potentially improve precision in the translational relationships. Errors in 33
19 sites may also differ between species due to differences in the distribution to the heart tissue 1
and intra-cellular targets. 2
The reduced sensitivity of guinea pigs and dogs to conduction slowing is likely to be 3
present at the tissue level as flecainide and quinidine reduce the depolarisation rate more in 4
human atrial tissue compared to guinea pig, rabbit and dog (Wang et al., 1990). It is not known 5
if in vitro studies using guinea pig and dog Nav/Cav would indicate reduced potency compared 6
to human Nav/Cav. Cav1.2 is multi-functional with many splice variants (Hofmann et al., 7
2014) which could potentially differ between species. 94-98% amino acid homology of Nav1.5 8
between mice, rats, pigs and humans (Zimmer et al. 2002; Blechschmidt et al. 2008) indicate 9
that Nav1.5 is highly conserved between species. However, the relative quantity of different 10
isoforms of Nav vary throughout the conduction system (reviewed in Haufe, Chamberland, & 11
Dumaine, 2007) and between species (Blechschmidt et al., 2008). Also the density of other ion 12
channels may contribute to the differences in sensitivity. This has been suggested for QT 13
prolongation, where higher densities of Kir2.1 and Kmin in dogs increase the repolarisation 14
reserve, reducing repolarisation slowing due to ERG block (Jost et al., 2013). Thus, conduction 15
slowing may differ between species partly due to differences in the relative quantity of ion 16
channel isoforms and splice variants. 17
18
Limitations 19
One major limitation of this work is the low number of compounds investigated the translation 20
to human effects for each endpoint (3 for the in vitro and the in vivo dog and 1-2 for the in vivo 21
guinea pig). Historical studies were used for this analysis, and the number of compounds were 22
therefore limited by the availability of sufficient data in the investigated models. The low 23
number of compounds is a consequence of that compounds with potency against these targets 24
are typically screened out prior to in vivo and clinical studies. Also, the data sets were 25
incomplete as data for 2 of the test compounds were not available in guinea pig. Although these 26
limitations may be partly overcome by strengthening each individual translation by applying 27
all in vitro and in vivo relationships suggested in this work, additional investigations into these 28
translational relationships are important to increase confidence in human predictions. All in 29
vivo studies were conducted with small group sizes of at the most four animals per treatment 30
group. However, applying PKPD modelling to analyse these data allow simultaneous analysis 31
of data across treatments and time points, thus increasing both sensitivity and specificity of the 32
analysis (Gotta et al. 2015). 33
20 Applying the translational relationships to reduce conduction liabilities
1
Prior to this study, no quantitative information was available on the relative sensitivity to 2
drug-induced QRS/PR effects in nonclinical species and humans. Although this study is limited 3
by the low number of investigated compounds, it provides a starting point for nonclinical 4
assessment of conduction liabilities and predictions to humans. Improved sensitivity to detect 5
potential liabilities of compounds in drug discovery can reduce animal use, as potentially 6
unsafe drugs can be discontinued at an earlier stage, with clear relevance for the replacement, 7
refinement or reduction (the 3Rs). Compounds with different mechanisms of action were 8
investigated to account for possible compound-specific differences and to achieve a broader 9
applicability of the recommendations and translational relationships of this work. Despite the 10
relatively consistent in vitro to clinical translations for the investigated compounds, the 11
influence of drug-ion channel kinetics and other mechanisms on QRS/PR prolongations 12
highlight the importance of also evaluating drug effects in vivo. 13
This study has not defined a threshold for clinical QRS/PR effects that should be avoided, 14
but has considered a 10% change in humans to be meaningful and then observed what the 15
nonclinical in vitro or in vivo change was at matched concentrations. Resulting nonclinical 16
changes at 10% or any preferred level of change in humans (Figure 3 and Figure 6) may be 17
used as first attempts to define margins for acceptable effects at expected unbound therapeutic 18
concentrations, to be easily applied in early in vitro and in vivo safety assessment. Before FTIM 19
studies, a more in-depth assessment of the therapeutic dose range may be required, such as 20
clinical simulations of PR/QRS change over time using the predicted human PK. Percent 21
QRS/PR change was up to four times larger in humans compared to guinea pigs and dogs. This 22
suggests that worst case human QRS/PR effects may be predicted by simulating four times 23
larger slopes compared to dogs and guinea pigs, while also accounting for baseline and protein 24
binding differences. To include a measure of uncertainty, a best case scenario may also be 25
predicted by a two times larger (QRS) or the same (PR) slope. Although small distributional 26
delays may be present, QRS and PR effects are likely to be well approximated by a direct effect 27
model. In addition, the in vitro system models can complete the risk assessment by predicting 28
QRS/PR effects at the predicted PK. Considering the small compound set (1-3 compounds per 29
nonclinical assay and endpoint), additional analyses should be conducted to strengthen the 30
suggested nonclinical margins and translational relationships. Several independent predictions 31
of clinical effects provides additional confidence and any discordance offers a measure of the 32
uncertainty regarding the human prediction. Therefore, a combined view applying information 33
21 using the preliminary translational relationships suggested in this work to build on an integrated 1
22
Author Contributions
1
L Bergenholm, J Parkinson, N D Evans, M J Chappell and T Collins participated in the 2
design of the modelling research study. 3
L Bergenholm, J Parkinson and T Collins acquired the data. 4
L Bergenholm performed the literature survey. 5
L Bergenholm performed the PKPD and translational modelling research. 6
All (L Bergenholm, J Parkinson, J Mettetal, N D Evans, M J Chappell and T Collins) 7
participated in analysing the results. 8
All (L Bergenholm, J Parkinson, J Mettetal, N D Evans, M J Chappell and T Collins) 9
participated in writing the manuscript. 10
23
Acknowledgements
1
This work is funded through the Marie Curie FP7 People ITN European Industrial 2
Doctorate (EID) project No.316736, IMPACT (Innovative Modelling for Pharmacological 3
Advances through Collaborative Training). The authors would like to thank the AstraZeneca 4
project teams that generated the nonclinical and clinical data used in this work and Drs Alex 5
Harmer, Chris Pollard, Corina Dota, Mike Rolf and Torbjörn Vik for their valuable support to 6
this project. 7
8
9
Conflicts of interest
10
None. 11
12
24
References
1
Abolghassem, N., 2009. A concise review on the anatomy of the atrioventricular node in mammals.
2
Iran. J. Vet. Sci. Technol. 1, 1–10.
3
Banker, M.J., Clark, T.H., Williams, J.A., 2003. Development and Validation of a 96-Well
4
Equilibrium Dialysis Apparatus for Measuring Plasma Protein Binding 92, 967–974.
5
Bannister, M.L., Thomas, N.L., Sikkel, M.B., Mukherjee, S., Maxwell, C., MacLeod, K.T., George,
6
C.H., Williams, A.J., 2015. The mechanism of flecainide action in CPVT does not involve a
7
direct effect on RyR2. Circ. Res. 116, 1324–1335. doi:10.1161/CIRCRESAHA.116.305347
8
Bergenholm, L., Collins, T., Evans, N.D., Chappell, M.J., Parkinson, J., 2016. PKPD modelling of PR
9
and QRS intervals in conscious dogs using standard safety pharmacology data. J. Pharmacol.
10
Toxicol. Methods 79, 34–44. doi:10.1016/j.vascn.2016.01.002
11
Black, J.W., Leff, P., 1983. Operational Models of Pharmacological Agonism. Proc. R. Soc. B Biol.
12
Sci. 220, 141–162. doi:10.1098/rspb.1983.0093
13
Blechschmidt, S., Haufe, V., Benndorf, K., Zimmer, T., 2008. Voltage-gated Na+ channel transcript
14
patterns in the mammalian heart are species-dependent. Prog. Biophys. Mol. Biol. 98, 309–318.
15
doi:10.1016/j.pbiomolbio.2009.01.009
16
Cao, X., Lee, Y.T., Holmqvist, M., Lin, Y., Ni, Y., Mikhailov, D., Zhang, H., Hogan, C., Zhou, L.,
17
Lu, Q., Digan, M.E., Urban, L., Erdemli, G., 2010. Cardiac ion channel safety profiling on the
18
IonWorks Quattro automated patch clamp system. Assay Drug Dev. Technol. 8, 766–780.
19
doi:10.1089/adt.2010.0333
20
Chain, A., Dubois, V., Danhof, M., Sturkenboom, M., Della Pasqua, O., 2013. Identifying the
21
translational gap in the evaluation of drug-induced QTc-interval prolongation. Br. J. Clin.
22
Pharmacol. doi:10.1111/bcp.12082
23
Cheng, S., Keyes, M.J., Larson, M.G., Mccabe, E.L., Newton-Cheh, C., Levy, D., Benjamin, E.J.,
24
Wang, T.J., Vasan, R.S., 2009. Long-term outcomes in individuals with prolonged PR interval
25
or first-degree atrioventricular block. JAMA 301, 2571–7. doi:10.1001/jama.2009.888
26
Cordes, J., Li, C., Dugas, J., Austin-LaFrance, R., Lightbown, I., Engwall, M., Sutton, M.,
Steidl-27
Nichols, J., 2009. Translation between in vitro inhibition of the cardiac Nav1.5 channel and
pre-28
clinical and clinical QRS widening. J. Pharmacol. Toxicol. Methods 60, 221.
29
doi:10.1016/j.vascn.2009.04.059
30
Cros, C., Skinner, M., Moors, J., Lainee, P., Valentin, J.P., 2012. Detecting drug-induced
31
prolongation of the QRS complex: new insights for cardiac safety assessment. Toxicol. Appl.
32
Pharmacol. 265, 200–8. doi:10.1016/j.taap.2012.10.007
33
Echizen, H., Brecht, T., Niedergesäss, S., Vogelgesang, B., Eichelbaum, M., 1985a. The effect of
34
dextro-, levo-, and racemic verapamil on atrioventricular conduction in humans. Am. Heart J.
35
109, 210–217. doi:10.1016/0002-8703(85)90585-X
36
Echizen, H., Vogelgesang, B., Eichelbaum, M., 1985b. Effects of d,l-verapamil on atrioventricular
37
conduction in relation to its stereoselective first-pass metabolism. Clin. Pharmacol. Ther. 38,
38
71–76. doi:0009-9236(85)90142-0 [pii]
25
Erdemli, G., Kim, A.M., Ju, H., Springer, C., Penland, R.C., Hoffmann, P.K., 2012. Cardiac Safety
1
Implications of hNav1.5 Blockade and a Framework for Pre-Clinical Evaluation. Front.
2
Pharmacol. 3, 6. doi:10.3389/fphar.2012.00006
3
Gintant, G., 2011. An evaluation of hERG current assay performance: Translating preclinical safety
4
studies to clinical QT prolongation. Pharmacol. Ther. 129, 109–19.
5
doi:10.1016/j.pharmthera.2010.08.008
6
Gintant, G. a, Gallacher, D.J., Pugsley, M.K., 2011. The “overly-sensitive” heart: sodium channel
7
block and QRS interval prolongation. Br. J. Pharmacol. 164, 254–9.
doi:10.1111/j.1476-8
5381.2011.01433.x
9
Gotta, V., Cools, F., van Ammel, K., Gallacher, D.J., Visser, S. a. G., Sannajust, F., Morissette, P.,
10
Danhof, M., van der Graaf, P.H., 2015. Sensitivity of pharmacokinetic-pharmacodynamic
11
analysis for detecting small magnitudes of QTc prolongation in preclinical safety testing. J.
12
Pharmacol. Toxicol. Methods 72, 1–10. doi:10.1016/j.vascn.2014.12.008
13
Harmer, a R., Valentin, J.-P., Pollard, C.E., 2011. On the relationship between block of the cardiac
14
Na+ channel and drug-induced prolongation of the QRS complex. Br. J. Pharmacol. 164, 260–
15
73. doi:10.1111/j.1476-5381.2011.01415.x
16
Harmer, A.R., Abi-Gerges, N., Easter, A., Woods, A., Lawrence, C.L., Small, B.G., Valentin, J.-P.,
17
Pollard, C.E., 2008. Optimisation and validation of a medium-throughput
electrophysiology-18
based hNav1.5 assay using IonWorks. J. Pharmacol. Toxicol. Methods 57, 30–41.
19
doi:10.1016/j.vascn.2007.09.002
20
Haufe, V., Chamberland, C., Dumaine, R., 2007. The promiscuous nature of the cardiac sodium
21
current. J. Mol. Cell. Cardiol. 42, 469–477. doi:10.1016/j.yjmcc.2006.12.005
22
Heath, B.M., Cui, Y., Worton, S., Lawton, B., Ward, G., Ballini, E., Doe, C.P. a, Ellis, C., Patel, B. a,
23
McMahon, N.C., 2011. Translation of flecainide- and mexiletine-induced cardiac sodium
24
channel inhibition and ventricular conduction slowing from nonclinical models to clinical. J.
25
Pharmacol. Toxicol. Methods 63, 258–68. doi:10.1016/j.vascn.2010.12.004
26
Hofmann, F., Flockerzi, V., Kahl, S., Wegener, J.W., 2014. L-Type CaV1.2 Calcium Channels: From
27
In Vitro Findings to In Vivo Function. Physiol. Rev. 94, 303–326.
28
doi:10.1152/physrev.00016.2013
29
Hondeghem, L.M., 1987. Antiarrhythmic agents: modulated receptor applications. Circulation 75,
30
514–20. doi:10.1161/01.CIR.75.3.514
31
Janzen, D.L.I., Bergenholm, L., Jirstrand, M., Parkinson, J., Yates, J., Evans, N.D., Chappell, M.J.,
32
Janzén, D.L.I., Bergenholm, L., Jirstrand, M., Parkinson, J., Yates, J., Evans, N.D., Chappell,
33
M.J., 2016. Parameter identifiability of fundamental pharmacodynamic models. Front. Physiol.
34
7, 1–12. doi:10.3389/fphys.2016.00590
35
Jonker, D.M., Kenna, L. a, Leishman, D., Wallis, R., Milligan, P. a, Jonsson, E.N., 2005. A
36
pharmacokinetic-pharmacodynamic model for the quantitative prediction of dofetilide clinical
37
QT prolongation from human ether-a-go-go-related gene current inhibition data. Clin.
38
Pharmacol. Ther. 77, 572–82. doi:10.1016/j.clpt.2005.02.004
39
Joseph, D.R., 1908. The ratio between heart-weight and body-weight in various animals. J. Exp. Med.
40
10, 521–8.
26
Jost, N., Virág, L., Comtois, P., Ordög, B., Szuts, V., Seprényi, G., Bitay, M., Kohajda, Z., Koncz, I.,
1
Nagy, N., Szél, T., Magyar, J., Kovács, M., Puskás, L.G., Lengyel, C., Wettwer, E., Ravens, U.,
2
Nánási, P.P., Papp, J.G., Varró, A., Nattel, S., 2013. Ionic mechanisms limiting cardiac
3
repolarization reserve in humans compared to dogs. J. Physiol. 591, 4189–206.
4
doi:10.1113/jphysiol.2013.261198
5
Kurl, S., Mäkikallio, T.H., Rautaharju, P., Kiviniemi, V., Laukkanen, J. a., 2012. Duration of QRS
6
complex in resting electrocardiogram is a predictor of sudden cardiac death in men. Circulation
7
125, 2588–2594. doi:10.1161/CIRCULATIONAHA.111.025577
8
Laverty, H., Benson, C., Cartwright, E., Cross, M., Garland, C., Hammond, T., Holloway, C.,
9
McMahon, N., Milligan, J., Park, B., Pirmohamed, M., Pollard, C., Radford, J., Roome, N.,
10
Sager, P., Singh, S., Suter, T., Suter, W., Trafford, a, Volders, P., Wallis, R., Weaver, R., York,
11
M., Valentin, J., 2011. How can we improve our understanding of cardiovascular safety
12
liabilities to develop safer medicines? Br. J. Pharmacol. 163, 675–93.
doi:10.1111/j.1476-13
5381.2011.01255.x
14
Marks, L., Borland, S., Philp, K., Ewart, L., Lainée, P., Skinner, M., Kirk, S., Valentin, J.-P., 2012.
15
The role of the anaesthetised guinea-pig in the preclinical cardiac safety evaluation of drug
16
candidate compounds. Toxicol. Appl. Pharmacol. 263, 171–183. doi:10.1016/j.taap.2012.06.007
17
Mcdermott, J.S., Salmen, H.J., Cox, B.F., Gintant, a, 2002. Importance of Species Selection in
18
Arrythmogenic Models of Q-T Interval Prolongation Importance of Species Selection in
19
Arrythmogenic Models of Q-T Interval Prolongation 46, 938–940. doi:10.1128/AAC.46.3.938
20
Morton, M.J., Armstrong, D., Abi Gerges, N., Bridgland-Taylor, M., Pollard, C.E., Bowes, J.,
21
Valentin, J.P., 2014. Predicting changes in cardiac myocyte contractility during early drug
22
discovery with in vitro assays. Toxicol. Appl. Pharmacol. 279, 87–94.
23
doi:10.1016/j.taap.2014.06.005
24
Morton, M.J., Main, M.J., 2013. Use of Escin as a Perforating Agent on the IonWorks Quattro
25
Automated Electrophysiology Platform. J. Biomol. Screen. 18, 128–134.
26
doi:10.1177/1087057112456599
27
Nada, A., Gintant, G.A., Kleiman, R., Gutstein, D.E., Gottfridsson, C., Michelson, E.L., Strnadova,
28
C., Killeen, M., Geiger, M.J., Fiszman, M.L., Koplowitz, L.P., Carlson, G.F., Rodriguez, I.,
29
Sager, P.T., 2013. The evaluation and management of drug effects on cardiac conduction (PR
30
and QRS intervals) in clinical development. Am. Heart J. 165, 489–500.
31
doi:10.1016/j.ahj.2013.01.011
32
Parkinson, J., Visser, S. a G., Jarvis, P., Pollard, C., Valentin, J.-P., Yates, J.W.T., Ewart, L., 2013.
33
Translational pharmacokinetic-pharmacodynamic modeling of QTc effects in dog and human. J.
34
Pharmacol. Toxicol. Methods. doi:10.1016/j.vascn.2013.03.007
35
Prior, H., McMahon, N., Schofield, J., Valentin, J.-P., 2009. Non-invasive telemetric
36
electrocardiogram assessment in conscious beagle dogs. J. Pharmacol. Toxicol. Methods 60,
37
167–73. doi:10.1016/j.vascn.2009.06.001
38
Redfern, W., Ewart, L., Hammond, T., Bialecki, R., Kinter, L., Lindgreen, S., Pollard, C., Roberts, R.,
39
Rolf, M., Valentin, J., 2010. Impact and frequency of different toxicities throughout the
40
pharmaceutical life cycle, in: The Toxicologist. p. 1081.