warwick.ac.uk/lib-publications
A Thesis Submitted for the Degree of PhD at the University of Warwick
Permanent WRAP URL:
http://wrap.warwick.ac.uk/116336
Copyright and reuse:
This thesis is made available online and is protected by original copyright. Please scroll down to view the document itself.
Please refer to the repository record for this item for information to help you to cite it. Our policy information is available from the repository home page.
Advanced New Technologies for Protein
Analysis by Mass Spectrometry
Pui Yiu Lam
A thesis submitted for the degree of
Doctor of Philosophy
Department of Chemistry
University of Warwick
i
Table of Contents i
Curriculum Vitae of (Yuko) Pui Yiu Lam v
Acknowledgements ix
Declaration xi
Thesis Summary xii
Abbreviations xv
Tables and Illustrated Material xviii
Chapter 1 Introduction 1
1.1 Introduction of Mass Spectrometry 1
1.1.1 Key Ionisation Techniques in MS 2
1.1.1.1 Electron Ionisation 2
1.1.1.2 Chemical Ionisation 4
1.1.1.3 Matrix Assisted Laser Desorption 5 1.1.1.4 Electrospray Ionisation 7 1.1.1.5 Nano Electrospray Ionisation 10 1.1.2 Mass Analysers 11
1.1.2.1 Quadrupole 12
1.1.2.2 Time-of-flight 16
1.1.2.3 Fourier Transform Ion Cyclotron Resonance (FTICR) 20 1.1.3 Tandem MS 29 1.1.3.1 Collisionally Activated Dissociation 30 1.1.3.2 Infrared Multiple Photon Dissociation 32 1.1.3.3 Electron Capture Dissociation 33
1.1.4 Bruker 12 Tesla FTICR MS 44
ii
1.2.1 Introduction of Amyloid Proteins 46 1.2.1.1 Amyloid Proteins Studies using MS 52 1.2.2 Introduction of Deamidation 53 1.2.2.1 Deamidation Studies using MS 54 1.2.3 Introduction to Proteomics 55 1.2.3.1 Proteomics Studies using Liquid Chromatography-MS 56 1.2.3.2 Proteomics Studies using Two Dimensional MS 60
1.3 Overview of the thesis 62
1.4 References 64
Chapter 2 Exploring the Aggregation and Deamidation Mechanisms of Human Islet Amyloid Polypeptide Using Fourier Transform Ion Cyclotron Resonance Mass Spectrometry 80
2.1 Abstract 81
2.2 Introduction 82
2.3 Experimental Section 87
2.4 Results
- Early oligomer formation in hIAPP 92
- From soluble oligomers to mature and insoluble fibrils 98
- Deamidation site(s) and rate of hIAPP 101
- Aggregation of mutant ((D)3hIAPP) and ((isoD)3hIAPP) 105
2.5 Discussion 109
- FTICR MS and MS/MS investigation of hIAPP interaction regions 109
- Rate of hIAPP aggregation 111
- Deamidation site(s) and rate of hIAPP 112
iii
2.7 References 115
2.8 Supplementary Information 121
Chapter 3 The Inhibition Pathways of Human Islet Amyloid Polypeptide
3.1 Abstract 172
3.2 Introduction 173
3.3 Experimental Section 178
3.4 Results
- The interactions between wild-type hIAPP and inhibitors 184
- The performance of inhibitors against wild-type hIAPP aggregation 186
- The interaction sites between wild-type hIAPP and the inhibitors 189
- The interactions between 30TNVGSNTY37-NH2 and the inhibitors 195
- The inhibitor effects on mutant (isoD)3hIAPP 197
3.5 Discussion 202
- Inhibition by specific binding to wild-type hIAPP 202
- Ineffective inhibition by non-specific binding to wild-type hIAPP 205
- Inhibition by accelerating the formation of non-toxic aggregates 207
- Inhibition performance on the mutant (isoD)3hIAPP 210
3.6 Conclusion 213
3.7 References 214
3.8 Supplementary Information 220
Chapter 4 The Next Dimension in Proteomics 288
4.1 Abstract 289
4.2 Introduction 290
iv
4.4 Results and Discussion
- Comparison of 2DMS and nLC MS/MS using digested BSA 300
- Comparison of 2DMS and nLC MS/MS using standard digested proteins
305
- Comparison of 2DMS and nLC MS/MS using digested yeast 316
4.5 Conclusion 323
4.6 References 324
4.7 Supplementary Information 329
v
Pui Yiu (Yuko) Lam
Email:[email protected]
Mobile: +44 (0)7413 669964
Education
Ph.D. Chemistry
University of Warwick 2014.10 – 2018.09
Thesis title: Advanced new technologies for protein analysis by mass
spectrometry
Supervisor: Prof. Peter O’Connor
M.Sc. Analytical Science
University of Warwick 2010.10 – 2011.09
Graduate with Distinction
Thesis title: Use of high resolution mass spectrometry for analysis of polymeric
excipients in drug delivery formulations
Supervisor: Prof. Peter O’Connor
B.Sc. Science (Chemistry & Finance)
University of Hong Kong 2007.09 – 2010.06
Graduate with 2.1 honour
Publications
Accept papers
․ van Agthoven, M. A.; Lynch, A. M.; Morgan, T. E.; Wootton, C. A.; Lam, Y. P. Y.; Chiron, L.; Barrow, M. P.; Delsuc, M.-A.; O’Connor, P. B., Can Two-Dimensional IR-ECD Mass Spectrometry Improve Peptide de Novo
Sequencing? Anal. Chem.2018, 90 (5), 3496-3504.
․ Floris, F.; van Agthoven, M. A.; Chiron, L.; Wootton, C. A.; Lam, P. Y. Y.; Barrow, M. P.; Delsuc, M.-A.; O’Connor, P. B., Bottom-Up Two-Dimensional
Electron-Capture Dissociation Mass Spectrometry of Calmodulin. J. Am. Soc.
vi
․ Zhang, P.; Chiu, C. K.; Huang, H.; Lam, Y. P.; Habtemariam, A.; Malcomson, T.; Paterson, M. J.; Clarkson, G. J.; O'Connor, P. B.; Chao, H.; Sadler, P. J.,
Organoiridium Photosensitizers Induce Specific Oxidative Attack on Proteins
within Cancer Cells. Angew. Chem. Int. Ed.2017, 56 (47), 14898-14902.
․ Wootton, C. A.; Lam, Y. P.; Willetts, M.; van Agthoven, M. A.; Barrow, M. P.; Sadler, P. J.; Peter, B., Automatic assignment of metal-containing peptides in
proteomic LC-MS and MS/MS data sets. Analyst2017, 142 (11), 2029-2037.
․ Wei, J.; Antzutkin, O. N.; Filippov, A. V.; Iuga, D.; Lam, P. Y.; Barrow, M. P.; Dupree, R.; Brown, S. P.; O’Connor, P. B., Amyloid Hydrogen Bonding Polymorphism Evaluated by 15N {17O} REAPDOR Solid-State NMR and
Ultra-High Resolution Fourier Transform Ion Cyclotron Resonance Mass
Spectrometry. J. Biochem.2016, 55 (14), 2065-2068.
․ Simon, H.; van Agthoven, M.; Lam, P.; Floris, F.; Chiron, L.; Delsuc, M.-A.; Rolando, C.; Barrow, M.; O'Connor, P., Uncoiling collagen: a
multidimensional mass spectrometry study. Analyst 2016, 141 (1), 157-165.
․ Floris, F.; van Agthoven, M.; Chiron, L.; Soulby, A. J.; Wootton, C. A.; Lam, Y. P.; Barrow, M. P.; Delsuc, M.-A.; O’Connor, P. B., 2D FT-ICR MS of calmodulin: a top-down and bottom-up approach. J. Am. Soc. Mass. Spectrom.
2016, 27 (9), 1531-1538.
․ Perez Hurtado, P.; Lam, P. Y.; Kilgour, D.; Bristow, A.; McBride, E.; O’Connor, P. B., Use of high resolution mass spectrometry for analysis of polymeric excipients in drug delivery formulations. Anal. Chem. 2012, 84 (20), 8579-8586.
Submitted paper
․ “Exploring the Aggregation Mechanisms of Amyloid Protofibrils Using Electron Capture Dissociation Tandem Mass Spectrometry” by Lam, Y.P.Y.; Wootton, C.A.; Hands-Portman, I.; Wei, J; Chiu, C.K.C.; I. Romero-Canelon Lermyte, F.; Barrow, M. P.; and O’Connor, P. B. Submitted to Analytical Chemistry, 2018.
․ “Does Deamidation of Islet Amyloid Polypeptide Accelerate Amyloid Fibril Formation?” by Lam, Y.P.Y.; Wootton, C.A.; Hands-Portman, I.; Wei, J; Chiu, C.K.C.; I. Romero-Canelon Lermyte, F.; Barrow, M. P.; and O’Connor, P. B.
Submitted to Chemical Communications, 2018.
․ “The Inhibition Mechanisms of Human Islet Amyloid Polypeptide Fibrillisation” by Lam, Y.P.Y.; Chiu, C.K.C.; Wootton, C.A.; Song, J.I.; Li, M.; Hands-Portman, I.; Barrow, M. P.; and O’Connor, P. B. Submitted to Chemical
vii
․ “Two-dimensional mass spectrometry: new perspectives for tandem mass spectrometry” by van Agthoven, M.A.; Lam, Y.P.Y.; O’Connor, P.B.; Rolando,
C.; Delsuc; M.A. Submitted to European Biophysics Journal, 2018.
․ “Discovery of a natural product-based Factor Xa inhibitor as an anticoagulant agent” Chen, P.; Xhang, D.W.; Li, M.; Wu, Q.; Lam, Y.P.Y.; Guo, Y.; Chen, C.; Hu, R.; Bai, N.; Malhotra, S.; Li, W.; O’Connor, P.B., Fu, H. Submitted to Journal of Medicinal Chemistry, 2018.
Manuscripts in preparation
․ “The Next Dimension in Proteomics” by Lam, Y.P.Y.; Wootton, C.A.; Chiu, C.K.C.; Morgan, T.E.; Gavard, R.; van Agthoven, M.A.; Li, M.; Barrow, M. P.;
and O’Connor, P. B.
Awards
Academic Awards
․ Educational Grant
From The Great Britain – China Educational Trust (GBCET) for 2017/18
․ Research Development Fund (RDF) Strategic Award
From University of Warwick for 2016/17
․ Foundation Main Grant
From Funds for Women Graduates organisation for 2016/17
․ Educational Trust
From Sir Richard Stapley Education Trust for 2016/17
․ Travel Grant
From Royal Society of Chemistry (RSC) Analytical Trust fund and
International Mass Spectrometry Foundation (IMSF) for the 2018
International Mass Spectrometry Conference (IMSC)
․ Travel Grant
From Royal Society of Chemistry (RSC) for the 2017 Analytical Research
Forum (ARF)
․ Travel Grant
From American Society for Mass Spectrometry (ASMS) and British Mass
Spectrometry Society (BMSS) for the 65th American Society for Mass
Spectrometry (ASMS) conference
․ Travel Grant
From British Mass Spectrometry Society (BMSS) for the 9th Isolated
viii Presentation Awards
․ Flash Presentation Runner Up Prize
At the 2017 Analytical Research Forum (AFR)
․ Best Talk Award
At the 14th East Midlands Proteomics Workshop (EMPW)
․ Bordoli Prize for Best Young Researcher Poster Presentation
At the 36th British Mass Spectrometry Society (BMSS) conference
Conference Presentations
Oral Presentations
․ 22nd International Mass Spectrometry Conference (IMSC 2018) –
Florence, Italy; Presented in the Non-covalent Interactions session
․ 15th Uppsala Conference on Electron Capture and Transfer Dissociation
Mass Spectrometry – Leeds, UK
․ 65th American Society for Mass Spectrometry Annual Conference
(ASMS 2017) – Indianapolis, USA; Presented in the Native MS in Structural Biology session
․ 12th European Fourier Transform Mass Spectrometry Conference
(EFTMS 2016) – Matera, Italy; Presented in the Protein Analysis session
․ 14th East Midlands Proteomics Workshop (EMPW 2015) – Coventry, UK
Poster Presentations
․ 16th East Midlands Proteomics Workshop (EMPW 2017) – Nottingham,
UK
․ 38th British Mass Spectrometry Society Annual Conference (BMSS 2017)
– Manchester, UK
․ 2017 Analytical Research Forum (ARF 2017) – London, UK; Poster Presentation plus 5 minutes flash talk
․ 15th East Midlands Proteomics Workshop (EMPW 2016) – Nottingham,
UK
․ 37th British Mass Spectrometry Society Annual Conference (BMSS 2016)
– Eastbourne, UK
․ 9th Isolated Biomolecules and biomolecular Interaction Conference(IBBI
2016) – Oxford, UK
․ 36th British Mass Spectrometry Society Annual Conference (BMSS 2015)
ix
Acknowledgements
It is a great pleasure to take this opportunity to thank all the people who
helped in my 4-year PhD degree at the University of Warwick. Foremost, I would
like to thank my supervisor Prof. Peter O’Connor for his guidance and support
during my PhD. The knowledge and the enthusiasm from Prof. O’Connor in the
scientific research are the strongest guiding forces in these 4 years of study which
allow me to achieve higher during my PhD. Prof. O’Connor is a great academic
who always reminds me to pursue the fact of science not the expectation; during
project discussion, he always keeps an open mind and judges the project solely
based on the data obtained. Prof. O’Connor also supports me to attend lots of
national as well as international conferences during my PhD which helps to
broaden my horizons in different research areas as well as enhance my networking
in the science field. Aside from academics, Prof. O’Connor also provides lots of
advice and assistance when I faced difficulties in life. I am very honoured to be
his student for my masters as well as PhD degrees, and I am looking forward to
continuing to work with him in the future.
I would like to acknowledge all the past and present members in Peter
O’Connor group as well as Mark Barrow’s group. I have learnt not only the
science, but also the interesting cultures, languages, as well as viewpoints from
different group members. I really enjoy working in such a pleasant and
collaborative environment. I would like to specially thank Dr. Christopher A.
Wootton, Mr. Cookson K.C. Chiu, and Miss Meng Li for the help and support
during my PhD. I would also like to thank all the co-authors and colleagues who
have been involved in the projects that presented in this thesis.
I would like to take this opportunity to thank my parents Percy Lam and
x
continue to pursue my career in science. I would also like to thank my sister
Hitomi Lam as well as my partner Jonathan Wong for their support and advice
during my PhD.
At last, I would like to thank the following organisations: University of
Warwick, Funds for Women Graduates, The Great Britain-China Educational Trust,
and The Sir Richard Stapley Educational Trust for providing funding to support
xi
Declaration
I hereby declare that except where specifically references/stated are made to other
sources, the thesis entitled “Advanced New Technologies for Protein Analysis by
Mass Spectrometry” is the original work of the named Author. It has been
composed by myself and co-authors where stated and has not been submitted in
whole or in part for any other degree, diploma, or qualification.
Pui Yiu Lam
xii
Thesis Summary
The work presented herein applies advanced techniques in an ultrahigh
resolution Fourier transform ion cyclotron resonance mass spectrometry (FTICR
MS) to study one of the most amyloidogenic amyloid proteins – human islet
amyloid polypeptide (hIAPP) and we also demonstrate alternative analytical
techniques for proteomics.
Exploring the aggregation and inhibition pathways of amyloid proteins is
critical for future therapeutic development. Previous studies demonstrated the
early, soluble oligomers of amyloid proteins are more toxic to neuro cells than
mature amyloid fibrils due to their ability to penetrate and destroy neuro cell
membranes. Current analytical techniques for amyloid protein studies, including
nuclear magnetic resonance (NMR) spectroscopy, fluorescence spectrometry,
transmission electron microscopy (TEM), and atomic force microscopy (AFM),
are difficult to perform as they require molecular isolation and focus on studying
individual target early oligomers from a mixtures of oligomers. Previous
literature, however, has demonstrated the ability of MS in observing as well as
isolating a specific oligomer from an in vitro amyloid protein sample. Thus, MS
has been applied together with electron-based dissociation technique in this thesis
to determine the aggregation as well as inhibition pathways of hIAPP.
The results herein demonstrate the region around Gly-33 and Ser-34 of hIAPP
is critical for hIAPP aggregation since it is the minimum interaction region
between the two hIAPP units which was shown by the electron-based dissociation
spectra of the dimer as well as the trimer of hIAPP. hIAPP has also shown to be
deamidated rapidly within a month at Asn-21, Asn-22, and Asn-35 residues,
regarding there are seven potential deamidation sites within the sequence. The
xiii
deamidation sites shows a significant change in the amyloid fibril morphology
which may help to explain the previously observed acceleration of aggregation
rate by inducing 5% of deamidated hIAPP into non-deamidated hIAPP solution.
The methodologies applied in studying the aggregation pathway of hIAPP are
further used to explore the inhibition pathways between hIAPP and potential
inhibitors. From the results, two different inhibition pathways are proposed to
effectively prevent the formation of hIAPP fibrils. Inhibitors interacting
specifically at the critical aggregation region around Gly-33 and Ser-34, are shown
to prevent the formation of hIAPP fibrils by forming hetero-complexes (a complex
composes of hIAPP and inhibitor). The alternative inhibition pathway requires
an inhibitor which interacts non-specifically with hIAPP and triggers the formation
of non-toxic amorphous aggregates faster than the generation of normal, toxic
hIAPP oligomers. These two proposed inhibition pathways show an effective
inhibition effect on formation of hIAPP fibrils, however, only the non-specifically
interaction pathway was effective in preventing the aggregation of the deamidated
from hIAPP since the protein sequence as well as structure are distorted in the
deamidated hIAPP which significantly affects the specific interaction between the
deamidated hIAPP and inhibitors.
The in vitro studies propose the potential aggregation and inhibition pathways
for hIAPP; it is critical, but unfortunately very challenging, to study these
molecular interactions in vivo due to the solvents and column chemistry required
by the current liquid chromatography (LC) approach which is necessary for
complex mixture studies. In order to study the in vivo molecular interactions, an
alternative analytical technique, therefore, is required.
Herein, two dimensional mass spectrometry (2DMS) is applied to study
xiv
digest without online LC separation. Various sample preparation and 2DMS
acquisition methods have been applied to optimise the proteomic outputs from
2DMS. From the results, 2DMS shows a similar capability in studying
proteomics compared to the standard LC tandem MS (MS/MS) techniques. The
peptides assigned in 2DMS experiments are more hydrophilic, basic, and short,
which are complementary to those assigned in the LC MS/MS technique, thus
more proteins can be covered by combining the results obtained from 2DMS and
LC MS/MS, in which a deeper proteome coverage is achieved. 2DMS is shown
to be a viable alternative analytical tool for proteomics, in which is also potential
for the in vivo study of molecular interactions in the coming future.
The final section of this thesis provides a conclusion on all the works that
have been demonstrated herein and discusses the future research which we needed
to improve/enhance the current knowledge on amyloid protein studies using MS
xv
2D-LC Two dimensional liquid chromatography
2DMS Two dimensional mass spectrometry
2D-PAGE Two dimensional polyacrylamide gels
3-APS 3-amino-1-propane sulfonic acid
5CP 5 combined proteins
ABC Ammonium bicarbonate
ACN Acetonitrile
AD Alzheimer’s disease
AFM Atomic force microscopy
Asn Asparagine
Aβ1-40 Amyloid beta 1-40
BISA 1H-Benzimidazole-2-sulfonic acid
BSA Bovine serum albumin
CAD Collisionally activated dissociation
CCS Collision-cross section
CD Circular dichroism
CE Capillary electrophoresis
CEM Chain ejection model
CHCA α-Cyano-4-hydroxycinnamic acid
CI Chemical ionisation
CLZ Chicken lysozyme
CO2 Carbon dioxide
CRM Charge residue model
Cys Cysteine
DC Direct current
DHB 2,5-Dihydroxybenzoic acid
DTT Dithiothreitol
ECD Electron capture dissociation
EDD Electron detachment dissociation
EDTA Ethylenediaminetetraacetate
EGCG (-)-Epigallocatechin 3-gallate
EI Electron ionisation
EID Electron induced dissociation
ESI Electrospray ionisation
ETD Electron transfer dissociation
FA Formic acid
FDR False discovery rate
xvi
FTMS Fourier transform mass spectrometry
FWHM Full width half maximum
GC Gas chromatography
Gln Glutamine
HD Huntington’s diseases
HDX Hydrogen-deuterium exchange
HHA Human haemoglobin
hIAPP Human islet amyloid polypeptide
HILIC Hydrophilic interaction liquid chromatography
HLZ Human lysozyme
HPLC High performance liquid chromatography
HSA Human serum albumin
i.d. Internal diameter
IAA Iodoacetamide
IEM Ion ejection model
IM-MS Ion mobility-mass spectrometry
IR-ECD Infrared electron capture dissociation
IRMPD Infrared multiple photon dissociation
kV Kilovolts
LC Liquid chromatography
M Mega-word
m/z Mass-to-charge
MALDI Matrix assisted laser desorption
MS Mass spectrometry
MS/MS Tandem mass spectrometry
nESI Nano electrospray ionisation
nLC nano-LC
P1 Excitation pulse applied in two dimensional mass spectrometry
P2 Excitation pulse applied in two dimensional mass spectrometry
PD Parkinson’s disease
ppm Parts-per-million
PTM Post translation modification
RF Radio frequency
rIAPP Rat islet amyloid polypeptide
RP Reversed-phase
S/N Signal-to-noise
SA 3,5-Dimethoxy-4-hydroxycinnamic acid
xvii
SCX Strong cation exchange chromatography
SDS Sodium dodecyl sulfate
SDS-PAGE Sodium dodcyl sulfate polyacrylamide
SORI-CID
Sustained off-resonance irradiation collision-induced
dissociation
SPE Solid phase extraction
SPIKE Spectrometry Processing Innovative Kernel
SSNMR Solid-state nuclear magnetic resonance
SWIFT Stored waveform inverse Fourier transform
T Tesla
t1 Delayed period applied in two dimensional mass spectrometry
T2D Type II diabetes (for Chapter 1 -3)
TEM Transmission electron microscopy
ThT Thioflavin T
TOF Time-of-flight
xviii
List of Figures and Tables Chapter 1 Introduction
• Figure 1.1. Schematic representation of an EI source.
• Figure 1.2. EI-MS spectrum of pentadecane (C15H32)
• Figure 1.3. Common matrices used in MALDI source.
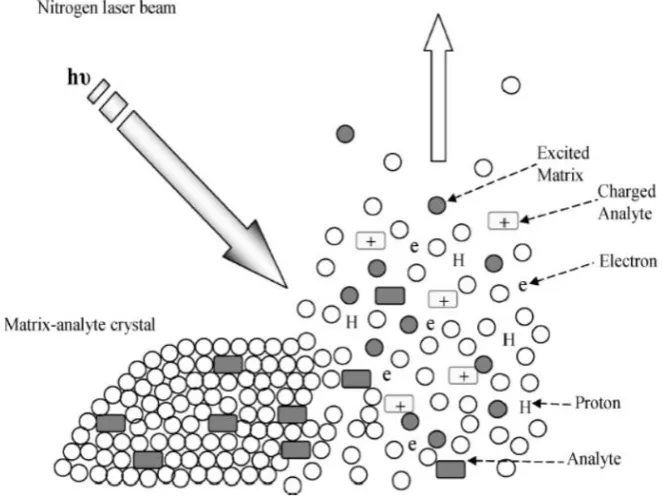
• Figure 1.4. The principle of MALDI.
• Figure 1.5. The principle of ESI source.
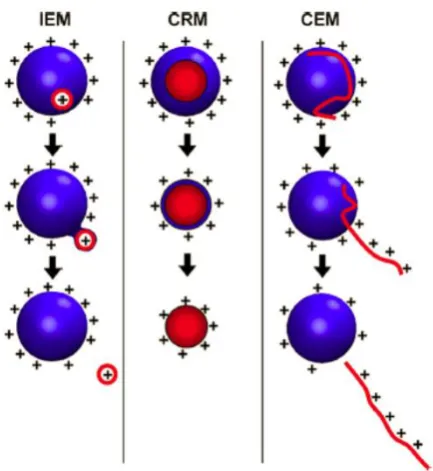
• Figure 1.6. The proposed ESI models.
• Figure 1.7. The schematic diagram of nESI.
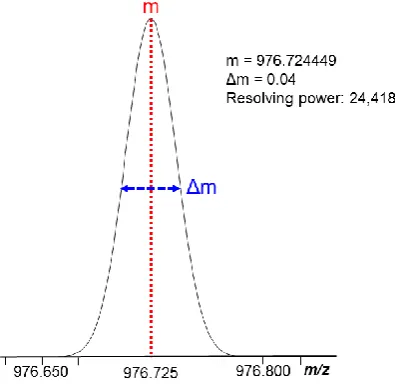
• Figure 1.8. Resolving power calculated by Full Width Half Maximum (FWHM).
• Figure 1.9. The layout of a quadrupole.
• Figure 1.10. The formation of saddle points in the centre of the quadrupole.
• Figure 1.11. Representation of the stability diagram of ions in a quadrupole.
• Figure 1.12. The outline of a linear TOF.
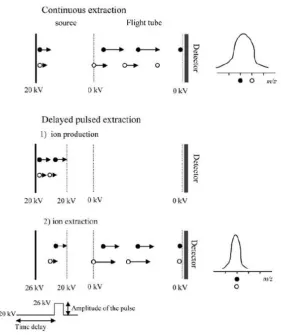
• Figure 1.13. The implication of a delayed pulsed extraction in a TOF mass analyser.
• Figure 1.14. The application of a reflectron in a TOF mass analyser.
• Figure 1.15. The cyclotron motion of ions in the presence of magnetic field.
• Figure 1.16. The cyclotron motion, trapping motion, and magnetron motion in a penning trap.
• Figure 1.17. Representation of an ion cloud expansion in an FTICR cell.
xix
• Figure 1.19. The configurations of ICR cells.
• Figure 1.20. The possible fragment ions of a biomolecule.
• Figure 1.21. Diagram to show the formation of the b and y ions in CAD MS/MS fragmentation.
• Figure 1.22. Diagram to show the generation of the c, z, a, y ions in ECD MS/MS fragmentation.
• Figure 1.23. The Cornell mechanisms of ECD MS/MS.
• Figure 1.24. The Utah-Washington mechanism of ECD MS/MS.
• Figure 1.25. Disulfide bond cleavage in ECD MS/MS.
• Figure 1.26. Deamidation mechanisms of asparagine and glutamine.
• Figure 1.27. ECD fragmentation mechanism of the iso-aspartic acid.
• Figure 1.28. The instrument design of the Bruker 12 T solariX FTICR MS.
• Table 1.1. Table to summarise the most common human disordered diseases.
• Figure 1.29. Diagram to show the amyloid aggregation phases and the free energy of aggregates in various states.
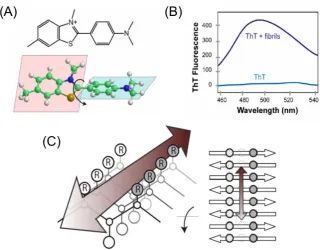
• Figure 1.30. Diagram to show the structure and binding mechanism of ThT in fluorescence spectroscopy
xx
Chapter 2 Exploring the Aggregation and Deamidation Mechanisms of Human Islet Amyloid Protein Using Fourier Transform Ion Cyclotron Resonance Mass Spectrometry
• Figure 2.1. The sequence and structure of hIAPP.
• Figure 2.2. MS and ECD MS/MS fragmentation of the early oligomers of hIAPP.
• Figure 2.3. MS quantification, fluorescence spectroscopy measurement, and TEM images of incubated hIAPP samples.
• Figure 2.4. CAD MS/MS fragments of incubated hIAPP.
• Figure 2.5. The CAD MS/MS fragments of incubated hIAPP.
• Figure 2.6. The TEM images, MS quantification, and fluorescence spectrometry measurement of incubated ((D)3hIAPP) ((isoD)3hIAPP)
solutions
Figures and Tables in Supplementary Information
• Figure S2.1. CAD MS/MS spectrum of the 4+ charge state hIAPP monomer.
• Table S2.1. CAD MS/MS fragments of the 4+ charge state hIAPP monomer.
• Figure S2.2. IR-ECD MS/MS spectrum of the 4+ charge state hIAPP monomer.
• Table S2.2. IR-ECD MS/MS fragments of the 4+ charge state hIAPP monomer.
• Figure S2.3. Sequences of synthetic mutant hIAPPs.
• Figure S2.4. nESI-MS spectrum of the hIAPP early oligomers.
xxi
• Figure S2.6. The dissociation curve of the 8+ charge state trimer hIAPP using CAD MS/MS
• Figure S2.7. ECD MS/MS spectrum of the 5+ charge state hIAPP dimer (in aqueous solution with 2% residual DMSO).
• Table S2.3. ECD MS/MS fragments of the 5+ hIAPP dimer ion (in aqueous solution with 2% residual DMSO).
• Figure S2.8. Key IR-ECD fragments of the 5+ charge state hIAPP dimer with various IR pulse lengths.
• Figure S2.9. ECD MS/MS spectrum of the 7+ charge state hIAPP dimer (in aqueous solution with 2% residual DMSO).
• Table S2.4. ECD MS/MS spectrum of the 7+ charge state hIAPP dimer.
• Figure S2.10. ECD MS/MS spectrum of the 8+ charge state hIAPP trimer (in aqueous solution with 2% residual DMSO).
• Table S2.5. ECD MS/MS spectrum of the 8+ charge state hIAPP trimer ion (in aqueous solution with 2% residual DMSO).
• Figure S2.11. Summarised fragments observed in the ECD MS/MS spectrum of the dimer and trimer of hIAPP in aqueous solution.
• Table S2.6. ECD MS/MS fragments of the 5+ charge state hIAPP dimer (in aqueous solution only).
• Table S2.7. ECD MS/MS fragments of the 7+ charge state hIAPP dimer (in aqueous solution only).
• Table S2.8. ECD MS/MS spectrum of the 8+ charge state hIAPP trimer ion (in aqueous solution only).
• Figure S2.12. (A) MS spectrum of 30TNVGSNTY37-NH2 as well as (30TNVGSNTY37-NH2) and hIAPP in aqueous solution.
xxii 30TNVGSNTY37-NH
2 in the CAD MS/MS and the ECD MS/MS fragments
of the 30TNVGSNTY37-NH2 in aqueous solution.
• Table S2.9. ECD MS/MS spectrum of the 3+ charge state trimer of the hIAPP segment.
• Figure S2.14. The CAD curve of the 4+ charge state hIAPP and 30TNVGSNTY37-NH
2.
• Figure S2.15. ECD MS/MS spectrum of the 4+ charge state mixture of [hIAPP + 30TNVGSNTY37-NH2] species in aqueous solution.
• Table S2.10. ECD MS/MS spectrum of the 4+ charge state of [hIAPP + 30TNVGSNTY37-NH
2] species.
• Figure S2.16. ECD MS/MS spectrum of the 7+ charge state ((D)3hIAPP) dimer (in aqueous solution with 2% residual DMSO).
• Table S2.11. ECD MS/MS spectrum of the 7+ charge state ((D)3hIAPP) dimer ion (in aqueous solution with 2% residual DMSO).
• Figure S2.17. ECD MS/MS spectrum of the 7+ charge state ((isoD)3hIAPP) dimer (in aqueous solution with 2% residual DMSO).
• Table S2.12. ECD MS/MS spectrum of the 7+ charge state ((isoD)3hIAPP) dimer ion (in aqueous solution with 2% residual DMSO).
• Figure S2.18. The relative fluorescence activity of the 5 μM and 10 μM
mutant hIAPP solutions (A) ((D)3hIAPP) and (B) ((isoD)3hIAPP).
• Figure. S2.19. The nESI-MS spectra showing the fresh, the incubated solutions, and the incubated fibrillary pellets of hIAPP mixed with various
xxiii
Chapter 3 The Inhibition Pathways of Human Islet Amyloid Polypeptide
• Figure 3.1. The sequence of hIAPP and the MS spectra of the wild-type hIAPP mixed with various potential inhibitors.
• Figure 3.2. ThT fluorescence emission measurement, MS quantification, and TEM images of incubated mixture of hIAPP with various potential
inhibitors.
• Figure 3.3. ECD spectrum of the of hIAPP plus insulin and the summarised ECD MS/MS fragments of hIAPP mixed with insulin/ 3-APS/
BISA/ EGCG
• Figure 3.4. ECD MS/MS spectrum of the dimer hIAPP dimer mixed with 3-APS/ BISA.
• Figure 3.5. The MS spectra of 30TNVGSNTY37-NH2 mixed with insulin/ 3-APS/ BISA/ EGCG
• Figure 3.6. Dissociation curves, MS quantification, and TEM images of (isoD)3hIAPP mixed with insulin/ 3-APS/ BISA/ EGCG.
• Figure 3.7. Summarised inhibition mechanisms of various compounds on wild-type hIAPP aggregation.
Figures and Tables in Supplementary Information
• Figure S3.1. Fluorescence emission measurement of hIAPP with insulin/ 3-APS/ BISA/ EGCG
• Figure S3.2. MS quantification of incubated hIAPP with insulin/ 3-APS/ BISA/ EGCG
• Figure S3.3. The representative CAD spectra of hIAPP with the potential inhibitors
xxiv
• Figure S3.5. A summarised ECD spectrum of hIAPP with insulin molecule.
• Table S3.1. List of the assigned ECD fragments of the 7+ molecular ion of hIAPP monomer unit with an intact insulin molecule.
• Figure S3.6. A summarised ECD spectrum of hIAPP with 3-APS molecule.
• Table S3.2. List of the assigned ECD fragments of the 4+ molecular ion of hIAPP monomer unit with a 3-APS molecule.
• Figure S3.7. A summarised ECD spectrum of hIAPP with BISA molecule.
• Table S3.3. List of the assigned ECD fragments of the 4+ molecular ion of hIAPP monomer unit with a BISA molecule.
• Figure S3.8. A summarised ECD spectrum of hIAPP with EGCG molecule.
• Table S3.4. List of the assigned ECD fragments of the 4+ molecular ion of hIAPP monomer unit with an EGCG molecule.
• Figure S3.9. The representative CAD spectra of the 5+ charge state molecular ion of 30TNVGSNTY37-NH2 peptide mixed with the potential
inhibitors.
• Figure S3.10. The dissociation curves of the 5+ 30TNVGSNTY37-NH2 peptide mixed with the potential inhibitors.
• Figure S3.11. ECD fragments of the 5+ charge state molecular ion of the synthetic 30TNVGSNTY37-NH
2 peptide with an intact insulin molecule.
• Table S3.5. List of the assigned ECD fragments of the 5+ molecular ion of the synthetic peptide 30TNVGSNTY37-NH2 with an insulin molecule.
xxv synthetic dimer 30TNVGSNTY37-NH
2 peptide with a 3-APS molecule.
• Table S3.6. List of the assigned ECD fragments of the 2+ molecular ion of the synthetic peptide 30TNVGSNTY37-NH
2 with a 3-APS molecule.
• Figure S3.13. ECD fragments of the 2+ charge state molecular ion of the synthetic dimer 30TNVGSNTY37-NH
2 peptide with an EGCG molecule.
• Table S3.7. ECD fragments of the 2+ molecular ion of the synthetic peptide 30TNVGSNTY37-NH
2 peptide with an EGCG molecule.
• Figure S3.14. The summarised ECD fragments of the 7+ charge state molecular ion of the wild-type hIAPP dimer with a 3-APS molecule.
• Table S3.8. List of the assigned ECD fragments of the 7+ molecular ion of the wild-type hIAPP dimer with a 3-APS molecule.
• Figure S3.15. The summarised ECD fragments of the 7+ charge state molecular ion of the wild-type hIAPP dimer with a BISA molecule.
• Table S3.9. List of the assigned ECD fragments of the 7+ molecular ion of the wild-type hIAPP dimer with a BISA molecule.
• Figure S3.16. The summarised ECD fragments of the 7+ charge state molecular ion of the wild-type hIAPP dimer with an EGCG molecule.
• Table S3.10. List of the assigned ECD fragments of the 7+ molecular ion of the wild-type hIAPP dimer with an EGCG molecule.
• Figure S3.17. The MS spectra of the 10 µM solution of the mutant (isoD)3hIAPP with the potential inhibitors.
• Figure S3.18. ECD fragments of the 7+ charge state molecular ion of the mutant (isoD)3hIAPP monomer unit and an intact insulin molecule.
• Table S3.11. List of the assigned ECD fragments of the 7+ molecular ion of the mutant (isoD)3hIAPP monomer unit with an intact insulin molecule.
xxvi
mutant (isoD)3hIAPP monomer unit and a 3-APS molecule.
• Table S3.12. List of the assigned ECD fragments of the 4+ molecular ion of the mutant (isoD)3hIAPP monomer unit with a 3-APS molecule.
• Figure S3.20. ECD fragments of the 4+ charge state molecular ion of the mutant (isoD)3hIAPP monomer unit and a BISA molecule.
• Table S3.13. List of the assigned ECD fragments of the 4+ molecular ion of the mutant (isoD)3hIAPP monomer unit with a BISA molecule.
• Figure S3.21. ECD fragments of the 4+ charge state molecular ion of the mutant (isoD)3hIAPP monomer unit and an EGCG molecule.
• Table S3.14. List of the assigned ECD fragments of the 4+ molecular ion of the mutant (isoD)3hIAPP monomer unit with an EGCG molecule.
• Figure S3.22. The summarised ECD fragments of the 7+ charge state molecular ion of the mutant (isoD)3hIAPP dimer with a 3-APS molecule.
• Table S3.15. List of the assigned ECD fragments of the 7+ molecular ion of the mutant (isoD)3hIAPP dimer with a 3-APS molecule.
• Figure S3.23. Fluorescence emission measurement of (isoD)3hIAPP mixed with insulin/ 3-APS/ BISA/ EGCG
• Figure S3.24. MS quantification of (isoD)3hIAPP mixed with insulin/ 3-APS/ BISA/ EGCG
xxvii
Chapter 4 The Next Dimension in Proteomics
• Figure 4.1. A summarised workflow of yeast 2DMS
• Figure 4.2. 2DMS spectrum of BSA tryptic digest.
• Figure 4.3. Proteomic results of BSA tryptic digest using 2DMS and nLC MS/MS.
• Figure 4.4. Proteomic results of 5CP tryptic digest using 2DMS with SPEs enrichment and nLC MS/MS.
• Figure 4.5. High resolution 2DMS spectrum of 5CP tryptic digest.
• Figure 4.6. Proteomic results of 5CP tryptic digest using 2DMS with SPE offline fractionation and nLC MS/MS.
• Figure 4.7. Comparison of SPE fractionated 2DMS and nLC MS/MS results for yeast tryptic digest.
Figures and Tables in Supplementary Information
• Figure S4.1. Four key 2DMS lines in a standard two dimensional mass spectrometry (2DMS) spectrum.
• Table S4.1. Summarised experimental details of 5 combined proteins (5CP) in the 2DMS experiments.
• Table S4.2. Summarised experimental details of tryptic digested yeast in the 2DMS experiments.
• Table S4.3. Online CAD automatic MS/MS rolling energy parameters applied by 12 T Bruker solariX for nLC MS/MS analysis.
• Figure S4.2. Offline fractionation gradients of 5CP and yeast using various SPEs cartridges
• Figure S4.3. The nLC gradient of the tryptic digested (A) BSA and 5CP, as well as (B) yeast.
xxviii
unassigned peptides in the MASCOT search.
• Figure S4.5. Spectra of digested BSA in (A) an 1DMS spectrum and (B) an extraction of auto-correlation line in the 2DMS spectrum.
• Figure S4.6. Fragmentation map of the digested BSA using nLC FTICR CAD MS/MS.
• Figure S4.7. Fragmentation map of the digested BSA using IRMPD 2DMS.
• Figure S4.8. Fragmentation maps of the digested 5CP using nLC FTICR CAD MS/MS.
• Figure S4.9. 2DMS results of 5CP without prior purification and separation.
• Figure S4.10. 2DMS spectra of digested 5CP enriched using SPE cartridges of C18 RP
• Figure S4.11. 2DMS results of 5CP with C18 RP pH 2 SPE cartridge purification.
• Figure S4.12. 2DMS results of 5CP with HILIC SPE cartridge purification.
• Figure S4.13. 2DMS results of 5CP with C18 RP pH 10 SPE cartridge purification.
• Figure S4.14. 2DMS results of 5CP with SAX SPE cartridge purification.
• Figure S4.15. The combined fragmentation maps of 5CP using 4 different SPE cartridges enrichment and then analysed by 2DMS.
• Figure S4.16. 2DMS spectra of the digested 5CP in various resolutions of fragment and precursor m/z dimensions.
xxix
• Figure S4.18. The fragmentation maps of the digested 5CP using 2DMS with resolutions at 1 M * 8 k (left) and 2 M * 4 k (right).
• Figure S4.19. 2DMS spectra of the digested 5CP with HILIC enrichment conducting in various resolutions of fragment and precursor m/z
dimensions.
• Figure S4.20. The fragmentation maps of the digested 5CP with HILIC enrichment using 2DMS with resolutions at 128 k * 8 k (left) and 256 k *
4 k (right).
• Figure S4.21. The fragmentation maps of the digested 5CP with HILIC enrichment using 2DMS with resolutions at 1 M * 8 k (left) and 2 M * 4 k
(right).
• Figure S4.22. Proteomic results of 5CP using high resolution 2DMS with RP and HILIC enrichment.
• Figure S4.23. 2DMS spectra (256 k * 4 k) of the digested 5CP samples with C18 RP enrichment at pH2. The sample was then separated into 4
different m/z range using the quadrupole before the acquisition of 2DMS.
• Figure S4.24. 2DMS spectra (256 k * 4 k) of the digested 5CP samples with HILIC enrichment at pH6.8. The sample was then separated into 4
different m/z range using the quadrupole before the acquisition of 2DMS.
• Figure S4.25. 2DMS spectra (256 k * 4 k) of the digested 5CP samples with offline fractionation using C18 RP SPE cartridge at pH2.
• Figure S4.26. 2DMS spectra (256 k * 4 k) of the digested 5CP samples with offline fractionation using HILIC SPE cartridge at pH6.8.
• Figure S4.27. Proteomic results of 5CP using 2DMS with C18 RP enrichment and the sample was then separated into 4 different m/z range
xxx
• Figure S4.28. Proteomic results of 5CP using 2DMS with HILIC enrichment and the sample was then separated into 4 different m/z range
using quadrupole before the acquisition of 2DMS.
• Figure S4.29. Fragmentation maps of the digested 5CP with offline C18 RP SPE cartridge fractionation using IRMPD 2DMS.
• Figure S4.30. Fragmentation maps of the digested 5CP with offline HILIC SPE cartridge fractionation using IRMPD 2DMS.
• Figure S4.31. The total ion chromatogram (TIC) of the digested yeast analysed using a C18 RP nLC MS/MS with a 120-minute effective gradient,
160-minute total acquisition time.
• Figure S4.32. Proteomic results of yeast tryptic digest using 2DMS and nLC MS/MS.
• Figure S4.33. 1DMS spectrum of the tryptic digested yeast with 100 accumulation spectra.
• Figure S4.34. 2DMS spectra of digested yeast with 256 k * 4 k resolution of the fraction 1-9 using C18 RP SPE cartridge at pH 2.
• Figure S4.35. 2DMS spectra of digested yeast with 256 k * 4 k resolution of the fraction 10-16 using C18 RP SPE cartridge at pH 2.
• Figure S4.36. Venn diagram showing the overlapping of the yeast peptides identified in the offline fractionated 2DMS experiment and the
xxxi
Chapter 5 Conclusion and Future Works
• Summarised figure for Chapter 2
• Summarised figure for Chapter 3
1
Chapter 1 Introduction
Mass spectrometry (MS) is an important technique to study biological
molecules because of its accuracy, sensitivity, speed, and the capability of
simultaneous analysis.1, 2 MS is commonly applied to provide sequence and
modification information,3, 4 as well as structure and quantification analysis of
biological molecules.5, 6
This thesis focuses on the applications of advanced technologies in mass
spectrometry for protein analysis, which includes the application of tandem MS to
explore the aggregation and inhibition mechanisms of amyloid proteins, as well as
development of a new analytical technique which is suitable for the study of fragile
amyloid aggregates in a complex mixture.
This chapter contains three sections, including introduction of mass
spectrometry (section 1.1), applications of MS of amyloid proteins, deamidation,
as well as proteomics studies (section 1.2), and an overview of the thesis (section
1.3).
1.1 Introduction of Mass Spectrometry
MS is a powerful analytical instrument which provides molecular mass
information of gas state molecules by measuring the mass-to-charge (m/z) ratios
of ions. The first MS, which was also named a “parabola spectrograph”, was
invented in 1912 by J.J. Thomson and the mass spectra of O2, N2, CO, CO2, and
COCl2 were obtained.7 MS has been rapidly developed in the last century.8 MS
is currently one of the most common analytical instruments in an array of studies,
including metabolic,9 proteomics,3 genomics,10 and petrolomics.11 In general,
2
analyser, and a detector. The key ionisation techniques, mass analysers, and
fragmentation methods for these studies will be discussed in this section.
1.1.1 Key Ionisation Techniques in Mass Spectrometry
In a mass spectrometer, only charged gas state molecules can be detected,
thus it is important to ionise analytes prior to MS detection. In general, ionisation
techniques can be classified into two categories which are hard and soft ionisation.
Hard ionisation indicates the ionisation process is energetic, fragments and
molecular ions from the analytes are obtained simultaneously.8 Fragments
generated from hard ionisation are useful for elucidating the structures of analytes;
these ionisation methods; however, are not suitable for a mixture of analytes as
complex spectra with multiple fragments from each analyte are generated which
is challenging for data analysis. On the other hand, molecular ions are almost
exclusively generated in soft ionisation which leads to less complicated spectra.
This method is more suitable for the studies of mixtures of analytes, particularly
when it couples with isolation and fragmentation (section 1.1.3) techniques in MS.
1.1.1.1 Electron Ionisation
Electron ionisation (EI) is one of the classic ionisation techniques for MS and
was first introduced by Dempster in 1918.12 In general, an EI source contains a
heated filament, an anode, an inlet for gaseous samples, and an ionisation chamber
(see Figure 1.1). In EI, electrons are generated from a heated filament,
accelerated to ~ 70 eV, and moved towards the anode in an ionisation chamber.8
Vaporised molecules are introduced from the inlet which is orthogonal to the
3
result in the formation of radical cations (M+•). The overall EI process can be
represented by the following equation:
M + e- → M+• + 2e- [Eq.1]
M represents the vaporised molecule, e- represents the electron, and ․represents
the radical.
Figure 1.1. Schematic representation of an EI source (Reproduced from De Hoffmann et al. 2007).8
The energetic radical cations generated from EI are often not stable which
result in further dissociation and generate fragment ions, thus, EI is a hard
ionisation technique. The extensive fragment ions generated during ionisation
provide extra information for structure elucidation of the analytes (see Figure 1.2).
EI is commonly applied to separated, volatile, small molecules;13 the complex
spectra generated from EI, however, limited application to small molecules (~ 600
Da). Gas chromatography (GC) is the most common separation techniques
coupled with EI for clinical, environmental, food/drug analysis, and other
4
Figure 1.2. EI-MS spectrum of pentadecane (C15H32) (Reproduced from the tutorial material provided by SCION Instruments, West Lothian, United Kingdom).
1.1.1.2 Chemical Ionisation
Chemical ionisation (CI) was first introduced by Talrose in 1952 and the
ionisation method was further developed by Munson and Field in 1966.15, 16
Proton transfer is the most common ionisation reaction applied in CI. Reagent
gas molecules, i.e. methane, isobutane, and ammonia etc., are first ionised using
EI.8 The protons generated in the EI process are then transferred to the analyte
molecules if the molecules contain a higher proton affinity than the applied regent
gas. Taking methane (CH4) as an example, the overall CI process can be
represented by the following equations:
Step 1: EI of reagent gas – methane (CH4)
CH4 + e- → CH4+• +2e- [Eq.2]
CH4+• + CH4 → CH5+ + CH3• [Eq.3]
Step 2: Proton transfer
M + CH5+ → MH+ + CH4 [Eq.4]
M represents the vaporised analyte molecule, e- represents the electron, and ․
represents the radical.
5
extensive fragmentation during ionisation.8 The molecular ions (MH+) generated by CI are even-electron molecules which are usually more stable than the
odd-electron radical cations (M+•) produced by EI. Thus, the extent of fragmentation
generated in CI is less than with the EI process, which results in a relative higher
intensity of molecular ion in the CI spectrum. CI also requires volatile and less
complex samples, just like EI.15
1.1.1.3 Matrix Assisted Laser Desorption
Matrix assisted laser desorption (MALDI) was first introduced by Karas and
Hillenkamp in 1985.17-18 It was then applied to a broad range of non-volatile and
thermally labile samples, including polymers, glycoproteins, and large inorganic
molecules. 17, 19 In 1988, Tanaka et al. showed that protein and polymer with m/z
over 100,000 could be analysed by MALDI MS,20 who was then awarded with the
Nobel prize of Chemistry. Since then, MALDI was further applied in large
molecule analysis, such as DNA and proteins.21, 22
Currently, the mechanism of MALDI, especially the origin of ions generated
in MALDI, is still under debate.23-25 In general, desorption and ionisation are the
two important steps to generate a MALDI spectrum. Analytes are first mixed
with matrix solution which contains small organic molecules.
2,5-dihydroxybenzoic acid (DHB), 3,5-dimethoxy-4-hydroxycinnamic acid (SA), and
α-cyano-4-hydroxycinnamic acid (CHCA) are the examples of common matrices
for MALDI for protein and peptide analysis (see Figure 1.3).26, 27 The common
features of these matrices are composed of an aromatic ring for absorbing laser
energy and a functional group for providing a proton for analytes. When samples
(mixed of analytes and matrix) are irradiated with laser, matrix molecules absorb
6
crystals.28, 29 Neutral analyte molecules are vaporised together with the
expanding matrix plume, protons are then transferred from the matrix to the
analyte molecules, and result in the formation of ionized molecules (see Figure
[image:39.595.141.473.440.689.2]1.4).
Figure 1.3. Common matrices (A) 2,5-dihydroxybenzoic acid (DHB), (B) 3,5-dimethoxy-4-hydroxycinnamic acid (SA), and (C) α-cyano-4-hydroxycinnamic
acid (CHCA) to use in protein and peptide analysis with MALDI source.
7
MALDI is a soft ionisation technique which does not induce fragmentation
during ionisation, but excess irradiation from laser energy can still lead to
fragmentation of molecular ions. In general, only singly-charged ions are formed
during MALDI which provides an advantage in spectrum analysis due to less
complexity. Low shot-to-shot reproducibility is one of the major disadvantages
of MALDI, which is contributed mostly by the non-uniform distribution of matrix
and analyte within the layers.
1.1.1.4 Electrospray Ionisation
Electrospray ionisation (ESI) was first introduced by John Fenn in 1984 who
was then rewarded with a Nobel Prize in Chemistry in 2002 for this invention and
its development.30 ESI is generated at atmospheric pressure by applying a strong
electric field to a liquid that flows out slowly from a capillary tube (see Figure
1.5).31-33 The electric field is formed by applying several kilovolts (kV) potential
difference between the capillary tube and the counter electrode, which are
normally separated a few centimetre. Charges are then continuously generated
and accumulated at the liquid surface that located at the tip end of the capillary
(Taylor cone) under the electric field, which leads to the formation of highly
charged droplets. The radial dispersion of the droplets is reduced by using a low
flowrate, coaxial gas (sheath gas) and the solvent on the droplets is continuously
evaporated by a heated inert gas, i.e. nitrogen, or a heated capillary. When the
solvent has evaporated, the sizes of the droplets decrease while the number of
charges retained on the droplets remains the same, which leads to an increase of
the charge per droplet volume, resulting eventually in a “Coulombic repulsion”.
When the “Coulombic repulsion”, which is generated by the charges on the droplet,
8
multiple smaller sized droplets.34 The daughter droplets generated continue to
undergo further Coulombic explosions and then travel along the electric field and
eventually form desolvated ions, which can be detected by the mass analyser.
The detailed mechanism of generating ions from the charged droplets is still under
debate, the ion ejection model (IEM), the charge residue model (CRM), and the
chain ejection model (CEM), however, are the most commonly accepted models
to explain the ions generation of small molecules, large folded proteins, and
unfolded proteins respectively (Figure 1.6).
9
Figure 1.6. ESI models, including ion ejection method (IEM), charge residue method (CRM), and chain ejection method (CEM), that are proposed to explain
the formation of gas phase ions from charged droplets (Reproduced from
Konermann et al. 2012).35
ESI allows the ionisation of very fragile analytes without disrupting the
non-covalent interactions between molecules.36, 37 Compared to MALDI, ESI
generates multiply charged ions through protonation or deprotonation, which
allows large biomolecules to be analysed at a low m/z range and can improve
sensitivity. Furthermore, ESI can easily couple with high performance liquid
chromatography (HPLC) and capillary electrophoresis (CE), which are the two
common methods for the separation of biomolecules.38, 39 ESI, therefore, has a
wide range of applications including proteins,40 DNA,41 polymers,42 and small
polar molecules.43 The major disadvantages of ESI include sensitivity to salt
[image:42.595.198.415.80.316.2]10
1.1.1.5 Nano Electrospray Ionisation
Nano electrospray ionisation (nESI) is a nano flow analogue of ESI (section
1.1.1.4) to increase sensitivity of ESI. The orifice of the nESI emitter (~ 0.5 –5
µm) is much smaller than ESI, the droplets formed in the ionisation process,
therefore, are initially much smaller.44 The smaller droplets formed during the
nESI process are believed to allow a more efficiency desolvation which results in
higher efficiency of converting charged droplets to gas phase ions, leading to
improvement in ionisation efficiency compared to the ESI source. A schematic
of nESI is shown in Figure 1.7.
Figure 1.7. The schematic diagram of nESI (Reproduced from Mandal et al. 2012).45
In addition to the difference in sample consumption, lower voltages (0.5 – 1.5
kV) can be used in the nESI process. Furthermore, the source temperature
applied in the nESI can be lower than the ESI as the droplets formed are smaller
which requires less desolvation. This feature is of particular importance for the
studies of native proteins using MS as high source temperature can unfold/denature
11
1.1.2 Mass Analysers
Once ions are generated from the ionisation source, they are transmitted down
to the mass analyser by electric potentials, separated according to their m/z, then
detected and measured by the mass analyser. In this section, three major mass
analysers, quadrupole, time-of-flight (TOF), and Fourier transform ion cyclotron
resonance (FTICR) MS, will be discussed.
Different mass analysers have different principles to separate ions, for
example, quadrupole separates ions according to their m/z trajectory stabilities,
TOF separates ions according to their flight velocities (flight time), and FTICR
separates ions according to their resonance frequencies. Mass analysers can be
further classified into two groups according to the ion transmission properties.
Some analysers, i.e. quadrupole, allow only ions with a particular m/z to pass
through at a particular time, and some analysers, i.e. TOF and FTICR, allow the
concurrent detection of all ions.
Mass range, speed of analysis, mass accuracy, and resolving power are the
four main characteristics for evaluating the performance of a mass analyser.
Mass range is the limitation of m/z range that a mass analyser can measure in a
single scan. Speed of analysis is the rate required to measure over a particular
mass range in a mass analyser.
Mass accuracy is the accuracy of the m/z measured by a mass analyser which
is calculated by the difference between theoretical (exact) and measured m/z.
Parts-per-million (ppm) is the common unit for the expression of mass accuracy
(see Eq. 5). Mass accuracy is also affected by the stability and the resolving
power of a mass analyser (if other species interfere with the measurement). Mass
analysers with high mass accuracies help to improve elemental composition
12
Error (ppm) =
(𝑚𝑒𝑎𝑠𝑢𝑟𝑒𝑑 𝑚/𝑧−𝑡ℎ𝑒𝑜𝑟𝑒𝑡𝑖𝑐𝑎𝑙 𝑚/𝑧)𝑡ℎ𝑒𝑜𝑟𝑒𝑡𝑖𝑐𝑎𝑙 𝑚/𝑧
𝑥 10
6 [Eq. 5]
Resolving power is the ability of a mass analyser to distinguish two signals
from two ion packets with a small difference in their m/z ratios. The resolving
power can be calculated by m/Δm50% (see Figure 1.8), where m is the m/z value
of the peak andΔm50% is the peak width measured at half maximum (FWHM).
A greater resolving power indicates the mass analyser has a higher ability to
distinguish ions with small m/z differences, therefore, a high resolving power mass
[image:45.595.210.408.302.494.2]analyser is useful in complicated sample measurement.48, 49
Figure 1.8. Resolving power calculated by Full Width Half Maximum (FWHM).
1.1.2.1 Quadrupole Mass Analyser
The principle of the quadrupole analyser was first introduced by Paul and
Steinwegen in 1953.50 The quadrupole was further developed into a commercial
instrument by Shoulders, Finnigan, and Story.51
A quadrupole consists of four circular rods which are parallel to each other
and the rods are connected oppositely in pairs (see Figure 1.9). Ions are injected
and travel along the z axis, and oscillate in the x and y plane. The oscillation of
13
(U), and radio frequency (RF) amplitude (V) on the rods. The potentials on the
different pairs of rods are set to be out of phase by 180o and rapidly oscillate
between the pairs of rod, which results in the formation of low field regions (saddle
points) to transmit particular m/z ions (see Figure 1.10).8, 52, 53 Only particular
ions with the stability of the trajectories at the particular U and V values can be
transmitted and detected, while other unstable ions are discharged onto the rods,
neutralised and cannot be detected.
Figure 1.9. The layout of a quadrupole which contains four parallel rods, connecting diagonally in pairs of positive and negative terminals (Reproduced
14
Figure 1.10. The formation of saddle points by rapidly oscillating the electric potential on the opposite pair of rods in order to retain the positive charged ion in
the centre of the quadrupole (See
https://aquadrupauliontrap.wordpress.com/the-mechanical-analogue for information, accessed 02nd Oct, 2018).
Ions are accelerated before entering the quadrupole, then remain at the same
velocity in the z axis during the transmission through quadrupole. The trajectory
stability of ions in the xz and yz planes can be represented by the following
equations:54
a = 8𝑞𝑈
𝑚𝑟02𝜔2
[Eq.6]
q = 4𝑞𝑉
𝑚𝑟02𝜔2
[Eq.7]
where a and u are directly proportional to the U and V values respectively, q is the
ion charge, m is the ion mass, r0 is the field radius, and ω is the angular frequency.
For different m/z ions, the a and q values obtained from equation 6 and 7 are
different which results in generating various stability areas. Since the U and V
values are the two variables for different m/z ions, a stability area as a function of
15
shown in Figure 1.11, each m/z ion is stable under its stability area and is
discharged outside the area. During data acquisition, the quadrupole varies the
U and V values.
Figure 1.11. Representation of the stability diagram of ions in a quadrupole. Ions are represented by m1, m2, and m3 with increasing the mass respectively.
Each ion is stabilised under its area, i.e. m1 ion is only stabilised in the green area,
and being transmitted down the quadrupole to the detector. The quadrupole scans
according to the scan line and only a particular ion can be transmitted to the
detector each time.
The quadrupole is commonly used as an ion guide, collision cell, and mass
analyser by varying the U/V value. When a quadruple is an ion guide or collision
cell, the U value is set to zero and the quadrupole is RF-only, which allows all ions
to pass through the quadrupole down to the low mass cut off (LMCO). When a
quadrupole is a mass analyser, the U/V value is adjusted to a particular ratio that
only specific m/z ion can pass through the quadrupole, the resolving power of
quadrupole, therefore, can be adjusted by varying the U/V value.
16
FWHM resolution is usually around 2000 (at m/z 1000), the mass accuracy is
around 100 ppm, and the operating pressure is around 10-5 Torr.8 The quadrupole
is widely applied in different research studies because of its robustness, reliability,
small footprint, and lower-cost production.55, 56 Quadrupoles are also commonly
used as an ion guide and collision cell in order to couple with other mass analysers,
e.g. TOF and FTICR, to achieve tandem MS (section 1.1.3).57, 58 The major
disadvantages of a quadrupole are low resolving power and limited mass range.
1.1.2.2 Time-of-flight Mass Analyser
The principle of the time-of-flight (TOF) mass analyser was first introduced
by Stephens in 1946 and was further designed into the first commercial instrument
(linear TOF mass analyser) in 1955 by Wiley and McLaren.59, 60
In TOF-MS, ions generated from an ion source are accelerated through the
flight tube by an electric field which is caused by the potential difference between
the electrode and extraction grid. To a first-order approximation, all ions obtain
same kinetic energy in the acceleration region, and drift in a flight tube which is a
free-field region according to their m/z, and reach the detector at different times,
allowing separation of ions by m/z ratios (see Figure 1.12). The process of ion
drifting in TOF mass analyser can be represented by the following equations:
Kinetic energy obtained by the ion:
E = 12𝑚𝜐2 = qV [Eq. 8]
Velocity of the ion (rearranged from Eq. 8):
υ = √2𝑞𝑉𝑚 [Eq. 9]
where E is the kinetic energy obtained by the ion, m is the ion mass, υ is the ion
17
potential difference between electrode and extraction grid.
Figure 1.12. The outline of a linear TOF (Reproduced from Opsal et al. 1985).61 Ions (black dot) are accelerated in the yellow region by the electric potential, drift
through the green region (flight tube), and reach the detector (right).
Eq. 9, it shows the velocity of ion is inversely proportional to the mass1/2
which indicates heavier ions have a lower velocity, thus they require a longer time
to drift through a flight tube and vice versa. The time for ion to reach a detector
can be calculated by the following equation:
t = 𝐿
𝜐 [Eq. 10]
where t is the ion drift time across the flight tube and L is the length of flight tube.
The time for ions to reach a detector can be presented in terms of ion mass by
combining Eq. 9 and Eq. 10 as follows:
t = √𝑚𝐿2𝑞𝑉2 = √𝑚𝑧 √2𝑒𝑉𝐿2 [Eq. 11]
where z is the number of charge on the ion and e is the charge constant.
Previous results showed that a linear TOF mass analyser could detect protein
samples in 100 – 200 attomole amounts.62, 63 In a linear TOF mass analyser, there
is, in theory, no upper mass limit which makes it suitable for the detection of large
18
fast, in which a spectrum can be obtained in ~100 micro-seconds.8
In reality, the kinetic energies obtained by each ion are slightly different,
which results in the spreading of ions (with same m/z) drift times and causes peak
broadening and decreases mass resolution. In order to minimise the spreading of
ion’s (same m/z) drift time, delayed pulsed extraction and reflectron are the two
common techniques that applied to correct the kinetic energy differentiation
between ions (see Figure 1.13). In delayed pulsed extraction, a delayed pulse is
applied to all ions and ions with lower kinetic energy stay in the acceleration region
longer than higher kinetic energy ions which results in lower kinetic energy ions
obtain more energy before entering the flight tube. Since the initial lower kinetic
energy ions receive more energy in the acceleration region, the velocities of these
ions increase and catch up with the initial higher kinetic energy ions in the flight
19
Figure 1.13. The implication of a delayed pulsed extraction in a TOF mass analyser which improves the mass resolution (Reproduced from De Hoffmann et
al. 2007).8 The black dot represents an ion with higher kinetic energy, while the
white dot represent an ion with lower kinetic energy. The white dot (low kinetic
energy ion) stays longer in the acceleration region which gains more energy before
entering the flight tube, as a result the velocity of white dot is higher than the black
dot and both dots reach the detector at the same time.
The reflectron is also used to correct the kinetic energy spreading between
ions. This idea was first introduced by Mamyrin in 1973.66 The reflectron,
placed opposite to the source and detector, acts like a mirror which reflects the ions
[image:52.595.165.447.85.421.2]