Non-Orthogonal Multiple Access combined with
Random Linear Network Coded Cooperation
Amjad Saeed Khan,
Student Member, IEEE,
and Ioannis Chatzigeorgiou,
Senior Member, IEEE
Abstract—This letter considers two groups of source nodes. Each group transmits packets to its own designated destination node over single-hop links and via a cluster of relay nodes shared by both groups. In an effort to boost reliability without sacrificing throughput, a scheme is proposed, whereby packets at the relay nodes are combined using two methods; packets delivered by different groups are mixed using non-orthogonal multiple access principles, while packets originating from the same group are mixed using random linear network coding. An analytical framework that characterizes the performance of the proposed scheme is developed, compared to simulation results and benchmarked against a counterpart scheme that is based on orthogonal multiple access.
Index Terms—Network coding, non-orthogonal multiple access, sparse random matrices, decoding probability, throughput.
I. INTRODUCTION
Random Linear Network Coding (RLNC) is a scheme that allows an intermediate node to combine and forward the data of multiple users in a single transmission, and can effectively improve network capacity [1]. RLNC has the inherent capabil-ity to achieve spatial diverscapabil-ity. For example, it has been shown in [2] that network coding can improve the diversity gain of networks that either contain distributed antenna systems or support cooperative relaying. Furthermore, RLNC can improve both the throughput [1] and the latency in a network [3] by reducing the number of distinct transmissions.
The benefits of network coding have made it an attractive solution for challenges encountered in existing and future communication systems. For instance, it has been shown in [4] that by modifying the IEEE 802.11g frame structure, network coding combined with Orthogonal Frequency Division Mul-tiplexing (OFDM) can significantly improve throughput. The importance of network-coded cooperation has been demon-strated in [5] and implemented in [6] with Orthogonal Fre-quency Multiple Access (OFDMA). Recently, Non-Orthogonal Multiple Access (NOMA) has been recognised as a promising multiple access technique for 5G mobile networks [7], [8]. It has been shown in [9], [10] that combining NOMA with OFDM can improve the spectral efficiency and accommodate more users than the conventional OFDMA-based systems. Moreover, the usefulness of RLNC for downlink NOMA-based transmissions has been studied in [11].
This letter considers network-coded cooperation in a NOMA-based scenario with two groups of source nodes. Each
Copyright (c) 2017 IEEE. Personal use of this material is permitted. However, permission to use this material for any other purposes must be obtained from the IEEE by sending a request to [email protected]. A. S. Khan and I. Chatzigeorgiou are with the School of Computing and Communications, Lancaster University, Lancaster, United Kingdom (e-mail:
{a.khan9, i.chatzigeorgiou}@lancaster.ac.uk).
group communicates with a different destination node via multiple relay nodes. To the best of our knowledge, this work represents the first attempt to characterise the performance of NOMA-based RLNC cooperation. The main contributions of our work can be summarized as follows: (i) we propose a framework which integrates the benefits of NOMA-based multiplexing and RLNC-based cooperative relaying; (ii) using the fundamentals of RLNC and uplink/downlink NOMA, we derive closed-form expressions for the network performance, in terms of the decoding probability at each node, and the system throughput; (iii) we validate the accuracy of the derived expressions through simulations and we investigate the impact of the system parameters on the network performance and throughput.
II. SYSTEMMODEL
Consider a network with two source groups, two des-tination nodes and N commonly shared relay nodes
r1,r2, . . . ,rN. Each source groupGkcontainsKsource nodes s(1k),s(2k), . . . ,s(Kk) for k = 1,2. The packets transmitted by source nodes inGkare meant to be received by destinationdk,
either directly or via relay nodes. The acceptable transmission rate forG1isR∗1and forG2isR∗2. Without loss of generality,
we assume that all source nodes inG1require a comparatively
high quality of service withR∗1 < R∗2. In practice, G1 could
be a group of devices (e.g., sensors) associated to high risk applications that need to be connected quickly with low data rate, and G2 could be a group of devices related to low
risk applications that can afford opportunistic connectivity. All nodes operate in half duplex mode. The links connecting the nodes are modeled as quasi-static Rayleigh fading channels. The channel gain between nodesiandjis represented byhij, which is a zero-mean circularly symmetric complex Gaussian random variable with varianceσ2ij.
Before the communication process is initiated, source nodes from the two groups are paired according to their indices, such that s(1)i in group G1 is paired with s
(2)
i in G2. Only
paired nodes are allowed to transmit simultaneously over the same frequency band. The simultaneous transmission of two nodes exploits the principle of superposition coding, which is a key component of NOMA. Node pairing in NOMA has been recently proposed for 3GPP Long Term Evolution Advanced (LTE-A) [12]. Source nodes in different pairs transmit over orthogonal frequency bands, and therefore can be recovered independently. This approach is also known as OFDM-NOMA [9] but, for the sake of brevity, we shall simply refer it to as NOMA. We consider the worst case scenario, in which both source groups contain an equal (i.e.,
receive superimposed signals. The proposed communication process is divided into the broadcast phase and the relay phase. During the broadcast phase, each source node broadcasts a packet in the form of an information-bearing signal to the relay and destination nodes. The signals transmitted by theith
source pair (s(1)i ,s(2)i ), and received by a relay node rj and
destination nodesd1 andd2, are respectively given by
zrij =√α1Pshs(1) i rjxi˜ +
√
α2Pshs(2)
i rjyi˜ +w i
rj,
zdi1=
√
α1Pshs(1)
i d1xi˜ +w i
d1,
zdi
2=
√
α2Pshs(2)
i d2y˜i+w i
d2,
where Ps is the total transmission power by the source pair,
α1andα2are the fractions ofPstransmitted bys (1)
i ands
(2)
i ,
respectively, with α1+α2 = 1, and {xi,˜ yi˜} represent the
modulated signals of data packets{xi, yi}. The additive white Gaussian noise components at the relay and destination nodes are represented bywi
rj andw i
dk, respectively. All relay nodes
employ Successive Interference Cancellation (SIC) to recover the transmitted signals, and then disjointly demodulate and store the correctly received packets.
During therelay phase, a relay noderj employs RLNC on
the successfully received and stored data packets of groupsG1
andG2, and generates coded packetsm (1)
j andm
(2)
j ,
respec-tively, given bym(1)j =∑Ki=1c(1)i,jxiandm(2)j =∑Ki=1c(2)i,jyi,
where, c(i,jk) represents the coding coefficients over a finite field Fq of size q. The value of a coefficient is zero if a received packet contains irrecoverable errors; otherwise, the value of that coefficient is selected uniformly at random from the remaining q−1 elements of Fq. The probability mass
function of c(i,jk) is given as
Pr(c(i,jk)=t)=
ϵs(k)
i rj, fort= 0,
1−ϵs(k)
i rj
q−1 , fort∈Fq\ {0},
(1)
where 0 ≤ ϵs(k)
i rj ≤ 1 is the outage probability of the
link connecting the source node s(ik)with the relay node rj.
The closed form expression of ϵs(k)
i rjwill be presented in
Section III. This type of RLNC at the relay nodes is known as
sparse RLNC, where the sparsity level is determined by the
outage probabilityϵs(k)
i rj [13], [14].
Each relay node, instead of transmitting two separate network-coded signals (one for each destination), generates a signal that is the superposition of the two network-coded signals and broadcasts it to both destinations. Relay transmis-sions are orthogonal, either in time or in frequency. The su-perimposed signal transmitted by relayrjcan be expressed as
(√Prβ1m˜
(1)
j +
√
Prβ2m˜ (2)
j ), where Pr is the total transmitted
power, and β1, β2 denote the power allocation coefficients,
such that β1+β2 = 1 withβ1 > β2 in order to satisfy the
quality of service requirement [15]. Thus, the received signal at destinationdk is given as
ˆ zdj
k=hrjdk(
√
Prβ1m˜ (1)
j +
√
Prβ2m˜ (2)
j ) + ˆw
j
dk
wherewˆjd
kis the Gaussian noise component. Each destination
node employs SIC in order to separate the superimposed
signals and retrieve the relevant coded packets. Destinationdk
will recover the data packets of source groupGk if it collects Klinearly independent packets directly from that source group and via the relay nodes.
III. ACHIEVABLE RATE AND LINK OUTAGE PROBABILITY
This section describes the achievable transmission rate of source-to-destination, source-to-relay and relay-to-destination links. An outage occurs when the achievable rate is less than the target rate of transmission. Therefore, the outage probability of each link can be expressed in terms of the corresponding achievable rate and the target rate.
Let us first consider the broadcast phase, during which signals arrive at each destination node directly from the respective source group. The achievable rate of thes(ik)dk link,
which originates from groupGk, can be obtained as
Rs(k)
i dk=Bslog
(
1 +
Psαk|hs(k) i dk|
2
BsN0 )
(2)
wherek∈ {1,2},i∈ {1,2, . . . , K},N0 represents the noise
power and Bs denotes the bandwidth of the frequency band allocated to each source pair for simultaneous transmissions, as discussed in Section II. The outage probability of the
s(ik)dk link can be derived if we combine expression (2) with
the cumulative distribution function of Rayleigh fading [16, eq. (7.6)], which gives
ϵs(k)
i dk= Pr(Rs(k)i dk≤R
∗
k) = 1−exp(−
τk ρsαkσ2
s(k)i dk )
whereρs= BPsNs0 andτk = 2R ∗
k/Bs −1. The achievable rate
of the link between one of the nodes of a source pair and a relay noderj depends on the channel conditions of both links
that connect the nodes of the source pair withrj. For example,
assume thatα1|hs(1)
i rj|> α2|hs(2)i rj|. In that case, SIC at the
relay noderjwill first recover the signal of the node fromG1
and treat the other signal as interference. Thus, the achievable rate of a link between s(ik)andrj can be expressed as [17]
Rs(1)
i rj =Bslog
(
1 +
α1|hs(1) i rj|
2
α2|hs(2) i rj|
2+ 1/ρ s
)
(3)
Rs(2)
i rj =Bslog
(
1 +ρsα2|hs(2)
i rj|
2). (4)
The outage probability of a link between s(ik) and rj can be
obtained asϵs(1)
i rj = Pr(Rs(k)i rj < R
∗
k), thus
ϵs(1)
i rj = 1−
α1σ2 s(1)i rj τ1α2σ2
s(2)i rj
+α1σ2
s(1)i rj
exp(− τ1
ρsα1σ2 s(1)i rj
)
ϵs(2)
i rj = 1−Pr [
(Rs(1)
i rj > R
∗
1)∩(Rs(2)i rj> R
∗
2)
]
= 1−
α1σ2s(1)
i rj
τ1α2σ2 s(2)i rj
+α1σ2 s(1)i rj
exp(−τ1(τ2+ 1)
ρsα1σ2 s(1)i rj
− τ2
ρsα2σ2 s(2)i rj
).
During the relay phase, the destination node d2 can only
other hand, the destination d1 can recover the coded signals
of G1, whenRrjd1 > R∗1. The achievable rates are given as
Rrjd1 =Bslog
(
1 + β1|hrjd1|
2
β2|hrjd1|
2+ 1/ρ r
)
(5)
Rrjd2=Bslog
(
1 +ρrβ2|hrjd2|
2) (6)
where Bs is the bandwidth allocated to each pair of relays,
and ρr = BPsNr0. It is assumed that β1 ≥τ1β2, otherwise the
outage probability is always one [7]. The outage probability of linksrjd1 andrjd2 can be respectively obtained as
ϵrjd1 = Pr(
β1|hrjd1|
2
β2|hrjd1|
2+ 1/ρ r ≤
τ1)
= 1−exp(− τ1
(ρrβ1−τ1ρrβ2)σ2rjd1 ),
ϵrjd2 = 1−Pr(
β1|hrjd2|
2
β2|hrjd2|
2+ 1/ρ r
> τ1, ρrβ2|hrjd2|
2> τ 2)
= 1−exp(− 1
ρrσr2jd2
max( τ1
β1−τ1β2
,τ2 β2
)).
OMA-based Benchmark scheme
In this letter, we consider conventional OFDMA as the benchmark Orthogonal Multiple Access (OMA) scheme. Ac-cording to this scheme, all nodes s(ik) and rj transmit over
orthogonal frequency bands. As a result, likewise (2), the achievable rates of source-to-relay and source-to-destination links during the broadcast phase, and the relay-to-destination links during the relay phase can be respectively obtained as
Rs(k)
i u
= Bs
2 log(1 +
Psαk|hs(k) i u|
2
0.5BsN0
),
Rrjdk= Bs
2 log(1 +
Prβk|hrjdk|
2
0.5BsN0
)
where u ∈ {rj,dk}. The factor 1/2 is due to the fact that,
unlike NOMA, each sub-band is now further split between two transmitting nodes. Note that, using the achievable rates, we can derive the outage probabilities. These results can be further extended to RLNC-based analysis, which will be presented in the next section, and can be used as benchmarks against the proposed NOMA-based scheme.
In the remainder of the letter, we assume that links con-necting co-located transmitting nodes with receiving nodes are statistically similar, hence ϵrjdk =ϵrdk, ϵs(k)i rj =ϵs(k)r and ϵs(k)
i dk=ϵs(k)dk for all valid values of i,j andk.
IV. DECODING PROBABILITY ANDANALYSIS
This section analyses the system performance in terms of the probability of a destination node successfully recovering the packets of all nodes in the corresponding source group. Furthermore, the system throughput is derived as a function of the number of packet transmissions.
The destination node dk can recover the packets of all
source nodes in groupGk if and only if it collects packets that
yieldKdegrees of freedoms (dofs). Note that dofs at a destina-tion node represent successfully received linearly independent
packets, which can be either source packets delivered during the broadcast phase, or coded packets transmitted during the relay phase. According to [14, eq. (5)] and [14, eq. (8)], the probability that theN ≥K coded packets, which have been transmitted by the N relay nodes, will yield K dofs can be bounded as follows:
P′(K, N, ϵs(k)r, q)≥max {∏K
i=1 (
1−ΓNmax−i+1),1−
K
∑
w=1 (
K w
) ×
×(q−1)w−1[q−1+ (1−q−1)(1−1−ϵs(k)r
1−q−1
)w]N}
(7)
whereΓmax= max {
ϵs(k)r,
1−ϵs(k)r
q−1
}
.
In order to formulate the decoding probability at each destination node, let us assume that the destination dk
suc-cessfully receivedmpackets, given thatK+N packets were transmitted, i.e.,K source packets during the broadcast phase and N coded packets during the relay phase. If we denote by fℓ(NT, ϵ) the probability mass function of the binomial
distribution, that is,
fℓ(NT, ϵ) = (
NT
ℓ
)
ϵNT−ℓ(1−ϵ)ℓ (8)
then the probability thathof thempackets are source packets and the remainingm−hare coded packets is given by
Ph/m(ϵs(k)d
k, ϵrdk) =fh(K, ϵs(k)dk)fm−h(N, ϵrdk). (9)
The contribution of the hrecovered source packets to the
m−h coded packets can be removed, so that the m−h
coded packets become linear combinations of the remaining
K−hsource packets only. Thus, at this point of the decoding process, the destination nodedk can successfully recover the
remaining data packets if and only if the modified m−h
coded packets yield K−h dofs. By employing (7), (9) and the law of total probability, the overall decoding probability at the destinationdk can be expressed as
Pdk(K, N) =
N∑+K
m=K K
∑
h=hmin
Ph/m(ϵs(k)d
k, ϵrdk)P′(K−h, m−h, ϵs(k)r, q)
(10) wherehmin= max(0, m−N).
Note that retransmissions are not allowed in case of packet failures during the broadcast phase or the relay phase. There-fore, by modifying the expression of the end-to-end throughput in [18], the average system throughput can be defined as
η= K
K+ max{Ed1(N), Ed2(N)}
(11)
whereEdk(N) is the average number of relay nodes needed
by each destination nodedk to recover the entire source group Gk, and can be calculated using [19]
Edk(N) =N− N∑−1
v=0
Pdk(K, v). (12)
Moreover, by following (12), the average number of re-lays required for both destinations to decode the pack-ets of the respective source groups can be repre-sented as ET(N) = N −
∑N−1
v=0 Pjoint(K, v), where
5 10 15 20 25 30 0
0.1 0.2 0.3 0.4 0.5 0.6 0.7 0.8 0.9 1
SNRρ¯(dB)
D
ec
o
d
in
g
P
ro
b
a
b
il
it
y
NOMA-RLNC (d1)
NOMA-RLNC (d2) OMA-RLNC (d1)
OMA-RLNC (d2)
Simulation
Figure 1: Simulation results and performance com-parison between NOMA-RLNC and OMA-RLNC, whenK= 20,N= 10andq= 4.
5 10 15 20 25
0 0.1 0.2 0.3 0.4 0.5 0.6 0.7 0.8 0.9 1
Number of Relays (N)
J
o
in
t
D
ec
o
d
in
g
P
ro
b
a
b
il
it
y
Pjo
in
t
NOMA-RLNC (q= 2) NOMA-RLNC (q= 4) NOMA-RLNC (q= 64) Simulation
Figure 2: Effect of the field sizeqand the number of relay nodesNon the joint decoding probability, whenK= 20.
15 20 25 30
0 5 10 15 20 25
Av
er
a
g
e
Nu
m
b
er
o
f
re
la
y
s
ET
(
N
)
SNRρ¯(dB)
[image:4.612.67.434.71.187.2]NOMA-RLNC OMA-RLNC
Figure 3: Comparison between the two schemes in terms of the required average number of relay nodes and the SNR whenK= 20andq= 4.
V. NUMERICALRESULTS
In this section, the accuracy of the derived analytical bound in (7), when used in combination with the decoding probability in (10), is verified through simulations. In the considered system setup, the bandwidth of each sub-band is normalized to 1, i.e., Bs= 1. The source nodes and relay nodes have
been positioned such that σs2(1)d
1= 0.1458,σ
2 s(2)d
2 = 0.1458,
σ2
s(1)r= 2.9155,σ
2
s(2)r= 1,σ
2
rd1 = 1.3717andσ
2
rd2 = 1.9531.
We set α1 = 0.6 and α2 = 0.4, while exhaustive search has
been used to identify the values of β1 andβ2 that maximize
the joint decoding probability mentioned in Section IV. The average system SNR is set equal to ρs =ρr= ¯ρ and, unless
[image:4.612.328.540.426.547.2]otherwise stated, we consider R1∗= 1,R∗2= 1.5.
Fig. 1 shows the decoding probabilitiesPd1 andPd2 at the
two destination nodes in terms of the system SNR. The figure clearly demonstrates the tightness of the analytical curve to the simulation results. The decoding probabilityPd1 is greater
than Pd2 because node d1 supports a lower target rate than
node d2, and d1 is allocated more power than d2 to ensure
that the quality of service requirements are met. As expected, NOMA-RLNC outperforms OMA-RLNC because each source node in NOMA-RLNC benefits from being allocated twice the bandwidth that is allocated in OMA-RLNC.
Fig. 2 shows the joint decoding probability, for different values of field size q, as a function of the number of relays. The analytical bound is close to the simulation results for
q= 2and becomes tighter for greater values ofq. A significant gain in performance can be observed when the field size increases from q= 2toq= 4. However, the increase in gain is markedly smaller when q further increases from 4 to 64. This is because the certainty of linear independence between coded packets increases with the field size and approaches the highest possible degree even for relatively small values of q. We stress that the computational complexity of the decoder at the destination nodes also depends on the value ofq. Thus, the choice of the field size over which RLNC is performed results in a trade-off between complexity and performance gain.
Fig. 3 illustrates the relationship between the system SNR and the average number of relays required for the decoding of the source packets of both source groups by the respective destination nodes. The curves establish the diversity advantage offered by the combination of NOMA with RLNC as opposed to OMA with RLNC. For a fixed value of SNR, OMA-RLNC
clearly needs more relays for cooperation than NOMA-RLNC. Alternatively, OMA-RLNC can achieve the same performance as NOMA-RLNC at the expense of a higher SNR.
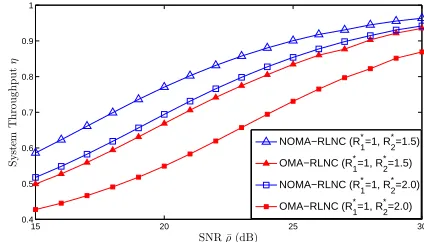
Fig. 4 presents the system throughput as a function of the system SNR, for different target rates. The performance gap between NOMA-RLNC and OMA-RLNC is evident. We observe that, for a fixed SNR value, when the target rate increases from R∗2 = 1.5 to R∗2 = 2, the outage
probabil-ity increases and, therefore, the system throughput reduces. Interestingly, an increase in the target rate also increases the performance gap between NOMA-RLNC and OMA-RNC, that is, the throughput degradation of NOMA-RLNC is less severe than that of OMA-RLNC. An intuitive reason for this observation is that the 1/2 spectral loss in OMA dominates the system throughput.
15 20 25 30
0.4 0.5 0.6 0.7 0.8 0.9 1
SNRρ¯(dB)
S
y
st
em
T
h
ro
u
g
h
p
u
t
η
NOMA−RLNC (R 1
*=1, R
2
*=1.5)
OMA−RLNC (R 1
*=1, R
2
*=1.5)
NOMA−RLNC (R 1
*=1, R
2
*=2.0)
OMA−RLNC (R 1
*=1, R
2
*=2.0)
Figure 4: Effect of target rates on the system throughput against the system SNR, whenK= 20andq= 4.
VI. CONCLUSIONS
REFERENCES
[1] T. Ho, M. M´edard, R. Koetter, D. R. Karger, M. Effros, J. Shi, and B. Leong, “A random linear network coding approach to multicast,”
IEEE Trans. Inf. Theory, vol. 52, no. 10, pp. 4413–4430, Oct. 2006. [2] Y. Chen, S. Kishore, and J. Li, “Wireless diversity through network
coding,” inIEEE Wireless Communications and Networking Conference, Las Vegas, USA, Apr. 2006.
[3] D. Szabo, A. Gulyas, F. H. P. Fitzek, and D. E. Lucani, “Towards the tactile internet: Decreasing communication latency with network coding and software defined networking,” in Proc. 21st European Wireless Conf., Budapest, Hungary, May 2015.
[4] X. Wang, Y. Xu, and Z. Feng, “Physical-layer network coding in OFDM system: Analysis and performance,” in International Conference on Communications and Networking, Kunming, China, Aug. 2012. [5] S. T. Bas¸aran, G. K. Kurt, M. Uysal, and ˙I. Altunbas¸, “A tutorial on
network coded cooperation,” IEEE Commun. Surveys Tuts., vol. 18, no. 4, pp. 2970–2990, Fourthquarter 2016.
[6] S. G¨okceli, H. Alakoca, S. T. Bas¸aran, and G. K. Kurt, “OFDMA-based network-coded cooperation: Design and implementation using software-defined radio nodes,”EURASIP Journal on Advances in Signal Processing, vol. 2016, no. 1, p. 8, Jan. 2016.
[7] Z. Ding, Z. Yang, P. Fan, and H. V. Poor, “On the performance of non-orthogonal multiple access in 5G systems with randomly deployed users,”IEEE Signal Process. Lett., vol. 21, no. 12, pp. 1501–1505, Dec. 2014.
[8] S. Timotheou and I. Krikidis, “Fairness for non-orthogonal multiple access in 5G systems,”IEEE Signal Process. Lett., vol. 22, no. 10, pp. 1647–1651, Oct. 2015.
[9] X. Li, C. Li, and Y. Jin, “Dynamic resource allocation for transmit power minimization in OFDM-based NOMA systems,”IEEE Commun. Lett., vol. 20, no. 12, pp. 2558–2561, Dec. 2016.
[10] P. Parida and S. S. Das, “Power allocation in OFDM based NOMA systems: A DC programming approach,” inIEEE Globecom Workshops (GC Wkshps), Dec. 2014.
[11] S. Park and D.-H. Cho, “Random linear network coding based on non-orthogonal multiple access in wireless networks,”IEEE Commun. Lett., vol. 19, no. 7, pp. 1273–1276, Jul. 2015.
[12] 3rd Generation Partnership Project (3GPP), “Study on downlink mul-tiuser superposition transmission for LTE,” Shanghai, China, Mar. 2015. [13] J. Bl¨omer, R. Karp, and E. Welzl, “The rank of sparse random matrices over finite fields,”Random Structures and Algorithms, vol. 10, no. 4, pp. 407–420, Jul. 1997.
[14] A. S. Khan and I. Chatzigeorgiou, “Improved bounds on the decoding failure probability of network coding over multi-source multi-relay networks,”IEEE Commun. Lett., vol. 20, no. 10, pp. 2035–2038, Oct. 2016.
[15] Z. Ding, L. Dai, and H. V. Poor, “MIMO-NOMA design for small packet transmission in the internet of things,”IEEE Access, vol. 4, pp. 1393– 1405, Apr. 2016.
[16] A. Goldsmith,Wireless communications. Cambridge University Press, 2005.
[17] Y. Saito, Y. Kishiyama, A. Benjebbour, T. Nakamura, A. Li, and K. Higuchi, “Non-orthogonal multiple access (NOMA) for cellular future radio access,” in Proc. IEEE Veh. Tech. Conf. (VTC Spring), Dresden, Germany, Jun. 2013.
[18] X. Wang, W. Chen, and Z. Cao, “SPARC: superposition-aided rateless coding in wireless relay systems,”IEEE Trans. Veh. Technol., vol. 60, no. 9, pp. 4427–4438, Nov. 2011.
[19] I. Chatzigeorgiou and A. Tassi, “Decoding delay performance of random linear network coding for broadcast,”IEEE Trans. Veh. Technol., vol. PP, no. 99, Feb. 2017.