warwick.ac.uk/lib-publications
Original citation:Kwon, J., Kim, S. W., Ungar, W. J., Tsiplova , K., Madan, Jason and Petrou, Stavros. (2017) A systematic review and meta-analysis of childhood health utilities. Medical Decision Making.
Permanent WRAP URL:
http://wrap.warwick.ac.uk/92083 Copyright and reuse:
The Warwick Research Archive Portal (WRAP) makes this work by researchers of the University of Warwick available open access under the following conditions. Copyright © and all moral rights to the version of the paper presented here belong to the individual author(s) and/or other copyright owners. To the extent reasonable and practicable the material made available in WRAP has been checked for eligibility before being made available.
Copies of full items can be used for personal research or study, educational, or not-for profit purposes without prior permission or charge. Provided that the authors, title and full bibliographic details are credited, a hyperlink and/or URL is given for the original metadata page and the content is not changed in any way.
Publisher’s statement:
Kwon, J., Kim, S. W., Ungar, W. J., Tsiplova , K., Madan, Jason and Petrou, Stavros. (2017) A systematic review and meta-analysis of childhood health utilities. Medical Decision Making.. Copyright © 2017 The Authors Reprinted by permission of SAGE Publications.
Published version: https://doi.org/10.1177/0272989X17732990
A note on versions:
The version presented here may differ from the published version or, version of record, if you wish to cite this item you are advised to consult the publisher’s version. Please see the ‘permanent WRAP url’ above for details on accessing the published version and note that access may require a subscription.
1
A Systematic Review and Meta-Analysis of Childhood Health
Utilities
Joseph Kwon, MSc,1 Sung Wook Kim, PhD,2 Wendy J. Ungar, PhD,3,4 Kate Tsiplova, MSc,3
Jason Madan, PhD,2 Stavros Petrou, PhD.2
1 Department of Economics, University of Warwick, Coventry, UK;
2 Warwick Medical School, University of Warwick, Coventry, UK;
3 Program of Child Health Evaluative Sciences, The Hospital for Sick Children Research
Institute, Toronto, Canada;
4 Institute of Health Policy, Management and Evaluation, University of Toronto, Toronto,
Canada.
Address correspondence to:
Professor Stavros Petrou, Division of Health Sciences, Warwick Medical School,
Gibbet Hill Road, University of Warwick, Coventry CV4 7AL, UK.
Email: s.petrou@warwick.ac.uk
Telephone: +44(0) 2476 151124.
2
ABSTRACT
Background: A common feature of most reviews or catalogues of health utilities has been their focus on adult health states or derivation of values from adult populations. More generally, utility measurement in or on behalf of children has been constrained by a number of methodological concerns. The objective of this study was to conduct the first comprehensive systematic review and meta-analysis of primary utility data for childhood conditions and descriptors and to determine the effects of methodological factors on childhood utilities.
Methods: The review followed PRISMA guidelines. PubMed, Embase, Web of Science, PsycINFO, EconLit, CINAHL and Cochrane Library were searched for primary studies reporting health utilities for childhood conditions or descriptors using direct or indirect valuation methods. The Pediatric Economic Database Evaluation (PEDE) was also searched for cost-utility analyses with primary utility values. Mean or median utilities for each of the main samples were catalogued, whilst weighted averages of utilities for each health condition were estimated, by valuation method. Mixed-effects meta-regression using hierarchical linear modelling was conducted for the most common valuation methods to estimate the utility decrement for each health condition category relative to general childhood population health, as well as the independent effects of methodological factors.
3 Conclusion: Utilities and their associated distributions, as well as the independent contributions of methodological factors, revealed by this systematic review and meta-analysis can inform future economic evaluations within the childhood context.
4
INTRODUCTION
Economic evaluation involves the comparative analysis of alternative programmes or interventions in terms of their costs and consequences.1 It has increasingly been used to inform health care decision-making in the United Kingdom by bodies such as the National Institute for Health and Clinical Excellence (NICE) in England and Wales and the Scottish Medicines Consortium (SMC) for Scotland.2,3 Similarly, economic evaluation has increasingly been used to inform the health care decision-making processes of government agencies in other nations.4,5 The preferred measure of health outcome for many government agencies tasked with setting health priorities under conditions of finite resources remains the quality-adjusted life year (QALY), a preference-based measure of health outcome that combines length of life and health-related quality of life (HRQoL) in a single metric.6 For government agencies, the QALY has the advantage of allowing cost-effectiveness comparisons to be made across different health care interventions for disparate health conditions. For economists, it offers an additional advantage in that the techniques used to derive the QALY reflect, to varying degrees, people’s preferences for health outcomes, thereby moving beyond the narrow biomedical model towards an extra-welfarist approach that informs allocative decision-making.1
5 health utilities evidence in accordance with the general principles of evidence-based medicine; and (iii) use methods that are justifiable and reproducible.15
A number of structured or systematic reviews of health utility values have been reported in the literature, the results of which have acted as data inputs into economic evaluations. Tengs and Wallace16 identified 1,000 original health utility values in 154 studies. Bell and colleagues17 conducted a systematic review of cost-utility analyses published between 1976 and 1997 and identified 949 health utility values in 228 studies. More recently, systematic reviews of health utilities have been reported for a number of specific clinical conditions, including but not limited to liver disease,18 neuropathic pain,19 Alzheimer’s disease,20 unipolar depression,21 colorectal cancer,22 HIV/AIDS,23 breast cancer,24 type II diabetes,25 surgical site infection,26 and Crohn’s disease and ulcerative colitis.27
6 from published cost-utility analyses, thus representing only one source of childhood utilities measured by primary studies.
Faced therefore with a paucity of reliable primary utility data for childhood health states and associated descriptors, analysts conducting cost-effectiveness modelling studies in child health have commonly applied health utility values derived for adults to childhood health states.37 The concern is that analysts are overlooking a range of methodological concerns that are likely to reduce the suitability of adult-centred or adult-derived values for childhood health states. These include the relevant attributes to incorporate into measurement instruments, appropriate respondents for measurement exercises, potential sources of bias in the description and valuation processes, and the psychometric properties of existing measures.38 These limitations have been mitigated to a degree by the development of childhood- and adolescent-specific multi-attribute health classification systems generating preference-based scores, such as the EQ-5D-Y (Youth),39 16-Dimensional Health-Related Measure (16D),40 17-Dimensional Health-Related Measure (17D),41 AQoL-6D42 and Child Health Utility 9-Dimensions (CHU9D),43 recently reviewed by Chen and Ratcliffe.44 Nevertheless, variation between measures in choice of attributes and their conceptual underpinnings, valuation protocol, choice of informant, appropriateness for each developmental stage, and formatting, is likely to independently impact on health utility values. To generate reliable results from paediatric cost-utility analyses that can inform health care decision making, it is important that analyses apply valid health utility estimates after accounting for influences of these methodological factors. In this paper, we report the results of the first comprehensive systematic review of health utility values for childhood conditions and broader descriptors. The paper also reports meta-regressions that determine the effects of a range of methodological factors on these health utility values. It is anticipated that the results of this systematic review and meta-regressions will act as a significant new resource for analysts conducting paediatric cost-utility analyses.
METHODS
Systematic Review
7 for brevity), and was therefore not pursued. The following databases were searched: PubMed, Embase of OVID Medline, Web of Science, PsycINFO, Cochrane Library, CINAHL and EconLit. Searches of titles and abstract were applied to articles published online before 31st December 2015. Non-English language articles were excluded. A search of the PEDE database was also conducted to identify cost-utility analyses published between 1980 and 2015 reporting health utilities for childhood conditions or broader descriptors.
The main inclusion criteria for the search strategy were primary studies reporting health utilities for childhood populations or for childhood conditions or descriptors using direct or indirect valuation methods. Duplicates of identified articles were removed using EndNote version 7.7. Previous related literature reviews28-30,46-48 were excluded, but used for manual reference searching. Titles and abstracts were assessed at the first stage of the review by two independent reviewers (JK and SWK). If an article received two approvals, it proceeded to the next stage, with disagreements referred to a third reviewer (SP) for the final assessment. The same reviewers searched full-text articles at the second stage of the review with disagreements again referred to the third reviewer for final assessments. We excluded studies at the full article stage that were: (1) not published in the English language; (2) decision-analytic modelling based economic evaluations that relied purely on secondary data; (3) studies that reported only single-attribute scores for indirect utility instruments; or (4) studies where the main samples had a mean or median target age exceeding 18 years. Conference abstracts were included if they reported original health utility values. Similarly, studies reporting primary VAS scores were included despite disagreement amongst many health economists about their theoretical basis for QALY construction.49
Data Extraction
8 (cross-sectional study, clinical trial, prospective observational, internet survey, other); (13) response quality (response rate, information on dropouts, reasons for loss to follow-up, etc.); (14) statistical method for analysing utilities; and (15) any reported methodological concerns. A point was given to the reporting of each of these characteristics, and the total points were interpreted as the overall reporting quality score. All data were entered into an Excel database. After completing the database, a subset including only data for the main study samples within each article was created. This subset excluded data for any potentially overlapping sub-samples based on sociodemographic characteristics, for example, gender or age. If an article reported utility or VAS scores for a health condition or descriptor using two or more valuation methods or two or more respondent types, each set of utility values was treated as a separate main sample. For randomised controlled trials or prospective observational intervention studies, only pre-treatment values were treated as main samples. This was to reduce a further layer of confounding introduced by intervention effects. Finally, only samples reporting mean or median utility or VAS scores associated with an identifiable health condition or descriptor were included as main samples. This meant exclusion of samples reporting only mean change in utility or VAS score or regression coefficients.
An International Classification of Diseases 10th revision (ICD-10) code was allocated to each sample within the database. Where data permitted, health conditions were characterised by (i) ICD-10 chapter; (ii) ICD-10 sub-chapter encompassing a range of ICD-10 codes; and (iii) specific ICD-10 codes. Any health condition with three or more main study samples reporting mean utility or VAS scores (i.e. excluding median utility or VAS scores) was treated as a unique health condition category within an ICD-10 chapter. If a health condition contained two or less main study samples, it was grouped with other health conditions at the more aggregate level of the ICD-10 sub-chapter. The categorisation of childhood health states was subsumed into the above process.
Statistical Analysis
Two broad statistical analysis approaches were followed. For both approaches, only the main samples reporting mean utility or VAS scores were used (for completeness descriptive statistics
for sub-samples are reported in the online Excel database at
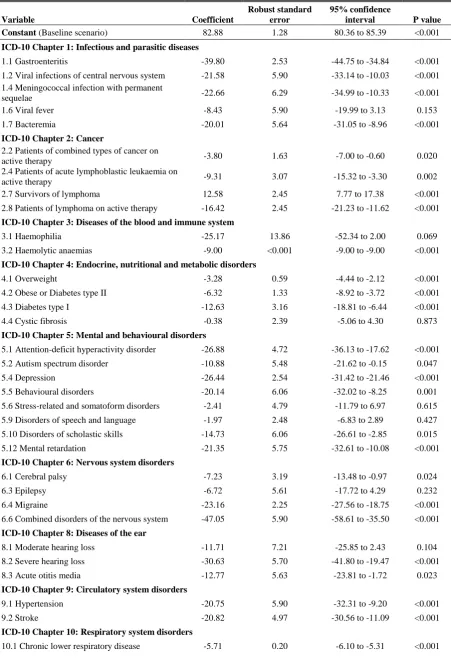
9 The second analytical approach used a hierarchical linear model (HLM) in a linear mixed-effects meta-regression.22-24 The aim was to estimate the utility or VAS score decrement of each health condition category relative to general population health, after controlling for methodological factors and study-specific random effects not accounted for by the explanatory variables. HLM introduces three levels of random variation. First, the variation of the observed mean utility or VAS score around the true mean value; second, the within-study variation in true mean value after controlling for explanatory variables; and, third, the between-study variation in true mean utility or VAS score after controlling for explanatory variables. Hence, the model allows for both within-study clustering and between-study variation in utility or VAS score.23 Analyses were restricted to main samples using the two most common valuation methods within the dataset, namely the Health Utilities Index Mark 3 (HUI3) and VAS variants (including standard VAS, EQ-5D VAS and EQ-5D-Y VAS). The rationale is that we expected valuation method to exert an independent effect on utility or VAS score, and that this effect might vary across health conditions.51 Hence, each analysis was restricted to samples covering all health conditions, but using a single valuation method. Mean utility or VAS scores were weighted by the inverse of their standard error, whilst individual studies were weighted by the total number of their respondents. Health condition categories, respondent types and modes of administration entered both HUI3 and VAS models as indicator variables. Both models also included a dummy variable for samples valuing hypothetical health states, a dummy variable for samples with minimum age greater than 12 years, and a dummy variable for samples from developing countries. All statistical analyses were conducted using STATA software, version 14 (Stata-Corp, College Station, Texas, USA).
RESULTS
Systematic Review
10 studies of health utilities for childhood conditions or descriptors. Appendix A summarises each of the 272 studies included in the systematic review by health condition, healthcare intervention where relevant, country of origin, country of tariff population, valuation method, respondent type, mode of administration, and age of target population. Appendix B provides the full
references for each of these studies. The Excel database at
http://childhoodutilities.wordpress.com summarises the characteristics of these studies with explanatory notes for navigation.
Health Conditions by ICD-10 Chapter
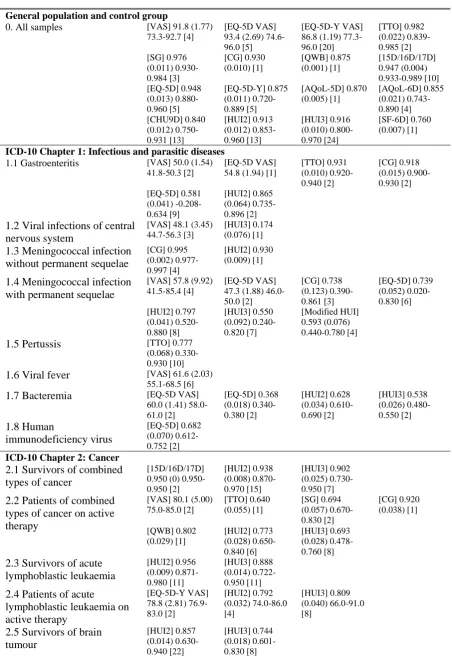
Table 1 summarises the results of the systematic review by ICD-10 chapters and health condition categories. Numbers of samples in each category are provided in the final column, whilst numbers of main samples reporting mean utility or VAS scores are provided in the parentheses in the same column. Health conditions with two or less main samples were grouped with other conditions within the same ICD-10 sub-chapter. For example, sickle cell disease (ICD-10 code 3-D57), favism (3-D55) and thalassemia (3-D56) were grouped in category 3.2 representing ICD-10 sub-chapter for haemolytic anaemias (3-D55-D59) since each contained two or less main samples reporting mean values, and they were all characterised by the same ICD-10 sub-chapter. When conditions with two or less main samples were grouped together despite having ICD-10 codes that crossed ICD-10 sub-chapters, the resulting category was classified as “other type”, as in categories 2.12, 4.8, 5.8, 7.2, 11.4, 14.4, 17.3 and 19.3. Exceptions to these grouping rules were categories 1.8, 1.9, 2.6, 3.3, 11.2, 11.3, 12.2, 12.3, 16.4, 21.2 and 21.3, where these conditions were deemed to be too dissimilar to be grouped together with another condition within the ICD-10 chapter. They are hence presented as unique categories despite having two or less main samples. Where health condition categories have been classified as “combined” (e.g. categories 2.1, 2.2, 19.1, 22), each sample contains patients
of diverse health states. The Excel database should be referred to for information on each sample.
The largest number of samples are contained in category 0 representing general population health. This category contains samples of children and/or adolescents drawn from the general community or schools or control groups of healthy children within observational studies. Category 21 classifies samples by healthcare intervention rather than disease type. These samples are drawn from studies delineated by interventions or programmes and health condition is not specified.
11 only main sample reporting mean values were considered. Inclusion of only mean values in the meta-regressions meant that some health condition categories were excluded, e.g., categories 1.9 for chickenpox and 11.5 for celiac disease.
Disentangling potential intervention effects when selecting main samples was an imperfect process. For example, low birthweight or preterm children had often received paediatric intensive care, and hence main sample utility or VAS scores in categories 16.1, 16.2 and 16.3 may have captured past intervention effects. Similarly, main sample utility or VAS scores in categories 9.3 and 14.1 may have captured the effects of organ transplants many years before the conduct of the observational studies.
Study Characteristics
Table 2 summarises the samples included in the analyses by valuation method, respondent type, mode of administration, minimum age of children in sample, and country of origin. The most commonly used direct valuation method was VAS (including standard VAS, EQ-5D VAS and EQ-5D-Y VAS), which was applied in 601 samples (247 main samples reporting mean or median utility or VAS scores). The most commonly used indirect valuation method was the HUI3.
Samples using the 15D, 16D or 17D were grouped together, even though each instrument is targeted at different age groups. One study used a 10-dimension variant of the HUI,52 whilst another assumed the value 0 indicated the worst imaginable health state rather than death for the HUI3.53 Samples from both studies were classified under a “Modified HUI” valuation method. The review included only one preference-based condition-specific instrument, the Pediatric Asthma Health Outcome Measure (PAHOM), developed by Chiou and colleagues.54 Three studies mapped clinical measures for depression onto utility indices.55-57 Their samples were classified under the “Utility from non-preference-based measure (NPB)” category. The respondent type with the largest number of main samples was proxy assessment by parents (n=408), followed by self-assessment by children and/or adolescents (n=349). In 151 main samples, parents or caregivers valued the health states together with children. Types of proxy respondents varied widely, and included parents, caregivers, healthcare practitioners, the general public, and adult patients with the same disease.
12 Over one half of all samples (n=1,856) valued health states for children under 12 years. 1,307 (70%) of these samples used a form of proxy-assessment. Similarly, 146 of 220 (66%) samples that contained infants (minimum age of 0) valued hypothetical health states using proxy-assessment. A significant number of samples (n=508) did not specify the target age. The largest number of samples was surveyed in Canada, followed by the US and the UK. There were 3,153 samples from developed countries and just 255 from developing countries. Appendix A also specifies the country from which the utility tariff was derived when the study applied one or more indirect valuation method.
Utility Catalogue
Appendix C lists the main sample mean or median utility or VAS scores, and their associated distributions, for the 1,191 main samples by their ICD-10 chapter, health condition, valuation method, respondent type and sample size. Information on populations from which the indirect valuation methods’ tariffs were derived is provided at the bottom of the table. Appendix D
provides the references for these tariffs. Weighted Average Values
Table 3 outlines the results for the first part of the statistical analyses where weighted averages of main sample mean utility or VAS scores were calculated for each health condition category, by valuation method. Median utility or VAS scores were excluded from the analyses. The standard errors are reported in parentheses, whilst the ranges indicate the minimum and the maximum mean utility or VAS scores where applicable. The numbers of mean utility or VAS scores included in each analysis are presented in the second set of square brackets.
Meta-Regressions
13 health condition with the greatest utility decrement (excluding category 22 for combined chronic diseases) was category 21.3 for patients receiving palliative care (implied utility score of 0.017), followed by category 6.5 hydrocephalus (0.247) and category 17.4 congenital malformations of the nervous system (0.254). All categories containing cancer survivors (categories 2.1, 2.3, 2.7, 2.9, 2.10, 2.11 and 2.12) were associated with statistically significant utility increments relative to baseline, with the exception of brain tumour survivors (category 2.5), which showed a statistically significant HUI3 decrement of 0.074 (P<0.001). Survivors of successful kidney transplant (category 14.1) were also associated with a statistically significant HRQoL improvement relative to baseline (HUI3 utility score increment of 0.111; P=0.016). Laryngotracheal stenosis (category 10.3) and congenital diaphragmatic hernia
(category 11.2) were the only other conditions which were associated with a statistically significant HUI3 increment. Overall, at the 5% significance level, 53 of 76 ICD-10 delineated health conditions were associated with statistically significant HUI3 decrements.
14 musculoskeletal disorders (13.4), imperforate anus (17.5) and survivors of other types of injuries (19.3) were associated with VAS increments which were not statistically significant at the 5% significance level. All other categories were associated with VAS decrements relative to the baseline scenario. At the 5% significance level, 38 of 57 ICD-10 delineated health conditions were associated with statistically significant VAS decrements.
Unlike the meta-regression for the HUI3, valuation of hypothetical health states was associated with a significant decrement in VAS score of 20.51 (P<0.001). Moreover, respondent type and mode of administration also exerted different influences on health outcome relative to the HUI3-based analysis. Assessment by children/adolescents together with parents or caregivers, and proxy-assessment by caregivers, were no longer associated with statistically significant underestimation of HRQoL. However, proxy-assessment by parents led to a statistically significant overestimation of HRQoL (VAS increment of 7.43; P=0.005), which was similar in relative magnitude and statistical significance to that revealed by the HUI3 analysis. Unlike for the HUI3, proxy-assessment by physicians or by the composite grouping of the general public, parents within the general public or adult patients resulted in a significant overestimation of the VAS score (for physicians: increment of 13.17; P<0.001; for composite group: 7.02; P=0.008). Furthermore, unlike for the HUI3, self-administered postal surveys were associated with an overestimation of VAS score relative to self-administration in health or school settings (increment of 4.63; P=0.058). Similarly, face-to-face interviews were associated with an overestimation of VAS score (increment of 5.99; P=0.011). As with the HUI3-based analyses, adolescents reported poorer HRQoL (VAS decrement of 5.45; P=0.026) relative to children under the age of 12. Similarly, children from developing countries reported poorer HRQoL (VAS decrement of 0.49), ceteris paribus, but this decrement was again not statistically significant.
DISCUSSION
15 grouped by ICD-10 codes. In comparison, Petrou and Kupek31 covered 43 health conditions described by 2,236 parents of disabled children in the UK and valued solely using the HUI3; Carroll and Downs32 covered 27 hypothetical health conditions valued by 4,016 parents from the general US public; and Mittmann and colleagues33 covered 19 health conditions experienced by 404 Canadian adolescents and valued solely using the HUI3. Moreover, this study is unique in detailing the characteristics of each of the included studies. The final catalogue of 1,191 mean or median utility or VAS scores corresponds in size to the largest published utility catalogues for adult populations, such as Tengs and Wallace’s16 catalogue of
1,000 utility values. Furthermore, it is the only study that has applied a fixed-effects meta-analysis and mixed-effects meta-regression to health utilities in childhood populations. The primary analytical approach, namely hierarchical linear modelling, has to date only been applied in adult populations and for specific health conditions, such as colorectal cancers,22 HIV/AIDS23 and breast cancer.24 The studies by Tengs and Lin23 and Peasgood and colleagues24 similarly found that different respondent types exert independent effects on health utilities. These studies also share various limitations inherent in previous syntheses of utility values, such as unclear presentation of study characteristics (e.g. mode of administration) by primary sources,22 small data sets that restrict analyses of interaction effects between explanatory variables,23 the use of main study samples only that exclude some sociodemographic (e.g. gender) or clinical factors (e.g. symptom type and severity) as covariables,22,24 and the use of published material only.24
16 16.2), for example. It should be noted that the mixed effects meta-regression models test multiple hypotheses simultaneously, and caution is therefore required when drawing conclusions based on the P-values. Applying the Bonferroni correction to P-values would mean that only variables with P-values less than 0.00056 (0.05/89) for the HUI3 and 0.00071 (0.05/70) for the VAS can be interpreted as reflecting significant effects.65 If a P-value less than 0.001 is adopted as the significance level, 50 out of 76 health condition categories for the HUI3 and 30 out of 57 for the VAS still exerted a significant impact on values relative to general population health. This suggests that the significant effects exerted by health conditions were not spurious results.
A number of methodological factors, including respondent type and mode of administration, were shown to have independent effects on both HUI3 and VAS scores after controlling for childhood health conditions. Of particular note was the finding that proxy assessment by parents is associated with an over-estimation of children’s HRQoL outcomes, compared to those reported directly by children for both methods, although a more mixed pattern of results was found when other types of proxies were considered. Previous studies had found that parental-assessed VAS scores are poorly correlated with those provided by children with chronic arthritis;66 that proxy-assessed HUI3 scores provided by caregivers are only moderately correlated with self-assessed scores provided by children with severe infections;67 and that proxy-assessed HUI3 scores provided by parents are significantly higher than those provided directly by very-low birthweight adolescents.68 A potential explanation for higher parental-proxy values may be that parents underestimate problems in less observable aspects of health such as emotional and social wellbeing. which may be acute in childhood.68,69 Furthermore, previous evidence revealed variation in the reporting of children’s HRQoL outcomes by
17 various respondent types and modes of administration that can be generalised across all age groups and health conditions.
There are several caveats to the study results, which should be borne in mind by readers. First, our literature searches were limited to articles published online before 31st December 2015. Nevertheless, we are not aware of any more recent evidence that would have a qualitative impact on our study results. Second, although our search strategies were extensively piloted to maximise sensitivity, some eligible articles may have been missed. Third, information on the samples included in our analyses was extracted from published material. Several studies did not report important data relating to population characteristics, such as comorbidities, which would have entered our meta-regressions had they been available. Fourth, our selection of valuation methods was broad and encompassed methods, such as VAS variants, which arguably lack a theoretical basis for inclusion within cost-utility analysis.49 Nevertheless, our approach is in keeping with previous systematic reviews of health utilities and permits the reader to select relevant values for their particular analysis.16,17
sub-18 chapters. More importantly, we were unable to estimate potential interactions between health conditions and methodological factors. It is possible, for example, that proxy-assessed values are more likely to be reported when respondents are younger, or have greater disease severity. This is a potential source of bias in our estimates of the impact of methodological factors on utility or VAS scores.
The number of economic evaluation of healthcare interventions in childhood populations has grown rapidly in recent decades, with cost-utility analysis seeing the fastest growth out of all evaluation techniques since 2009.74 Future economic evaluations should benefit greatly from our catalogue of 1,191 mean or median utility or VAS scores and from our 3,414 sets of statistics in the accompanying Excel database. Moreover, the results of our meta-regressions ensure that the utility decrements associated with health conditions adequately control for a range of confounding factors. However, the valuation method selected for utility inputs is a key methodological variable, and further research based on our database should explore the independent effects of valuation methods (other than the HUI3) on health utilities. A past review by Finnell and colleagues75 concludes that over one third of 39 paediatric cost-utility analyses found in the literature would reverse their result if utilities valued by SG or TTO were used rather than those valued by indirect valuation methods or expert opinion. Further research should also catalogue the effects of specific interventions or health programmes on health utility, as these are important inputs into decision analytic models.
19
ACKNOWLEDGMENTS
We would like to thank Samantha Johnson for her assistance with the development and piloting of the literature search strategies. The Warwick Clinical Trials Unit, University of Warwick, benefited from facilities funded through the Birmingham Science City Translational Medicine Clinical Research and Infrastructure Trials Platform, with support from Advantage West Midlands. The views contained within this paper are those of the authors and not necessarily of the funders.
SUPPLEMENTARY MATERIAL
20
REFERENCES
1. Drummond MF, Sculpher MF, Claxton K, et al. Methods for the Economic Evaluation of Health Care Programmes, 4th edn.: Oxford University Press, 2015.
2. NICE. NICE Guide to the Methods of Technology Appraisal. London, UK: NICE, 2008. 3. Scottish Medicines Consortium (SMC). Guidance to Manufacturers for Completion of
New Product Assessment Form (NPAF). Scotland: SMC, 2007.
4. Pharmaceutical Benefits Advisory Committee (PBAC). Guidelines for the Pharmaceutical Industry on Preparation of Submissions to the Pharmaceutical Benefits Advisory Committee. Australia: PBAC, 2002.
5. Canadian Agency for Drugs and Technologies in Health. Guidelines for the economic evaluation of health technologies: Canada. Ottawa: Canadian Agency for Drugs and Technologies in Health. 2006.
6. Torrance GW, Feeny D. Utilities and quality-adjusted life years. Int J Technol Assess Health Care 1989;5:559-75.
7. Brazier J, Ratcliffe J, Salomon JA, Tsuchiya A. Measuring and Valuing Health Benefits for Economic Evaluation. Oxford, UK: Oxford University Press, 2007.
8. Dolan P, Gudex C, Kind P, Williams A. Valuing health states: a comparison of methods. J Health Econ 1996;15:209-31.
9. Brooks R. EQ-5D, the current state of play. Health Pol 1996;37:53-72.
10. Torrance GW, Furlong W, Feeny D, Boyle M. Multi-attribute preference functions: Health Utilities Index. PharmacoEcon 1995;7(6):503-20.
11. Brazier J, Roberts J, Deverill M. The estimation of a preference-based measure of health from the SF-36. J Health Econ 2002;21(2):271-92.
12. Kaplan RM, Bush JW, Berry CC. Health status: types of validity and the index of well-being. Health Serv Res 1976;11:478-507.
13. Hawthorne G, Richardson J, Osborne R. The Assessment of Quality of Life (AQoL) instrument: a psychometric measure of health-related quality of life. Qual Life Res 1999; 8: 209-24.
14. Brazier JE, Yang Y, Tsuchiya A, Rowen DL. A review of studies mapping (or cross walking) non-preference based measures of health to generic preference-based measures. Eur J Health Econ 2010;11(2):215-25.
15. Weinstein MC, O'Brien B, Hornberger J, Jackson J, Johannesson M, McCabe C, et al. Principles of good practice for decision analytic modeling in health-care evaluation: report of the ISPOR Task Force on Good Research Practices--Modeling Studies. Value Health 2003;6(1):9-17.
16. Tengs TO, Wallace A. One thousand health-related quality-of-life estimates. Med Care 2000;38(6):583–637.
17. Bell CM, Chapman RH, Stone PW, Sandberg EA, Neumann PJ. An off-the-shelf help list: a comprehensive catalog of preference scores from published cost-utility analyses. Med Decis Making 2001;21:288–94.
18. McLernon DJ, Dillon J, Donnan PT. Health-state utilities in liver disease: a systematic review. Med Decis Making 2008;28(4):582-92.
19. Doth AH, Hansson PT, Jensen MP, Taylor RS. The burden of neuropathic pain: a systematic review and meta-analysis of health utilities. Pain 2010;149(2):338-44. 20. Shearer J, Green C, Ritchie CW, Zajicek JP. Health state values for use in the economic
evaluation of treatments for Alzheimer's disease. Drugs Aging 2012;29(1):31-43. 21. Mohiuddin S, Payne K. Utility values for adults with unipolar depression: Systematic
21 22. Djalalov S, Rabeneck L, Tomlinson G, Bremner KE, Hilsden R, Hoch JS. A review and
meta-analysis of colorectal cancer utilities. Med Decis Making 2014;34(6):809-18. 23. Tengs TO, Lin TH. A meta-analysis of utility estimates for HIV/AIDS. Med Decis
Making 2002;22(6):475-81.
24. Peasgood T, Ward SE, Brazier J. Health-state utility values in breast cancer. Expert Rev Pharmacoecon Outcomes Res 2010;10(5):553-66.
25. Beaudet A, Clegg J, Thuresson PO, Lloyd A, McEwan P. Review of utility values for economic modeling in type 2 diabetes. Value Health 2014;17(4):462-70.
26. Gheorghe A, Moran G, Duffy H, Roberts T, Pinkney T, Calvert M. Health utility values associated with surgical site infection: A systematic review. Value Health 2015;18(8):1126-37.
27. Malinowski KP, Kawalec P. Health utility of patients with Crohn's disease and ulcerative colitis: a systematic review and meta-analysis. Expert Rev Pharmacoecon Outcomes Res 2016;16(4):441-53.
28. van Litsenburg RR, Kunst A, Huisman J, Ket JC, Kaspers GJ, Gemke RJ. Health status utilities in pediatrics: a systematic review of acute lymphoblastic leukemia. Med Decis Making 2014;34(1):21-32.
29. Tarride JE, Burke N, Bischof M, Hopkins RB, Goeree L, Campbell K, Xie F, O'Reilly D, Goeree R. A review of health utilities across conditions common in paediatric and adult populations. Health Qual Life Outcomes. 2010;8:12.
30. Thorrington D, Eames K. Measuring health utilities in children and adolescents: a systematic review of the literature. PloS One 2015;10(8):e0135672.
31. Petrou S, Kupek E. Estimating preference-based Health Utilities Index Mark 3 utility scores for childhood conditions in England and Scotland. Med Decis Making 2009;29(3):291-303.
32. Carroll AE, Downs SM. Improving decision analyses: parent preferences (utility values) for pediatric health outcomes. J Pediatr 2009;155(1):21-5, 25 e1-5.
33. Mittmann N, Trakas K, Risebrough N, Liu BA. Utility scores for chronic conditions in a community-dwelling population. Pharmacoeconomics 1999;15(4):369-76.
34. Ungar WJ, Santos MT. The Pediatric Economic Database Evaluation (PEDE) Project: establishing a database to study trends in pediatric economic evaluation. Med Care 2003;41:1142-52.
35. Ungar WJ. The Pediatric Economic Database Evaluation (PEDE) Project. Toronto: The
Hospital for Sick Children. 2016. Available from:
http://pede.ccb.sickkids.ca/pede/index.jsp
36. Kromm SK, Bethell J, Kraglund F, Edwards SA, Laporte A, Coyte PC, Ungar WJ. Characteristics and quality of pediatric cost-utility analyses. Qual Life Res; 2012;21(8):1315-25.
37. Griebsch I, Coast J, Brown J. Quality-adjusted life-years lack quality in pediatric care: a critical review of published cost-utility studies in child health. Pediatrics 2005;115(5):e600–14.
38. Petrou S. Methodological issues raised by preference-based approaches to measuring the health status of children. Health Econ 2003;12(8):697–702.
39. Ravens-Sieberer U, Wille N, Badia X, Bonsel G, Burstrom K, Cavrini G, Devlin N, Egmar AC, Gusi N, Herdman M, Jelsma J, Kind P, Olivares PR, Scalone L, Greiner W. Feasibility, reliability, and validity of the EQ-5D-Y: results from a multinational study. Qual Life Res 2010;19(6):887-97.
22 adolescence: a sixteen-dimensional health-related measure (16D). Qual Life Res 1996;5(2):205-11.
41. Apajasalo M, Rautonen J, Holmberg C, Sinkkonen J, Aalberg V, Pihko H, Silmes MA, Kaitila I, Makela A, Erkkila K, Sintonen H. Quality of life in pre-adolescence: a 17-dimensional health-related measure (17D). Qual Life Res 1996;5(6):532-38.
42. Richardson J, Peacock SJ, Hawthorne G, Iezzi A, et al. Construction of the descriptive system for the assessment of quality of life AQoL-6D utility instrument. Health Qual Life Outcomes. 2012;10:38-46.
43. Stevens KJ. Working with children to develop dimensions for a preference-based, generic, pediatric health-related quality-of-life measure. Qual Health Res 2010;20:340-51.
44. Chen G, Ratcliffe J. A review of the development and application of generic multi-attribute utility instruments for paediatric populations. PharmocoEcon 2015;33(10):1013-28.
45. Moher D, Liberati A, Tetzlaff J, Altman DG, the PRISMA Group. Preferred Reporting Items for Systematic Reviews and Meta-Analyses: the PRISMA statement. BMJ 2009;339:b2535.
46. Pickard AS, Topfer LA, Feeny DH. A structured review of studies on health-related quality of life and economic evaluation in pediatric acute lymphoblastic leukemia. Jour Nat Canc Inst Mono 2004;33:102-25
47. Noyes J, Edwards R. EQ-5D for the assessment of health-related quality of life and resource allocation in children: a systematic methodological review. Value Health 2011;14(8):1519-30.
48. Janssens L, Gorter JW, Ketelaar M, Kramer WLM, Holtslag HR. Health-related quality-of-life measures for long-term follow-up in children after major trauma. Qual Life Res 2008;17:701-13.
49. Parkin D, Devlin N. Is there a case for using visual analogue scale valuations in cost-utility analysis? Health Econ 2006;15(7):653-64.
50. Sutton A, Abrams K, Jones D, et al. Methods for meta-analysis in medical research. John Wiley & Sons 2000.
51. Richardson J, Khan MA, Iezzi A, Maxwell A. Comparing and explaining differences in the magnitude, content, and sensitivity of utilities predicted by the EQ-5D, SF-6D, HUI3, 15D, QWB, and AQoL-8D multiattribute utility instruments. Med Dec Making 2015;35(3):276-91.
52. Juniper EF, Guyatt GH, Feeny DH, Griffith LE, Ferrie PJ. Minimum skills required by children to complete health-related quality of life instruments for asthma: comparison of measurement properties. Eur Respir J 1997;10:2285-94
53. Oostenbrink R, Moll HA, Essink-Bot ML. The EQ-5D and the Health Utilities Index for permanent sequelae after meningitis: a head-to-head comparison. Jour Clin Epid 2002;55:791-99.
54. Chiou C-F, Weaver MR, Bell MA, Lee TA, Krieger JW. Development of the multi-attribute Pediatric Asthma Health Outcome Measure (PAHOM). Int J Qual Health Care 2005;17(1):23-30.
55. Lynch FL, Hornbrook M, Clarke GN, Perrin N, Polen MR, O’Connor E, Dickerson J. Cost-effectiveness of an intervention to prevent depression in at-risk teens. Arch Gen Psychiatry 2005;62:1241-48.
23 57. Domino ME, Foster M, Vitiello B, Kratochvil CJ, Burns BJ, Silva SG, Reinecke MA, March JS. Relative cost-effectiveness of treatments for adolescent depression: 36-week results from the TADS randomised trial. J Am Acad Child Adolesc Psychiatry 2009;48(7):711-20
58. Lee D, Gladwell D, Batty AJ, Brereton N, Tate E. The cost effectiveness of licensed oromucosal midazolam (Buccolam()) for the treatment of children experiencing acute epileptic seizures: an approach when trial evidence is limited. Paediatric Drugs 2013;15(2):151-62
59. Grootendorst P, Feeny D, Furlong W. Health Utilities Index Mark 3 evidence of construct validity for stroke and arthritis in a population health survey. Med Care 2000;38(3):290-99.
60. Feeny D, Furlong W, Torrance GW, Goldsmith CH, Zhu Z, et al. Multiattribute and single‐attribute utility functions for the health utilities index mark 3 system. Med care. 2002;40(2):113-128.
61. Pogany L, Barr RD, Shaw A, Speechley KN, Barrera M, et al. Health status in survivors of cancer in childhood and adolescence. Qual Life Res. 2006;15(1):143-157.
62.Apajasalo M, Sintonen H, Siimes MA, Hovi L, Holmberg C, et al. Health-related quality of life of adults surviving malignancies in childhood. Eur J Cancer 1996;32(8):1354-8. 63. Barr RD, Furlong W, Dawson S, Whitton AC, et al. An assessment of global health status
in survivors of acute lymphoblastic leukemia in childhood. J Pediatr Hematol Oncol. 1993;15(4):284-90.
64. Glaser AW, Furlong W, Walker DA, Fielding K, et al. Applicability of the Health Utilities Index to a population of childhood survivors of central nervous system tumours in the U.K. Eur J Cancer. 1999;35(2):256-61.
65. Bland M. An introduction to medical statistics, 3rd Edition. Oxford University Press, USA, 2000.
66. Brunner HI, Klein-Gitelman MS, Miller MJ, Trombley M, Baldwin N, et al. Health of children with chronic arthritis: relationship of different measures and the quality of parent proxy reporting. Arthritis Rheum. 2004;51(5):763-73.
67. Kulpeng W, Sornsrivichai V, Chongsuvivatwong V, Rattanavipapong W, Leelahavarong P, et al. Variation of health-related quality of life assessed by caregivers and patients affected by severe childhood infections. BMC Pediatr. 2013;13:122-30.
68. Wolke D, Chernova J, Eryigit-Madzwamuse S, Samara M, Zwierzynska K, et al. Self and parent perspectives on health-related quality of life of adolescents born very preterm. J Pediatr. 2013;163(4):1020-6 e2.
69.Eiser C, Morse R. Can parents rate their child’s health-related quality of life? Results of a systematic review. Qual Life Res 2001;10:347-57.
70. Kramer MS, Etezadi-Amoli J, Ciampi A, Tange SM, Drummond KN, et al. Parents' versus physicians' values for clinical outcomes in young febrile children. Pediatrics. 1994;93(5):697-702.
71. Janse AJ, Uiterwaal CSPM, Gemke RJBJ, Kimpen JLL, Sinnema G. A difference in perception of quality of life in chronically ill children was found between parents and pediatricians. J Clin Epidemiol. 2005;58(5):495-502.
72. Saigal S, Stoskopf BL, Feeny D, Furlong W, Burrows E, et al. Differences in preferences for neonatal outcomes among health care professionals, parents, and adolescents. JAMA. 1999;281(21):1991-7.
24 74. Sullivan S, Ungar WJ. Full report: Will the growth spurt continue? Trends in child health
economic evaluation: 1980 to 2013. 2016.
25 Table 1: Number of samples by ICD-10 chapter and health condition category
Health Condition Category Health Condition Sub-Category ICD-10 Code Number of Samples* General population and control group
0. All samples 409 (112)**
ICD-10 Chapter 1: Infectious and parasitic diseases 192 (87)
1.1 Gastroenteritis Rotavirus gastroenteritis 1-A08 27 (12)
Non-rotavirus gastroenteritis 1-A09 22 (6)
1.2 Viral infections of central nervous system
Viral meningitis caused by viral fever
1-A87 3 (3)
Combined sample of central nervous system infection (meningitis, encephalitis)
1-A86-A87 2 (1)
1.3 Meningococcal infection without permanent sequelae
Bacterial meningococcal meningitis 1-A39 13 (5)
1.4 Meningococcal infection with permanent sequelae
Bacterial meningococcal meningitis 1-A39 42 (23)
Meningococcal sepsis 1-A39.2 3 (3)
Severe meningitis (viral or bacterial unspecified)
1-A39 8 (8)
1.5 Pertussis 1-A37 28 (10)
1.6 Viral fever 1-A99 30 (6)
1.7 Bacteremia 1-A49 8 (8)
1.8 Human immunodeficiency virus
1-B20 4 (2)
1.9 Chickenpox 1-B01 2 (0)
ICD-10 Chapter 2: Cancer 432 (150)
2.1 Survivors of combined types of cancer
2 87 (24)
2.2 Patients of combined types of cancer on active therapy
Combined types of cancer 2 60 (19)
Recurrent juvenile-onset respiratory papillomatosis
2-D14.1 2 (2)
2.3 Survivors of acute lymphoblastic leukaemia
2-C91 46 (22)
2.4 Patients of acute
lymphoblastic leukaemia on active therapy
2-C91 39 (14)
2.5 Survivors of brain tumour Combined types of brain tumour 2-C71 105 (29)
Medulloblastoma 2-C71.6 15 (1)
2.6 Patients of brain tumour on active therapy
2-C71 4 (1)
2.7 Survivors of lymphoma Combined types of lymphoma 2-C81-C85 1 (1)
Hodgkin’s disease 2-C81 16 (11)
Non-Hodgkin’s lymphoma 2-C82-C85 4 (2)
2.8 Patients of lymphoma on active therapy
Hodgkin’s disease 2-C81 18 (3)
2.9 Survivors of renal tumour Combined types of renal tumour 2-C64 5 (3)
Wilms’ tumour 2-C64 4 (4)
2.10 Survivors of retinoblastoma
2-C69.2 3 (3)
2.11 Survivors of sympathetic nervous system tumour
Combined types of sympathetic nervous system tumour
2-C74.9 1 (1)
Neuroblastoma 2-C74.9 6 (4)
2.12 Survivors of other types of cancer
26
Bone tumour 2-C41 5 (1)
Hepatic tumour 2-C22.2 3 (1)
Soft tissue sarcoma 2-C49 3 (1)
Carcinoma 2-D00 1 (1)
Teratoma 2-C62.9 2 (0)
ICD-10 Chapter 3: Diseases of the blood and immune system 73 (19)
3.1 Haemophilia 3-D66 63 (14)
3.2 Haemolytic anaemias Sickle cell disease 3-D57 4 (2)
Favism 3-D55 2 (1)
Thalassemia 3-D56 2 (1)
3.3 Combined diseases of the blood
3 2 (1)
ICD-10 Chapter 4: Endocrine, nutritional and metabolic disorders 362 (95)
4.1 Overweight 4-E66 162 (18)
4.2 Obese or Diabetes type II Obese 4-E66 23 (11)
Diabetes type II 4-E11 28 (1)
4.3 Diabetes type I 4-E10 41 (22)
4.4 Cystic fibrosis 4-E84 63 (21)
4.5 Congenital adrenal hyperplasia
4-E25 12 (4)
4.6 Hypophosphatasia 4-E83.3 6 (4)
4.7 Phenylketonuria 4-E70 5 (3)
4.8 Other metabolic disorders Glutaricaciduria type 1 4-E72 3 (2)
Long-chain acyl-CoA dehydrogenase deficiency (LCHADD)
4-E71 5 (2)
Medium-chain acyl-CoA dehydrogenase deficiency (MCADD)
4-E71 5 (2)
Galactosemia 4-E74.2 2 (1)
Mucopolysaccharidosis 4-E76 1 (1)
Mucopolysaccharidosis type II (Hunter Syndrome)
4-E76.1 1 (1)
Hypothyroidism 4-E03 2 (1)
Combined metabolic disorders 4 3 (1)
ICD-10 Chapter 5: Mental and behavioural disorders 537 (142)
5.1 Attention-deficit hyperactivity disorder
5-F90 153 (48)
5.2 Autism spectrum disorder 5-F84 7 (6)
5.3 Pervasive developmental disorders other than autism spectrum disorder
Asperger’s disorder 5-F84.5 2 (2)
Combined pervasive developmental disorders
5-F84 136 (4)
5.4 Depression Depression 5-F32 58 (10)
Major depressive disorder 5-F33 1 (1)
Dysthymic disorder 5-F34 1 (1)
5.5 Behavioural disorders Combined behavioural disorder 5-F91 4 (3)
Tic disorder 5-F95 2 (2)
Movement disorder 5-F98 1 (1)
Enuresis 5-F98 1 (1)
5.6 Stress-related and somatoform disorders
Combined anxiety disorders (onset in childhood and adolescence)
5-F93 18 (4)
Social phobia 5-F93.2 1 (1)
Internalising disorder 5-F93 12 (1)
Specific phobia 5-F40.2 1 (1)
27
Agoraphobia 5-F40 1 (1)
Generalised anxiety disorder 5-F41.1 1 (1)
Obsessive compulsive disorder 5-F42 1 (1)
Post-traumatic stress disorder 5-F43.1 5 (2)
Conversion disorder 5-F44 1 (1)
Hypochondriasis 5-F45.2 1 (1)
Victims of bullying 5 7 (3)
5.7 Personality disorders Borderline personality disorder 5-F60.3 1 (1)
Avoidant personality disorder 5-F60.6 1 (1)
Obsessive-compulsive personality disorder
5-F60.5 1 (1)
Depressive personality disorder 5-F60 1 (1)
Personality disorder, not otherwise specified
5-F60 9 (1)
5.8 Other mental disorders Combined psychiatric disorders (diagnosed by DSM-IV)
5 6 (1)
Combined mental disorders 5 25 (2)
Risk of psychosis 5-F20 6 (2)
5.9 Disorders of speech and language
Receptive language disorder 5-F80.2 2 (2)
Combined speech disorders 5-F80.9 4 (2)
Stuttering 5-F98.5 20 (2)
5.10 Disorders of scholastic skills
Learning disabilities 5-F81 8 (6)
Dyslexia 5-F81 1 (1)
5.11 Cognitive impairment 5-F06 8 (4)
5.12 Mental retardation Mental retardation 5-F72 18 (10)
Motor disorder 5-F82 2 (1)
5.13 Eating disorders 5-F50 3 (3)
5.14 Substance use disorders 5-F10 5 (4)
ICD-10 Chapter 6: Nervous system disorders 96 (45)
6.1 Cerebral palsy 6-G80 31 (9)
6.2 Muscular dystrophy Duchenne muscular dystrophy 6-G71 15 (6)
Muscular dystrophy and Spinal muscular atrophy
6-G71/G12 2 (1)
6.3 Epilepsy 6-G40 27 (15)
6.4 Migraine 6-G43 5 (3)
6.5 Hydrocephalus 6-G91 8 (7)
6.6 Combined disorders of the nervous system
Neurodevelopmental impairment 6-G96 6 (3)
Combined rare disorders of the central nervous system
6-G96 2 (1)
ICD-10 Chapter 7: Diseases of the eye 61 (9)
7.1 Visual disturbances and blindness
7-H54 10 (3)
7.2 Other diseases of the eye Combined diseases of the eye 7 4 (1)
Nystagmus 7-H55 1 (1)
Visual pathway impairment 7-H47 1 (1)
Cataracts 7-H26 1 (1)
Myopia 7-H52.1 44 (2)
ICD-10 Chapter 8: Diseases of the ear 156 (55)
8.1 Moderate hearing loss 8-H90 56 (19)
8.2 Severe hearing loss Severe hearing impairment 8-H90 49 (16)
Deafness 8-H91 4 (2)
8.3 Acute otitis media 8-H66 16 (14)
8.4 Otitis media with effusion 8-H65.9 31 (4)
28
9.1 Hypertension 9-I10 4 (4)
9.2 Stroke 9-I64 5 (5)
9.3 Heart disease Cardiovascular disease 9-I51 3 (2)
Heart failure (awaiting heart transplant)
9-I50 2 (2)
Heart failure (after successful heart transplant)
9-I50 2 (2)
ICD-10 Chapter 10: Respiratory system disorders 175 (59)
10.1 Chronic lower respiratory disease
Asthma 10-J45 127 (25)
Bronchitis and Emphysema 10-J40/J43 1 (1)
10.2 Influenza and pneumonia Pneumonia 10-J12 11 (11)
Influenza A/H1N1 10-J09 1 (0)
10.3 Laryngotracheal stenosis 10-J38.6 9 (7)
10.4 Upper respiratory infections and diseases
Tonsillitis 10-J03 14 (4)
Sinusitis 10-J01 1 (1)
Rhinitis 10-J30 1 (1)
10.5 Combined disorders of respiratory system
Combined lung disease 10-J96 8 (8)
Combined respiratory system disorders
10 2 (1)
ICD-10 Chapter 11: Digestive system disorders 52 (15)
11.1 Noninfective enteritis and colitis
Crohn’s disease and Ulcerative colitis
11-K50-K51 20 (6)
Ulcerative colitis 11-K51 2 (1)
Food hypersensitivity 11-K52.2 1 (1)
11.2 Congenital diaphragmatic hernia
11-K44 2 (2)
11.3 Dental caries 11-K02 10 (1)
11.4 Other disorders of the digestive system
Liver failure (awaiting liver transplant)
11-K72 1 (1)
Combined liver diseases 11-K76 3 (1)
Combined digestive disorders 11 2 (1)
Gastric ulcer 11-K25 1 (1)
11.5 Celiac disease 11-K90 10 (0)
ICD-10 Chapter 12: Diseases of the skin 26 (8)
12.1 Atopic dermatitis 12-L20 16 (5)
12.2 Acne 12-L70 8 (2)
12.3 Combined skin diseases 12 2 (1)
ICD-10 Chapter 13: Musculoskeletal system disorders 63 (21)
13.1 Juvenile idiopathic arthritis
13-M08 15 (6)
13.2 Scoliosis 13-M41 7 (3)
13.3 Hip dysplasia Developmental hip dysplasia 13-M87 1 (1)
Legg-Calve-Perthes disease 13-M91.1 1 (1)
Unilateral slipped capital femoral epiphysis
13-M91.1 2 (2)
13.4 Combined
musculoskeletal disorders
Combined disorders 13 32 (7)
Back pain 13-M54 1 (1)
ICD-10 Chapter 14: Genitourinary system disorders 55 (35)
14.1 Kidney failure (after successful kidney transplant)
14-N17 8 (6)
14.2 Kidney disease (before kidney transplant or after failed transplant)
29
14.3 Inflammatory and non-inflammatory disorders of female pelvic organs
Pelvic inflammatory disease 14-N73 20 (16)
Endometriosis 14-N80 4 (2)
14.4 Other urogenital disorders Combined urogenital disorders 14 2 (1)
Urinary tract infection 14-N39 3 (3)
Urinary incontinence 14-N39.3 1 (1)
ICD-10 Chapter 16: Conditions originating in the perinatal period 201 (93)
16.1 ELBW/EPT without major comorbidity
16-P07 101 (48)
16.2 ELBW/EPT with major comorbidity
16-P07 69 (36)
16.3 VLBW/VPT 16-P07.1 22 (7)
16.4 Foetal alcohol spectrum disorder
16-P04.3 9 (2)
ICD-10 Chapter 17: Congenital malformations 85 (40)
17.1 Spina bifida 17-Q05 30 (9)
17.2 Craniosynostosis Apert syndrome 17-Q87 2 (2)
Crouzon syndrome 17-Q75.1 2 (2)
Muenke syndrome 17-Q75 2 (2)
Saethre-Chotzen syndrome 17-Q75 2 (2)
Combined craniosynostosis 17-Q75 4 (2)
17.3 Other congenital limb, bone and facial deformities
Combined skeletal dysplasia 17-Q77 4 (2)
Achondroplasia 17-Q77.4 1 (1)
Congenital scoliosis 17-Q76.3 3 (1)
Combined bone deformities 17-Q77 2 (1)
Osteogenesis imperfecta and other bone deformities
17-Q78 2 (1)
Congenital skeletal and facial conditions
17-Q79 2 (1)
Congenital conditions of the connective tissue
17-Q68 2 (1)
Arthrogryposis multiple congenital 17-Q74.3 1 (1) Combined lower limb deformities 17-Q72.9 1 (1) 17.4 Congenital malformations
of the nervous system
Microcephaly 17-Q02 2 (1)
Chiari type I malformation 17-Q07 4 (1)
17.5 Imperforate anus 17-Q42.3 8 (3)
17.6 Chromosomal abnormalities
Fragile X syndrome 17-Q99.2 3 (2)
Down syndrome 17-Q90 2 (1)
Williams syndrome 17-Q93.8 2 (1)
Combined syndromes 17-Q99 4 (2)
ICD-10 Chapter 19: Injury, poisoning and other consequences of external causes 295 (36)
19.1 Survivors of combined types of injuries
19 148 (18)
19.2 Survivors of head and facial injuries
Combined head injuries 19-S00-S09 98 (4)
Facial injury 19-S04.5 4 (1)
19.3 Survivors of other types of injuries
Burns 19-T20-T32 7 (2)
Upper extremity fractures 19-S60-S69 4 (1)
Lower extremity fractures 19-S80-S89 4 (1)
Extremity dislocation 19 4 (1)
Internal organ injury 19-T06.5 4 (1)
Lead poisoning 19-T56 1 (1)
19.4 Allergy Food allergy 19-T78 8 (2)
Combined types of allergy 19-T78.4 13 (4)
30
21.1 Survivors of paediatric intensive care for unspecified reasons
21 43 (7)
21.2 Unspecified organ failure awaiting transplant
21 7 (2)
21.3 Palliative care 21 2 (2)
Combined chronic diseases
22. Combined types of chronic diseases
76 (26)
Total: 3,414 (1,073)
31 Table 2: Characteristics of all samples (main samples) by valuation method, respondent type, mode of administration, age of children and country of origin
Number of samples (main samples) by valuation method
Direct valuation methods
VAS: 212 (118) EQ-5D VAS: 231 (71) EQ-5D-Y VAS: 158 (58) TTO: 137 (57) SG: 221 (100) Chained Gamble: 143 (38)
Indirect valuation methods
QWB: 218 (15) 15D/16D/17D: 114 (52) EQ-5D: 342 (124) EQ-5D-Y: 68 (9) AQoL-5D: 16 (4) AQoL-6D: 41 (7) CHU9D: 188 (22) HUI2: 460 (195) HUI3: 768 (300) Modified HUI: 8 (5) SF-6D: 13 (7) PAHOM: 69 (5) Utility from
NPB: 7 (4)
Number of samples (main samples) by respondent type
Self-assessment by children and/or adolescents: 1,181 (349)
Assessment by children/adolescents and parents: 332 (112)
Assessment by children/adolescents and caregivers: 63 (39)
Proxy assessment by parents: 997 (408)
Proxy assessment by caregivers: 429 (110)
Proxy assessment by physicians: 196 (100)
Proxy assessment by physicians and caregivers: 29 (1)
Proxy assessment by nurses: 76 (26) Proxy assessment by the general public: 20 (10)
Proxy assessment by parents from the general public: 77 (35)
Proxy assessment by adult patients: 7 (1)
Proxy assessment by parents, adult patients and the general public: 7 (0)
Number of samples (main samples) by mode of administration
Self-administration by respondents
Non-postal survey: 944 (297) Postal survey: 762 (239) Online survey: 255 (51) Delphi process: 5 (1)
Interview-administration
Face-to-face interview: 1,166 (523) Telephone interview: 232 (51) Face-to-face or telephone: 15 (5)
Mode of administration not specified:
35 (24)
Number of samples (main samples) by minimum age of children
Minimum age of 0: 220 (96) Minimum age of 2: 246 (37) Minimum age of 5: 515 (161) Minimum age of 8: 875 (258) Minimum age of 12: 693 (305) Minimum age of 15: 349 (137) Minimum age of 18: 9 (6) Age unspecified: 508 (191)
Number of samples (main samples) by country
32 Table 3: Weighted averages of mean utility or VAS scores for each health condition category, by valuation method
General population and control group
0. All samples [VAS] 91.8 (1.77)
73.3-92.7 [4]
[EQ-5D VAS] 93.4 (2.69) 74.6-96.0 [5]
[EQ-5D-Y VAS] 86.8 (1.19) 77.3-96.0 [20] [TTO] 0.982 (0.022) 0.839-0.985 [2] [SG] 0.976 (0.011) 0.930-0.984 [3] [CG] 0.930 (0.010) [1] [QWB] 0.875 (0.001) [1] [15D/16D/17D] 0.947 (0.004) 0.933-0.989 [10] [EQ-5D] 0.948 (0.013) 0.880-0.960 [5] [EQ-5D-Y] 0.875 (0.011) 0.720-0.889 [5] [AQoL-5D] 0.870 (0.005) [1] [AQoL-6D] 0.855 (0.021) 0.743-0.890 [4] [CHU9D] 0.840 (0.012) 0.750-0.931 [13] [HUI2] 0.913 (0.012) 0.853-0.960 [13] [HUI3] 0.916 (0.010) 0.800-0.970 [24] [SF-6D] 0.760 (0.007) [1]
ICD-10 Chapter 1: Infectious and parasitic diseases
1.1 Gastroenteritis [VAS] 50.0 (1.54) 41.8-50.3 [2]
[EQ-5D VAS] 54.8 (1.94) [1]
[TTO] 0.931 (0.010) 0.920-0.940 [2] [CG] 0.918 (0.015) 0.900-0.930 [2] [EQ-5D] 0.581 (0.041) -0.208-0.634 [9] [HUI2] 0.865 (0.064) 0.735-0.896 [2]
1.2 Viral infections of central nervous system
[VAS] 48.1 (3.45) 44.7-56.3 [3]
[HUI3] 0.174 (0.076) [1]
1.3 Meningococcal infection without permanent sequelae
[CG] 0.995 (0.002) 0.977-0.997 [4]
[HUI2] 0.930 (0.009) [1]
1.4 Meningococcal infection with permanent sequelae
[VAS] 57.8 (9.92) 41.5-85.4 [4]
[EQ-5D VAS] 47.3 (1.88) 46.0-50.0 [2] [CG] 0.738 (0.123) 0.390-0.861 [3] [EQ-5D] 0.739 (0.052) 0.020-0.830 [6] [HUI2] 0.797 (0.041) 0.520-0.880 [8] [HUI3] 0.550 (0.092) 0.240-0.820 [7] [Modified HUI] 0.593 (0.076) 0.440-0.780 [4]
1.5 Pertussis [TTO] 0.777
(0.068) 0.330-0.930 [10]
1.6 Viral fever [VAS] 61.6 (2.03)
55.1-68.5 [6]
1.7 Bacteremia [EQ-5D VAS]
60.0 (1.41) 58.0-61.0 [2] [EQ-5D] 0.368 (0.018) 0.340-0.380 [2] [HUI2] 0.628 (0.034) 0.610-0.690 [2] [HUI3] 0.538 (0.026) 0.480-0.550 [2] 1.8 Human immunodeficiency virus [EQ-5D] 0.682 (0.070) 0.612-0.752 [2]
ICD-10 Chapter 2: Cancer
2.1 Survivors of combined types of cancer
[15D/16D/17D] 0.950 (0) 0.950-0.950 [2] [HUI2] 0.938 (0.008) 0.870-0.970 [15] [HUI3] 0.902 (0.025) 0.730-0.950 [7]
2.2 Patients of combined types of cancer on active therapy
[VAS] 80.1 (5.00) 75.0-85.0 [2] [TTO] 0.640 (0.055) [1] [SG] 0.694 (0.057) 0.670-0.830 [2] [CG] 0.920 (0.038) [1] [QWB] 0.802 (0.029) [1] [HUI2] 0.773 (0.028) 0.650-0.840 [6] [HUI3] 0.693 (0.028) 0.478-0.760 [8]
2.3 Survivors of acute lymphoblastic leukaemia [HUI2] 0.956 (0.009) 0.871-0.980 [11] [HUI3] 0.888 (0.014) 0.722-0.950 [11]
2.4 Patients of acute
lymphoblastic leukaemia on active therapy
[EQ-5D-Y VAS] 78.8 (2.81) 76.9-83.0 [2] [HUI2] 0.792 (0.032) 74.0-86.0 [4] [HUI3] 0.809 (0.040) 66.0-91.0 [8]
33
2.6 Patients of brain tumour on active therapy
[HUI3] 0.530 (0.067) [1]
2.7 Survivors of lymphoma [EQ-5D VAS] 90.0 (2.40) [1]
[HUI2] 0.873 (0.015) 0.820-0.930 [7] [HUI3] 0.857 (0.018) 0.720-0.940 [6]
2.8 Patients of lymphoma on active therapy
[EQ-5D VAS] 61.0 (2.44) [1]
[HUI2] 0.670 (0.024) [1]
[HUI3] 0.580 (0.024) [1]
2.9 Survivors of renal tumour [HUI2] 0.946 (0.004) 0.930-0.950 [4]
[HUI3] 0.911 (0.014) 0.890-0.930 [3]
2.10 Survivors of retinoblastoma [HUI2] 0.883 (0.067) [1] [HUI3] 0.858 (0.007) 0.830-0.860 [2]
2.11 Survivors of
sympathetic nervous system tumour [HUI2] 0.895 (0.006) 0.880-0.900 [3] [HUI3] 0.878 (0.004) 0.870-0.880 [2]
2.12 Survivors of other types of cancer
[HUI3] 0.833 (0.021) 0.490-0.870 [5]
ICD-10 Chapter 3: Diseases of the blood and immune system
3.1 Haemophilia [VAS] 30.9 (4.33)
23.7-38.7 [3]
[EQ-5D VAS] 89.1 (5.60) 80.7-92.8 [2] [SG] 0.701 (0.072) 0.487-0.915 [6] [EQ-5D] 0.647 (0.208) -0.110-0.780 [3]
3.2 Haemolytic anaemias [EQ-5D VAS] 87.0 (3.60) [1]
[TTO] 0.793 (0.045) [1]
[EQ-5D] 0.905 (0.038) 0.590-0.910 [2]
3.3 Combined diseases of the blood
[HUI3] 0.505 (0.089) [1]
ICD-10 Chapter 4: Endocrine, nutritional and metabolic disorders
4.1 Overweight [EQ-5D VAS]
78.4 (0.464) [1]
[EQ-5D-Y VAS] 78.5 (1.79) 74.6-86.1 [4] [EQ-5D-Y] 0.853 (0.045) 0.670-0.890 [3] [AQoL-6D] 0.852 (0.013) 0.842-0.870 [2] [CHU9D] 0.844 (0.013) 0.810-0.860 [4] [HUI2] 0.841 (0.019) 0.838-0.950 [2] [HUI3] 0.786 (0.001) 0.780-0.786 [2]
4.2 Obese or Diabetes type II [EQ-5D VAS] 73.2 (1.78) 69.1-74.0 [2]
[EQ-5D-Y VAS] 81.9 (4.48) 75.4-88.1 [3] [EQ-5D] 0.790 (0.025) [1] [AQoL-6D] 0.805 (0.011) [1] [CHU9D] 0.828 (0.001) 0.827-0.830 [2] [HUI2] 0.814 (0.009) [1] [HUI3] 0.820 (0.099) 0.759-0.980 [2]
4.3 Diabetes type I [EQ-5D VAS]
80.7 (0.147) 80.5-80.8 [2] [TTO] 0.809 (0.019) 0.530-0.840 [7] [SG] 0.933 (0.020) 0.744-0.965 [6] [EQ-5D] 0.905 (0.015) 0.765-0.920 [4] [HUI3] 0.902 (0.027) 0.572-0.910 [3]
4.4 Cystic fibrosis [VAS] 76.0 (2.48) [1]
[EQ-5D VAS] 77.1 (1.61) [1]
[EQ-5D-Y VAS] 82.2 (2.99) 79.4-85.4 [2] [TTO] 0.959 (0.017) 0.700-0.960 [2] [SG] 0.920 (0.019) [1] [QWB] 0.766 (0.025) 0.611-0.790 [5] [EQ-5D] 0.783 (0.021) [1] [HUI2] 0.830 (0.003) 0.800-0.850 [4] [HUI3] 0.743 (0.009) 0.728-0.770 [4]
4.5 Congenital adrenal hyperplasia
[15D/16D/17D] 0.853 (0.030) 0.780-0.920 [4]
4.6 Hypophosphatasia [EQ-5D] 0.410 (0.258) -0.240-0.860 [4]
4.7 Phenylketonuria [TTO] 0.397
(0.039) [1]
34
4.8 Other metabolic disorders [TTO] 0.472 (0.003) 0.469-0.475 [2] [15D/16D/17D] 0.643 (0.070) 0.490-0.890 [6] [EQ-5D] 0.070 (0.019) [1] [HUI3] 0.504 (0.025) 0.389-0.510 [2]
ICD-10 Chapter 5: Mental and behavioural disorders
5.1 Attention-deficit hyperactivity disorder
[VAS] 48.3 (5.88) 26.1-73.9 [8]
[EQ-5D VAS] 54.8 (7.83) 30.2-72.4 [5] [TTO] 0.833 (0.105) 0.444-0.900 [3] [SG] 0.917 (0.007) 0.880-0.960 [10] [CG] 0.812 (0.038) 0.480-0.920 [11] [EQ-5D] 0.798 (0.012) 0.740-0.810 [4] [HUI2] 0.802 (0.020) 0.792-0.896 [3] [HUI3] 0.664 (0.034) 0.425-0.690 [4]
5.2 Autism spectrum disorder [EQ-5D-Y VAS] 80.7 (0.024) [1]
[QWB] 0.580 (0.015) [1] [HUI2] 0.721 (0.046) [1] [HUI3] 0.629 (0.037) 0.431-0.700 [4]
5.3 Pervasive developmental disorders other than autism spectrum disorder [QWB] 0.595 (0.007) 0.591-0.620 [3] [HUI3] 0.674 (0.041) 0.659-0.790 [2]
5.4 Depression [EQ-5D VAS]
57.0 (2.00) 55.0-59.0 [2] [EQ-5D] 0.892 (0.038) 0.450-0.910 [6] [NPB] 0.570 (0.035) 0.162-0.869 [4]
5.5 Behavioural disorders [EQ-5D-Y VAS] 76.9 (3.49) [1]
[EQ-5D] 0.250 (0.183) [1] [HUI2] 0.802 (0.0003) 0.801-0.802 [2] [HUI3] 0.620 (0.089) 0.463-0.727 [3]
5.6 Stress-related and somatoform disorders
[EQ-5D VAS] 76.2 (1.99) [1]
[EQ-5D] 0.701 (0.056) 0.250-0.830 [10] [AQoL-5D] 0.710 (0.028) [1] [HUI2] 0.760 (0.040) [1] [HUI3] 0.706 (0.012) 0.672-0.710 [2] [SF-6D] 0.708 (0.004) 0.690-0.710 [3]
5.7 Personality disorders [EQ-5D] 0.499 (0.046) 0.340-0.700 [5]
5.8 Other mental disorders [15D/16D/17D] 0.797 (0.002) 0.795-0.799 [2] [CHU9D] 0.778 (0.031) 0.739-0.803 [2] [HUI3] 0.698 (0.039) [1]
5.9 Disorders of speech and language
[EQ-5D VAS] 88.3 (0.969) [1]
[15D/16D/17D] 0.941 (0.007) 0.934-0.948 [2] [HUI3] 0.878 (0.041) 0.438-0.890 [3]
5.10 Disorders of scholastic skills
[VAS] 54.6 (2.92) 51.6-61.5 [3]
[EQ-5D-Y VAS] 79.4 (3.02) [1]
[EQ-5D] 0.770 (0.018) [1]
[HUI3] 0.397 (0.020) 0.376-0.417 [2]
5.11 Cognitive impairment [HUI2] 0.738 (0.049) 0.612-0.757 [2]
[HUI3] 0.592 (0.118) 0.318-0.643 [2]
5.12 Mental retardation [EQ-5D VAS] 56.0 (0.020) 55.0-60.0 [2] [TTO] 0.510 (0.016) [1] [CG] 0.590 (0.013) [1] [EQ-5D] 0.117 (0.101) 0.040-0.250 [2] [HUI2] 0.330 (0.042) 0.300-0.390 [2] [HUI3] 0.146 (0.063) 0.010-0.218 [3]
5.13 Eating disorders [EQ-5D] 0.567 (0.008) 0.560-0.610 [3]
5.14 Substance use disorders [EQ-5D] 0.601 (0.165) 0.470-0.810 [4]
ICD-10 Chapter 6: Nervous system disorders
6.1 Cerebral palsy [EQ-5D-Y VAS]
86.3 (3.47) [1]
[TTO] 0.550 (0.016) [1] [CG] 0.600 (0.014) [1] [EQ-5D] 0.922 (0.068) [1] [AQoL-5D] 0.276 (0.030) [1] [HUI2] 0.125 (0.019) [1] [HUI3] 0.363 (0.045) 0.274-0.420 [3]
6.2 Muscular dystrophy [EQ-5D] 0.198 (0.026) [1]