Dynamic response of land use and river
1nutrient concentration to long-term
2climatic changes
3Gianbattista Bussi1*, Victoria Janes2, Paul G. Whitehead1, Simon J. Dadson1 and Ian P. Holman2. 4
1 – School of Geography and the Environment, University of Oxford, South Parks Road, OX1 3QY, 5
Oxford (UK) 6
2 – Cranfield Water Science Institute, Cranfield University, Cranfield, MK43 0AL, Bedford (UK) 7
*Corresponding author: [email protected] 8
Abstract
9The combined indirect and direct impacts of land use change and climate change on river water 10
quality were assessed. A land use allocation model was used to evaluate the response of the 11
catchment land use to long-term changes in precipitation and temperature. Its results were used to 12
drive a water quality model and assess the impact of the same climatic alterations on freshwater 13
nitrate and phosphorus concentration. A scenario-neutral framework was used to evaluate the system 14
response to changes in annual precipitation and annual temperature, and probabilistic climatic 15
projections were employed to estimate the likelihood of such response. The River Thames catchment 16
(UK) was used as a case-study, given the widespread presence of agriculture and its importance for 17
freshwater supply. If land use is considered as static parameter, according to the model results, 18
climate change alone should reduce the average nitrate concentration, although just by a small 19
amount,by the 2050s in the Lower Thames, due to reduced runoff (and lower export of nitrate from 20
agricultural soils) and increased instream denitrification, and should increase the average phosphorus 21
concentration by 12% by the 2050s in the Lower Thames, due to a reduction of the effluent dilution 22
capacity of the river flow. However, the results of this study also show that these long-term climatic 23
alterations are likely to lead to a reduction in the arable land in the Thames, replaced by improved 24
grassland. This change is mainly driven by a decrease in agriculture profitability in the UK in 25
comparison to other areas of Europe. Taking into account the dynamic co-evolution of land use with 26
climate, the average nitrate concentration is expected to be decreased by around 6% by the 2050s in 27
both the upper and the lower Thames, following the model results, and the average phosphorus 28
concentration incerased by 13% in the upper Thames and 5% in the lower Thames. This study shows 29
the importance of incorporating the indirect impacts of climate change, through considering the 30
response of the whole catchment, into assessments of future water quality. 31
Keywords: water quality, land use change, scenario-neutral, INCA model, River Thames. 32
1
Introduction
properties, it is challenging to predict how it will change in the future subject to stressors such as 41
climate change, technology change and human population increases. Its future evolution is uncertain 42
(Mehdi et al., 2015), as land use and land management are changed to adjust to changes in climate, 43
policy, food demand etc. Natural vegetation also responds dynamically to climatic variations (Ruiz-44
Pérez et al., 2016). These adaptations can have hydrological and ecological effects (Dale, 1997). 45
One example of widespread human-induced land use change is agriculture. Modern agriculture is 46
recognised as one of the most significant non-point sources of water pollution (Johnes, 1996), 47
especially for nutrients like nitrogen and phosphorus (Tong and Chen, 2002). At the global scale, 48
agriculture is the economic sector that is likely to suffer the greatest financial impact as a result of 49
climate change (Lobell et al., 2011). Farmers are expected to adapt to climate change by switching 50
activities to those that are most profitable, given the new conditions they will face (Fezzi et al., 2015). 51
This adaptation is likely to have a strong effect on river water quality (Fezzi et al., 2015), for example 52
by increasing/decreasing nitrogen leaching to the aquifer, or by altering the nutrient export from 53
agricultural soils. 54
Scenarios are commonly used as tools to examine plausible developments of change (Mehdi et al., 55
2015). Nevertheless, scenarios are usually characterised by a high degree of subjectivity and do not 56
describe the response of the land use to climatic changes. An alternative to understand the response 57
of land use to drivers such as climate variability is through the use of spatially-explicit land use 58
allocation models. These models estimate the future evolution of land use/land cover through land 59
use conversion, based on climate, population and peoples’ responses to economic opportunities, as 60
mediated by institutional factors (Lambin, 1997; Lambin et al., 2001). 61
Despite the importance of climatic and socio-economic changes on water resources and water quality 62
management, there is still a strong need for quantitative approaches that can evaluate the impact of 63
these drivers of change and assist catchment and river management, compensating for the lack of 64
objectivity that socioeconomic and emission scenarios holds. Moreover, only a few studies so far 65
have presented integrated assessments of the joint impact of climate and land use change on water 66
quality. Other studies evaluated the impacts of climate change and/or land use change in the Thames 67
catchment or in other catchments in the UK, although none assessed the impact of the dynamic co-68
evolution of land use with long-term climatic changes, to the authors’ knowledge. The findings of this 69
study in terms of phosphorus substantially agree with the ones of Crossman et al. (2013) 70
concentration, who used the same model (INCA – INtegrated CAtchment model) but a different 71
methodology, with a set of static land use scenarios. Bussi et al. (2016b) also provided estimates of 72
the impacts of climate and land use change on total phosphorus concentration using the INCA model 73
and a scenario-neutral methodology (i.e. a methodology that does not use emission scenarios or 74
socio-economic scenarios to drive a hydrological model, but rather makes a sensitivity analysis on the 75
model input), but employing a set of static land use change scenarios that were not linked to 76
agricultural supply and demand. 77
The objectives of this study are: 78
- To develop a methodology for the combined evaluation of direct and indirect impacts of 79
climate change on river water quality, taking into account the response of land use and 80
agriculture to changes in climate. 81
- To understand the relative importance of the direct and indirect impacts of climate change on 82
nitrate and phosphorus concentration in the River Thames 83
A land use allocation model, embedded within an integrated modelling platform, is coupled to a 84
hydrological and water quality model to assess the impact of a changing climate on water quality 85
taking into account the land use/land cover response to changing crop suitability and profitability 86
et al., 2016a, 2016b; Prudhomme et al., 2010), which allows the system response to changes in 88
climate to be assessed without having to rely on specific climate and/or land use scenarios. The water 89
quality model used is the INCA model for nitrogen and phosphorus (Wade et al., 2002a, 2002b, 90
Whitehead et al., 1998a, 1998b). This model is applied to the River Thames catchment (UK). 91
2
Study area
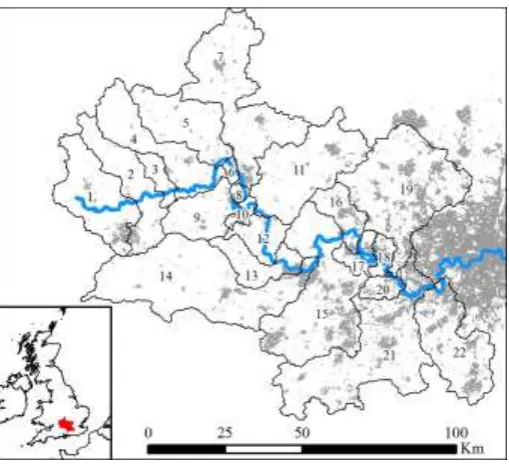
92
This paper focuses on River Thames catchment upstream of London (Figure 1, 9,927 km2), located in 93
southern England and draining toward the city of London. This river provides freshwater supply to 94
fourteen million people (Whitehead et al., 2013), most of whom live downstream within London, and 95
receives treated wastewater from approximately three million people (Kinniburgh and Barnett, 2009). 96
The climate is temperate with Atlantic and continental influences. The average annual precipitation is 97
730 mm (1960-2014, with a minimum of 538 mm in 1973 and a maximum of 974 mm in 2000) and the 98
annual average temperature is 10.7°C (1960-2014, minimum: 8.6°C in 1963, maximum 12.1°C in 99
2014), with a difference of around 1.5-2°C between the interfluve and the valleys. The average 100
summer temperature is 16.5 °C and the average winter temperature is 4.7°C. The average daily flow 101
is 67 m3 s-1 at the catchment outlet in London, with a daily Q5 (discharge exceeded only 5% of the 102
time) of 206 m3 s-1. High flows usually occur in winter to early spring and low flows in summer to late 103
autumn (Bussi et al., 2016a). 104
The catchment geology is dominated by chalk, with limestone in the headwaters, and clay/mudstone 105
and sandstone also present both upstream and downstream of the chalk area (Bloomfield et al., 106
2011). The catchment is dominated by arable land alternated with grassland in its upper part (around 107
80% of the catchment draining to reach 4 in Figure 1 is dedicated to arable agriculture or improved 108
grassland), with little urban land in the headwaters. The urban land portion increases in the Western 109
part of the catchment (up to 30% of the lowermost sub-catchments in Figure 1). Around 13% of the 110
catchment is covered by woodland. 111
[image:3.595.171.426.435.668.2]extension of 6540 km2. The land use is also dominated by agriculture, with a portion of arable land of 121
42% and 28% of improved grassland. Forest land is 11% and urban land is also 11%. The population 122
equivalent of this portion of catchment is slightly less than 3,000,000. 123
Meteorological inputs for the INCA model, namely daily precipitation and temperature time series, 124
were obtained from the UK Met Office (Met Office, 2012). More details can be found in Bussi et al. 125
(2016a). Records of continuous daily water discharge at the several sections of the river were 126
obtained from the National River Flow Archive (NRFA, ceh.ac.uk/data/nrfa/). Weekly nutrient data, in 127
particular nitrate concentration and total phosphorus concentration, were obtained from the Thames 128
Initiative (TI) research platform dataset (Bowes et al., 2012). Intermittent nutrient data, collected with a 129
frequency of around four weeks, were also obtained from the Environment Agency of England and 130
Wales. 131
3
Methodology
132
3.1
Land use allocation model
133
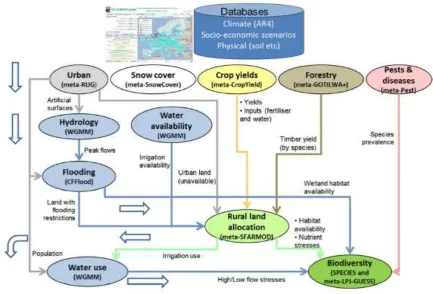
Land use allocation was simulated using the IMPRESSIONS Integrated Assessment Platform (IAP), 134
which is an update of the CLIMSAVE IAP (Harrison et al., 2016, 2015, 2014; Holman et al., 2016). 135
The platform integrates a suite of models to assess the impacts of, and adaptation to, climate and 136
socio-economic change across a range of sectors including urban development, coastal and fluvial 137
flooding, agriculture, forests, water resources and biodiversity (see Figure 2). The computationally 138
efficient models within the IAP (details of which can be found in Holman and Harrison (2011) have 139
been validated and subject to extensive sensitivity (Kebede et al., 2015) and uncertainty (Brown et al., 140
2014; Dunford et al., 2014) analyses. The platform is run across the European Union countries plus 141
Norway and Switzerland on a 10’x10’ grid (approximately 16km x 16km) of over 23,000 gridcells (with 142
each grid cell containing multiple soil types), and over 4 time slices (baseline, 2011-2040, 2041-2070 143
145
Figure 2 –Schematic showing the structure of the linked models within the IMPRESSIONS IAP2. 146
The rural land use allocation metamodel in the IAP (Audsley et al., 2014) is based on the Silsoe 147
Whole Farm Model (SFARMOD-LP - Annetts and Audsley, 2002) a constrained optimising linear 148
programming model of long-term land use. The model spatially allocates land uses (intensive arable, 149
intensive grassland, extensive grassland, managed forest, unmanaged forest and unmanaged land), 150
and associated rainfed and irrigated crops and tree species, based on relative economic profitability 151
and subject to a range of constraints. These include areas subject to urban development, flood risk, 152
environmentally protected areas (such as Natura 2000 sites) and water resource availability. The 153
model works iteratively to find a spatial land use allocation solution that meets demand for the 154
commodities of timber, meat, milk, fibre, protein, roots, oils and cereals across Europe, in response to 155
spatial simulated changes in profitability driven by changing crop yields, fodder production (influencing 156
milk and meat production) and timber yield. Price factors are used to stimulate or reduce production of 157
a given commodity across Europe to meet demand (by making its production more/less economically 158
advantageous). In the context of the current study, land use in the Thames catchment can change as 159
a result of intra- and inter-catchment changes in crop and timber yields and profitability, reflecting the 160
large-scale markets of such commodities where prices and supply are driven by national and 161
international demand. For this study, the baseline socio-economic conditions within the IAP were 162
maintained, so that European food demand (driven by population, GDP and dietary preferences and 163
net imports) and agricultural technology (crop breeding, mechanisation, etc.) remained constant. The 164
simulated baseline land use for the River Thames catchment (i.e., the current land use) is shown in 165
Figure 3 – Simulated percentage land use of the River Thames catchment per sub-catchment under current climate 168
(i.e., no alterations of precipitation and temperature). 169
3.2
Water quality model
170
The INCA hydrological and water quality model was employed to reproduce the water quality 171
dynamics of the River Thames (UK). This model was chosen because it combines the simplicity 172
required to reproduce water quality processes at the catchment scale with the accuracy that is 173
necessary to produce estimates of flow and nutrient concentration. Furthermore, it is a very well-174
known water quality model, used in several catchments in the UK and in the rest of the world since 175
the late 90s, with an extensive body of publications to support it (some of which are detailed below). 176
The INCA model is particularly suitable for the scale of this study, as it was developed as a 177
catchment-scale model, with the possibility of disaggregating the catchment in several sub-178
catchments. Furthermore it offers the possibility of analysing the effect of land use change on water 179
quality, given that different land use units with different characteristics and parameters can be defined 180
within each sub-catchment. 181
The INCA model was initially developed as a nitrogen (Whitehead et al., 1998a) and phosphorus 182
(Wade et al., 2002b) model, although several other sub-models were added later, such as a soil 183
erosion and sediment transport sub-model (Lázár et al., 2010), a faecal indicator model (Whitehead et 184
al., 2016) and an organic contaminant model (Lu et al., 2016). The hydrological and water quality sub-185
models of INCA have been applied to several basins across the UK and Europe, and, in particular, to 186
the River Thames catchment (Bussi et al., 2016b; Crossman et al., 2013b; Jin et al., 2012; Lu et al., 187
2016; Whitehead et al., 2016, 2013). INCA is a semi-distributed process-based model which 188
simulates the transformation of rainfall into runoff and the propagation of water through a river 189
network (Wade et al., 2002a). Its inputs are daily time series of precipitation, temperature, 190
hydrologically effective rainfall, and soil moisture deficit. The latter two are estimated using another 191
semi-distributed hydrological model, called Precipitation, Evapotranspiration and Runoff Simulator for 192
Solute Transport model - PERSiST (Futter et al., 2014), which is specifically designed to provide input 193
series for the INCA family of models. It is based on a user-specified number of linear reservoirs which 194
can be used to represent different hydrological processes, such as snow melt, direct runoff 195
generation, soil storage, aquifer storage and stream network movement. The description of its 196
application to the river Thames can be found in Futter et al. (2014). 197
The nitrogen sub-model of INCA (Wade et al., 2002a; Whitehead et al., 1998a, 1998b) reproduces the 198
cycle of nitrogen from its main sources (atmospheric deposition, fertilisers, wastewater, etc.) to the 199
river. The most important soil processes are included, such as denitrification, nitrification, 200
immobilisation, mineralisation and leaching towards the aquifer. Nitrification and denitrification 201
processes in the streams are also taken into account. The phosphorus sub-model of INCA (Wade et 202
al., 2002b) incorporates the main sources of phosphorus, both diffuse (fertilisers) and point 203
(wastewater), as well as the main processes involving phosphorus, such as sorption/desorption. The 204
phosphorus sub-model of the INCA model also includes a sediment sub-model, which computes the 205
detachment of soil particles from the hillslopes and their transport towards the catchment outlet. The 206
INCA model has already been applied to the River Thames catchment (Crossman et al., 2013b; Jin et 207
used, where the catchment is divided into 22 sub-catchments and the river into 22 corresponding 209
reaches (Figure 1). The land uses of the Thames catchment were categorised as follows: forest 210
(including both managed and unmanaged forest), unfertilised grassland (i.e., extensive grassland), 211
fertilised grassland (i.e., intensive grassland), arable (i.e., intensively farmed land) and urban. The 212
land use configuration used for model calibration was obtained from the IAP model rather than from 213
land use maps to ensure consistency between the baseline and the scenario results. 214
Based on a prior general sensitivity analysis of the INCA model of the River Thames (Spear and 215
Hornberger, 1980; Whitehead et al., 2015) and the modeller’s knowledge, the following 22 parameters 216
were identified as the most influential: 217
- Hydrology (Bussi et al., 2016a; Jackson-Blake and Starrfelt, 2015): rainfall excess proportion 218
(the proportion of excess rain that is converted into direct runoff), soil water and ground water 219
residence times (i.e., flow velocity for sub-superficial flow and base flow), maximum infiltration 220
rate, flow-velocity coefficient (the coefficient of a power law used to calculate channel flow 221
velocity from discharge), flow threshold for saturation excess direct runoff. (, 222
- Nitrogen (Jin et al., 2012; Wade et al., 2002a): soil denitrification coefficient, nitrification, 223
mineralisation and immobilisation rates in the soil, nitrogen uptake rate by crops, groundwater 224
nitrate concentration, instream nitrification rate and instream denitrification rate, 225
- Sediment,( Bussi et al., 2016a; Lázár et al., 2010):,splash and flow erosion parameters 226
(defining the erodibility fo soils), flow erosion direct runoff threshold (defining the threshold 227
above which flow erosion occurs), transport capacity scaling factor (which adjusts the 228
transport capacity on the hillslopes), transport capacity non-linear coefficient (which adjusts 229
the transport capacity on the hillslopes), instream sediment transport parameters (which 230
adjust the transport capacity in the channel) 231
- Phosphorus (Bussi et al., 2016a; Jackson-Blake and Starrfelt, 2015): soil matrix sorption 232
coefficient (which adjusts the sorption capacity of the soils),water column sorption coefficient 233
(which adjusts the sorption capacity of the water column), stream bed sorption coefficient 234
(which adjusts the sorption capacity of the be sediment). 235
More information on INCA model sensitivity analysis and Monte Carlo calibration can be found in 236
Jackson-Blake and Starrfelt (2015) and Bussi et al. (2016a). 237
The feasible ranges of variation of these influential model parameters, informed by previous studies, 238
were sampled randomly, and 10,000 different parameter sets were generated. Subsequently, the 239
INCA model was run with each of these parameter sets, and its performance was assessed based on 240
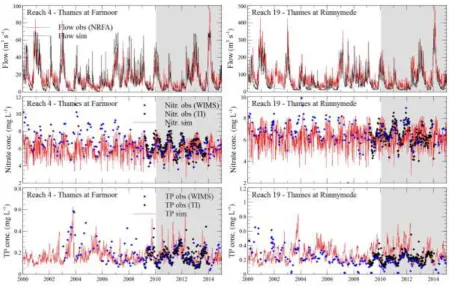
observed values of flow and water quality at two stations (reach 4 and reach 19), using data from 241
2010 to 2014. The metric used for model assessment was the Nash and Sutcliffe Efficiency (NSE - 242
Nash and Sutcliffe, 1970) for the flow and the percent bias (PBIAS - Bennett et al., 2013) for nitrate 243
and sediment on the daily results. The best model was selected and used in the rest of the study. The 244
results are shown in Figure 4, where the grey-shaded area represents the calibration period (2010-245
2014), which was chosen to ensure that the model reflects current, rather than historical, catchment 246
conditions, in particular, wastewater treatment standards, fertiliser and manure use and stocking 247
Figure 4 – INCA model calibration and validation results at two locations on the River Thames. Observed data: NRFA 250
(National River Flow Archive, daily flow, 2000-2015), TI (Thames Initiative dataset, weekly nitrate and total phosphorus, 251
2009-2014) and WIMS (Water Information Management System database, monthly nitrate and total phosphorus, 2000-252
2015). The grey-shaded area represents the calibration time period. 253
Reach Flow NSE Flow PBIAS Nitrate R2 Nitrate PBIAS
Phosphorus R2
Phosphorus PBIAS Calibration
2010-2014
Reach 4 0.81 3 0.49 -1 0.30 12
Reach 19 0.85 7 0.49 0 0.18 31
Validation 2000-2010
Reach 4 0.73 1 0.56 -4 0.28 22
[image:8.595.73.523.69.356.2]Reach 19 0.79 11 0.56 2 0.42 53
Table 1 – Performance indices of the INCA model (calibration and validation). NSE: Nash and Sutcliffe Index, R2: 254
correlation coefficient, PBIAS: percent bias. 255
As Figure 4, the model results can be considered generally satisfactory in terms of reproduction of the 256
system response to climatic variations, given the uncertainty that characterises both model results 257
and measured data values. It is important to note that this model is not used to provide daily forecasts 258
of nitrate and phosphorus concentrations in the River Thames, but rather to disentangle the average 259
catchment response to long-term changes in the climatic conditions and its consequent modifications 260
of the land use. 261
Concerning the phosphorus simulation reach 19, the PBIAS is slightly unsatisfactory, especially for 262
validation, although the R2 shows acceptable values (0.42 for validation). The interpretation of this is 263
likely to be the impact of phosphorus effluent concentrations on the river concentration. At this 264
location in the river, a large amount of wastewater effluent is discharged into the river and impacts 265
greatly the phosphorus concentration. In this study, we used a constant phosphorus concentration for 266
the effluent as input to the water quality model, due to the lack of better data. However, this 267
concentration is likely to vary in time, and it was probably higher in the early years of the 2000s and 268
lower in the present, due to the improvements in phosphorus stripping techniques (as the decreasing 269
trend in the observed concentration seems to show). Using an average concentration as model input 270
can therefore introduce an important bias. Although this is likely to affect the results of this study, the 271
phosphorus model results for reach 19 are shown anyway, since the methodology employed in this 272
3.3
Scenario-neutral methodology for climate variability impact assessment
274
A scenario-neutral approach was used to assess the impact of long-term climate change and climate 275
variability on land use and water quality. As opposed to top-down approaches, which use climate 276
model outputs to drive hydrological and environmental models, the scenario-neutral methodology is 277
based on a bottom-up approach. Environmental vulnerability indicators (in this case, river water 278
quality) are used as end-variable, and a response surface of these indicators to changes in some 279
climatic features is built using environmental models (Singh et al., 2014). The likelihood of these 280
climatic changes is then assessed by integrating information about future climate (often from climate 281
models) into the results of this methodology (Prudhomme et al., 2010). The main advantages of this 282
methodology is that it does not need to choose a specific emission scenario or a specific climate 283
model from the available tools (which is often a difficult and slightly arbitrary task) and it does not 284
need a bias-correction procedure (which can also be complex to perform in certain cases). 285
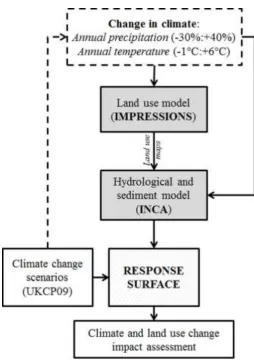
In this study, the following methodology was set up. First, the climatic stressors most likely to impact 286
water quality were identified. Alterations in these climatic stressors were then applied to the current 287
climatic observed series of daily precipitation and temperature from 1960 to 2015. This allowed the 288
creation of a number of combinations of perturbed input time series (precipitation and temperature) 289
which were used to drive both the land use model and the water quality model (Figure 5). The final 290
result was a set of nitrate and phosphorus concentration time series resulting from all the 291
combinations of the altered climatic time series. The advantages of using this methodology are that 292
no climate model output is required to drive the land use and water quality models, and therefore no 293
assumptions have to be made on future greenhouse gas emission/concentration scenarios, and no 294
bias correction of a climate model output is required (Prudhomme et al., 2010). Furthermore, in this 295
particular case, this methodology seems even more appropriate because this study focuses on long 296
term changes, without necessarily having to relate the resulting changes in land use and water quality 297
Figure 5 – Scheme of the methodology used in this study. 300
Alterations to average precipitation and average temperature were introduced by means of a uniform 301
“delta change” transformation (Hay et al., 2000) applied to observed daily precipitation and 302
temperature values. The alterations were chosen to cover the projected changes in annual 303
precipitation and temperature by climate models, but also to stress the system further, with the aim of 304
assessing not only future plausible changes but also the response of the system under very extreme 305
conditions. Following Christensen et al. (2007), for Northern Europe the annual temperature is 306
expected to increase up to 5.3°C by 2080-2099, while annual precipitation is expected to vary 307
between 0 and +16% (although a decrease in summer precipitation is also forecasted, up to 21%). 308
Therefore, seven alterations were applied to the temperature (from +0°C to +6°C with a 1°C step) and 309
eight alterations to the precipitation time series (from -30% to +40% with a 10% step), creating in total 310
56 combinations of manually-altered climate. For each time series, the IAP was first run to compute 311
the corresponding land use for the Thames catchment given the long-term climatic changes dictated 312
by the scenario-neutral climatic alterations. Then, the water quality model was run, driven by the 313
altered precipitation and temperature time series and using the land use map obtained at the previous 314
step. An additional model run was also carried out for each of the 56 climate alteration combinations, 315
using altered climate but unaltered land use (i.e., the current land use), in order to isolate the effect of 316
considering land use as a dynamic variable. The results of the water quality model were analysed in 317
terms of average nitrate concentration and average total phosphorus concentration (the averages 318
were computed over all the time period considered, i.e. 1960-2015), at two locations on the River 319
Thames (reach 4: Thames at Farmoor – i.e., upper Thames, and reach 19: Thames at Runnymede – 320
i.e., lower Thames). 321
Although, as said above, this methodology does not require the use of climate model results as inputs 322
alterations by assigning a probability of occurrence to the combinations of climate alterations 324
considered in this study. The probabilistic change factors from the UK climate projections 09 325
(UKCP09, Murphy et al., 2009) were used to determine the likelihood of the precipitation and 326
temperature changes used to drive the land use and water quality models. The UKCP09 scenarios 327
were developed by the UK Met Office to provide climate change projections over the UK accounting 328
for uncertainties in global climate models. These projections are based on the results of the HadCM3 329
coupled ocean-atmosphere Global Circulation model (Gordon et al., 2000), which was run as a 330
perturbed physics ensemble to sample model and parameter uncertainties (Murphy et al., 2007). 331
HadCM3 projections were downscaled on a 25 km grid over seven overlapping 30-yr time periods 332
based on an ensemble of 11 variants of the regional climate model HadRM3, and a statistical 333
procedure was applied to build local-scale distributions of changes for various climate variables. 334
UKCP09 gives projections for each of three of the IPCC’s Special Report on Emissions Scenarios 335
(SRES) scenarios (A1FI - called “high” in UKCP09, A1B – “medium” and B1 – “low”). Among the 336
available outputs, expected changes in average precipitation and temperature following the different 337
emission scenarios are given (change factors). The change factors were used to assess the likelihood 338
of the water quality alterations that follows the climatic alterations detailed above. No daily or monthly 339
time series were employed, and no downscaling/bias correction is required within the framework of a 340
scenario-neutral methodology. The likelihood of changes in water quality was computed by 341
comparison with climatic properties taken from a set of 10,000 change factors for the River Thames 342
catchment under the A1FI emission scenario (the most severe scenario) for several future time slices 343
(from the 2020s to the 2080s). These change factors were downloaded from the UK climate 344
projections website of the Met Office. 345
4
Results
346
4.1
Impacts of climate variability on land use
347
As the IAP model simulates a decrease in arable area across the Thames catchment and the UK with 348
increasing temperature (Figure 6), it simulates a corresponding significant increase in arable area in 349
parts of Central and Eastern Europe. Higher crop yields due to increased temperatures result in 350
greater relative profitability of arable land in these regions. Therefore growing arable crops within the 351
UK no longer maximises profit so that such land is converted to fertilised (intensive) grassland. 352
However, the model indicates that a large increase in temperature of +6°C would cause a return of 353
arable agriculture in the Thames catchment (although not at the current level). Error! Reference
354
source not found.C illustrates an expansion of the arable area under such conditions in Europe as 355
increased drought and heat stresses reduce crop yields and productivity across much of Europe. As a 356
result, demand for arable commodities is not met and increased profitability of arable land within the 357
Figure 6 –Percentage arable area per grid cell simulated by the IAP2 model for A: Baseline (current) climate, B: +3°C, 360
and C: +6°C and -30% precipitation. 361
Figure 7 and Figure 8 show the simulated arable, fertilised grassland, non-fertilised grassland and 362
forest areas of the River Thames catchment across the range of precipitation and temperature 363
changes, expressed as a percentage of the undeveloped catchment area. Figure 7 shows the 364
response of the land use to change in climate for the upper Thames, i.e., the sub-catchment drained 365
by reach 4 (Thames at Farmoor). Figure 8 shows the response of the lower Thames catchment (i.e., 366
the part of the Thames catchment drained by the River Thames between reach 4 and reach 19 – 367
Thames at Runnymede). The baseline land use fractions are shown in Figure 3. The results show that 368
the simulated agricultural land use in the Thames catchment is highly sensitive to small changes in 369
climate in Europe. In particular, both the arable land and the fertilised grassland fractions of the 370
Thames catchment appear to be especially sensitive to increases in temperature and to increases in 371
precipitation under conditions of low temperature increases. 372
373
Figure 7 – Response of the land use in the upper Thames catchment to long-term changes in the climate (sub-374
catchment drained by reach 4 – Thames at Farmoor), in terms of land use fraction of the catchment. Black lines are 375
surface contour lines (bold lines every 10% land use fraction, thin lines every 2.5%). 376
[image:12.595.74.522.420.556.2] [image:12.595.72.519.608.747.2]Figure 8 – Response of the land use in the lower Thames catchment to long-term changes in the climate (sub-378
catchments drained by the River Thames from reach 4 to reach 19 – Thames at Runnymead), in terms of land use 379
fraction of the catchment. Black lines are surface contour lines (bold lines every 10% land use fraction, thin lines 380
every 2.5%). 381
Even a small increase in temperature causes a sharp decrease in arable land, and corresponding 382
increase of fertilised grassland. As temperature increases above ~2C, the arable area decreases to 383
~0% in most of the catchments under all precipitation scenarios. This does not reflect the inability of 384
such arable crops to grow under these conditions, but rather that it is more profitable to meet demand 385
in other parts of Europe. 386
4.2
Impacts of climate variability on water quality
387
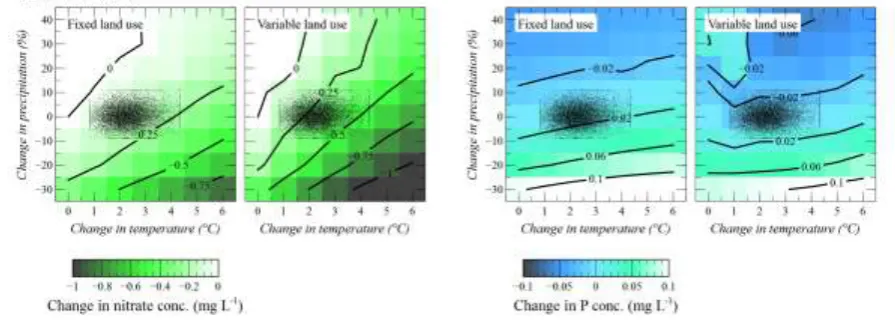
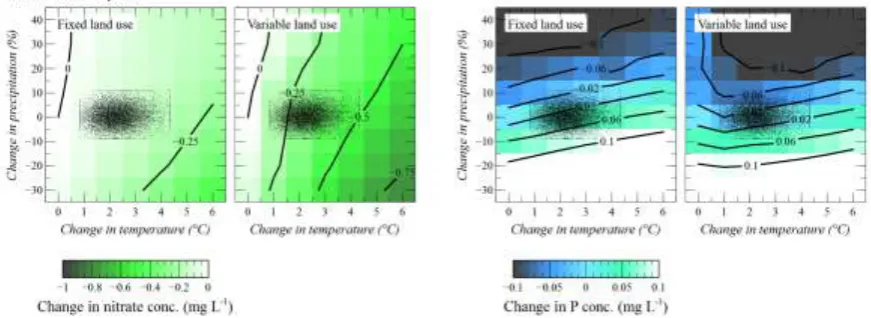
The INCA model results provided an assessment of the response of the River Thames water quality 388
to changes in annual precipitation and temperature. In Figure 9 and Figure 10 the response surfaces 389
are shown for the two different river reaches (Figure 9: reach 4 – Thames at Farmoor, Figure 10: 390
reach 19 – Thames at Runnymede), and for the two water quality variables analysed in this paper 391
(nitrate concentration: left part of the plots, total phosphorus concentration: right part of the plots). 392
Two water quality response surfaces are shown for each variable: the response under fixed (baseline) 393
land use representing the direct impact of climate change on hydrological functioning, nutrient 394
transport and in-river processes; and the response under variable land use that also includes the 395
indirect changes associated with long-term autonomous land use change and associated changed 396
agricultural nutrient inputs. 397
Nitrate in the Thames catchment is mainly due to diffuse sources (fertilisers used in agriculture, Jin et 398
al., 2012), hence its concentration in the river is proportional to runoff. An increase in temperature 399
increases evapotranspiration and, as a consequence, causes a decrease in runoff (Figure 9 and 400
Figure 10). In the same way, a decrease in precipitation entails a decrease in runoff and thus a 401
decrease in nitrate concentration. Furthermore, a decrease stream flow means reduced velocity, 402
increased residence times and hence enhance the denitrification processes, reducing nitrate 403
concentration (Jin et al., 2012). On the contrary, the main sources of phosphorus in the Thames are 404
household effluents discharged by sewage treatment plants (Crossman et al., 2013b; Whitehead et 405
al., 2013), and therefore phosphorus concentration is inversely proportional to flow (i.e., less flow 406
means less dilution capacity and higher phosphorus concentration). This means that an increase in 407
temperature causes an increase in phosphorus concentration, while an increase in precipitation 408
[image:13.595.68.516.540.701.2]Figure 10 – Response to climate variability on the water quality of the River Thames at Runnymede – reach 19. The 415
black dots represent the space defined by the UKCP09 change factors for the 2040s. The black lines are surface 416
contour lines (every 0.5 mg l-1 for nitrate, every 0.04 mg l-1 for phosphorus).
417
The change in nitrate concentration is inversely proportional to temperature and directly proportional 418
to precipitation, with a similar pattern of control exerted by both drivers of change (changes in 419
precipitation and temperature), at least within the range of variations considered in this study. On the 420
other hand, phosphorus has a different behaviour, with marked increases due to a decrease in 421
precipitation, and also a direct proportionality with temperature, although weaker than with 422
precipitation. This is more evident at reach 19 (lower Thames), while for reach 4 (upper Thames) the 423
pattern is not as clear, and the response surface gradient is not homogeneous. 424
From Figure 9 and Figure 10 it can also be observed that some important differences in water quality 425
behaviour arise by allowing the land use to autonomously adjust to the climate rather than remaining 426
static. The variable land use appears to enhance the proportionality between increase in temperature 427
and decrease in nitrogen concentration. In terms of phosphorus concentration, considering variable 428
land use introduces a very significant change in the catchment response, where it appears to offset 429
the effect of decreasing precipitation in increasing phosphorus concentration. This effect appears 430
more evident in the rural reach 4, where the relative contribution of diffuse sources of phosphorus is 431
higher than at reach 19, and thus the catchment is more sensitive to changes in land use. 432
Figure 9 and Figure 10 also allow analysing the spatial patterns of the catchment response. In terms 433
of nitrate concentration, the model results suggest that the upper Thames is more sensitive to 434
changes in climate than the lower Thames, while for phosphorus concentration the opposite effect is 435
observed. Additionally, the sensitivity of the response to the drivers of change considered in this study 436
is different depending on the sub-catchment. For example, in the lower Thames nitrate concentration 437
seems to be less sensitive to changes in precipitation than in the upper Thames, as the gradient of 438
the response surfaces shows. 439
4.3
Likelihood of water quality changes
440
The response surfaces shown in Figure 9 and Figure 10 provide an assessment of the system 441
sensitivity to some drivers of change, but do not offer any information on the likelihood of the 442
simulated changes in water quality happening in the future. Nevertheless, climatic model outputs can 443
provide a value of likelihood of the drivers of change considered. In Figure 9 and Figure 10, a white-444
shaded area is shown on each of the response surfaces, indicating the area defined by 10,000 445
combinations of UKCP09 precipitation and temperature change factors for the 2040s, under the A1FI 446
emission scenario. Computing the catchment response in terms of water quality corresponding to 447
each of these 10,000 pairs of annual precipitation/temperature changes allows a probability function 448
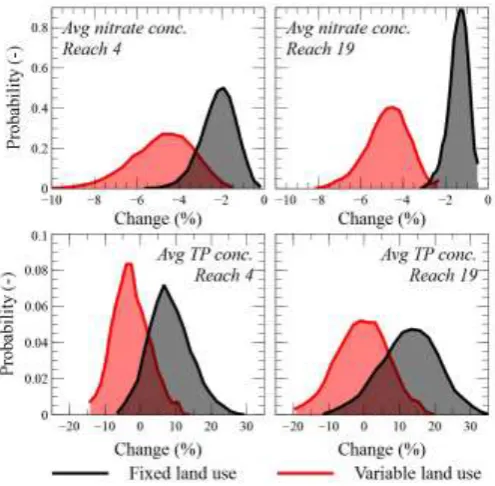
In Figure 11, the empirical probability distribution functions of expected average nitrate concentration 450
change and expected average total phosphorus concentration changes, corresponding to the 10,000 451
UKCP09 precipitation and temperature change factors, for both fixed and variable land use are given. 452
In all cases considering variable land use introduces considerable changes in the final outcome. For 453
reach 4, the median expected change in the total phosphorus concentration even shifts from positive 454
to negative, thus highlighting the effect of land use in mitigating climate change. This is reflected also 455
in Table 2, where the median expected changes and their standard deviations are shown, based on 456
the results depicted in Figure 11. 457
[image:15.595.174.422.187.430.2]458
Figure 11 – Probability distribution function of expected changes in water quality (average concentration of nitrate and 459
total phosphorus), according to the UKCP09 change factors for the 2040s, for two reaches of the River Thames (reach 460
4 – Thames at Farmoor and by reach 19 – Thames at Runnymead). 461
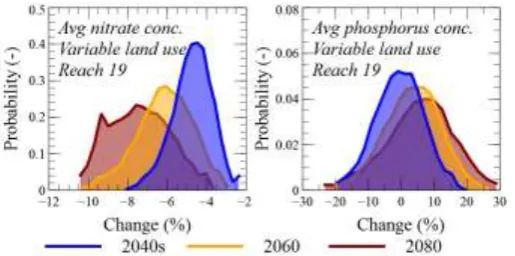
Table 2 also shows the model results for 2060s and 2080s. The change of the system response 462
according to the UKCP09 for different time slices is also represented in Figure 12, for reach 19, and 463
considering variable land use. The decrease in nitrate concentration and increase in phosphorus 464
concentration increase in time, due to a stronger signal of warming, which reduces runoff and stream 465
flow. 466
Reach 4 Reach 19
Water quality variable
Time
slice Land use
Median change
Standard deviation
Median change
Standard deviation
Average nitrate concentration
2040s Fixed land use -2.2 0.8 -1.4 0.5
2040s Variable land use -4.9 1.4 -4.8 1.0
2060s Fixed land use -3.3 1.2 -2.1 0.7
2060s Variable land use -7.0 2.1 -6.3 1.4
2080s Fixed land use -4.2 1.5 -2.8 0.9
2080s Variable land use -8.7 2.3 -7.6 1.5
Average total
2040s Fixed land use 6.9 5.9 11.8 8.2
[image:15.595.87.505.554.723.2]Figure 12 – Probability distribution function of expected changes in water quality (% change in average concentration 470
of nitrate and total phosphorus), according to the UKCP09 change factors for the 2040s, 2060s and 2080s for reach 19 471
(Thames at Runnymead), with variable land use. 472
5
Discussion
473
The results of this study show that market-driven adaptation of land use to climate change and long-474
term climate variability can lead to significant changes. An increase in precipitation across Europe 475
appears to lead to a large expansion of the total agriculture land represented by arable and fertilised 476
grassland within the Thames catchment, while a decrease in precipitation would not bring very 477
significant changes to the agricultural fraction of the Thames catchment. In contrast, the non-fertilised 478
grassland and forest fractions of the catchment are not subject to significant changes, unless both 479
precipitation and temperature increase sharply. 480
In the Thames catchment, this translates into an expansion of fertilised grassland at the expense of 481
arable land. This is in apparent contradictions with the findings of Olesen and Bindi (2002), who 482
stated that global warming is expected to lead to the expansion of suitable cropping areas in the North 483
of Europe, although the Thames catchment is situated in the warmest and driest area of the UK, with 484
Figure 3 showing expansion of arable areas in the Baltic states, Republic of Ireland, Scotland and 485
southern Scandinavia. However, the IMPRESSIONS IAP used in this study simulates land use based 486
on a range of trade-offs between multiple sectors and considers production and demand across 487
Europe as a whole, assigning land use based on resulting profitability. The model results do not 488
indicate that the Thames catchment (or the UK) becomes unsuitable for crops under warming 489
scenarios, but that they become less profitable compared to their cultivation in other areas in Europe 490
or compared to other land use types in the catchment. In the Thames catchment the increase in 491
arable land in other areas of Europe in response to climate change alone appears to be the main 492
driver of land use change, leading to a reduction in the profitability of agricultural land within the 493
catchment. However, studies investigating the combined impacts of climate and socio-economic 494
change (such as population, dietary preferences, GDP, and the level of food imports) on European 495
landuse allocation have shown major divergence in land use allocation between socio-economic 496
scenarios (Harrison et al., 2014) and a significant decrease in certainty of land use change (Holman 497
et al., In Press). A broader range of land use change outcomes in the Thames catchment would 498
therefore be likely under future socio-economic scenarios associated with changed European 499
agricultural productivity, food demand and trade relationships. 500
Olesen and Bindi (2002) report potential implication of nutrient leaching due to the impact of global 501
warming on agriculture. Nutrient pollution is the result of the combination of diffuse and point sources 502
from a variety of land uses and interactions. For example, in the upper Thames fertilised grassland is 503
the main land use, while intensively cultivated land is secondary; in the lower Thames agriculture is 504
predominant, but with important proportions of forest land. The co-evolution of this mosaic of land 505
uses and their implications on water quality could not be evaluated without using mathematical 506
models (Tong and Chen, 2002). This study shows a methodology that couples a land use model with 507
concentration of the River Thames. It is clear from Figure 9 and Figure 10 that the co-evolution and 509
adaptation of land use to changes in climate is a key factor in nutrient export towards the river system, 510
and must be taken into account. Furthermore, the results of the present study suggest that the impact 511
of climate change alone will be to enhance phosphorus concentration during low flows, similarly to 512
what was found by both Crossman et al. (2013) and Bussi et al. (2016b). 513
In terms of nitrate concentration, Jin et al. (2012) also provided climate change impact estimates in 514
the River Thames catchment, using the INCA model in a top-down frame (i.e., coupling the water 515
quality model with climate model projections), reporting increased river nitrate concentration in winter 516
and decreases in summer, following wetter winters and drier summers. These findings also agree with 517
the results of the present study, which pointed to a similar response of the Thames catchment to 518
increases and decreases in precipitation. In another study, Ferrier et al. (1995) found that Climate 519
change will alter flow regimes, temperature and nitrogen mineralization patterns in the River Don 520
(Scotland). They found that increased mineralization of nitrogen in the soil will be triggered by climate 521
change, but also that nitrate concentrations will be reduced slightly by the increased temperatures 522
and decreased summer flows, both of which enhance denitrification processes. 523
Concerning land use impacts on nitrate concentration in the Thames, Howden et al. (2010) reported 524
that the main driver of historical observed change is land use, and that long-term changes in 525
agricultural land use are more important that recent changes in farming practice. They found that 526
once a step-change in land use intensification (principally a shift from low intensity grassland to highly 527
intensive arable agriculture) has occurred, nitrate concentrations remain intractably high despite 528
large-scale and sustained management intervention. These changes are irreversible unless a 529
significant area of arable land is converted to low intensity grassland or forest (Howden et al., 2010). 530
In their paper, Howden et al. (2010) also urged caution before implementing policies (usually market-531
driven) that encourage massive land conversions as their impact on fresh and marine waters could 532
persist for many decades. Similarly, Whitehead et al. (2002), after reconstructing the past land use 533
changes in the River Kennet catchment (a tributary of the Thames), found that a sharp increase in 534
agricultural land since the 1930s caused a major shift in the short term dynamics of nitrate in the river 535
with increased river and groundwater concentrations caused by non-point source pollution from 536
agriculture. In light of these statements, the methodology described in the present study offers a 537
robust tool to analyse the long-term impact of large changes in arable land extension due to variations 538
in crop productivity and demand, rather than to short term changes in farming practices. 539
One of the main contributions of this study is the assessment of the co-evolution of the land use with 540
changes in climate. Figure 9 and Figure 10 show the differences in the response if the variation of 541
land use with climate is taken into account or not. In general, there is an inverse relationship between 542
temperature and nitrate concentration, because an increase in temperature causes increased 543
evapotranspiration and reduced runoff from agricultural soils, as well as increased instream 544
denitrification due to lower flows. If variable land use is introduced, this relationship is enhanced, 545
because with an increase in temperature the total arable area is reduced (Figure 9 and Figure 10), 546
and thus the sources of nitrate are further reduced. This is a synergistic impact of land use and 547
warming on nitrate concentration in rivers. 548
In terms of phosphorus, temperature has the opposite effects, i.e. it increases the phosphorus 549
concentration in the river, because it reduces the river flow which is used to dilute the effluent coming 550
catchments experience very different alterations in their land use under the same combinations of 559
precipitation and temperature change. Therefore, the results of this study cannot be extrapolated to 560
other catchments. Nevertheless, they can be informative of the interplays that can occur between land 561
use and climate and their effects on agriculture and water quality, such as for example the expansion 562
or reduction of arable land due to changes in climate in different regions of the world. Additionally, this 563
paper shows that for catchment like the Thames, where the human-affected land is predominant, 564
socio-economic drivers of change must be considered, and they need to be taken into account at a 565
very large (continental or world) scale. 566
A key limitation of this study is that it did not take into account policy responses to changes in nutrient 567
concentration, such as for example the implementation of buffer strips to retain the excess of nutrients 568
moving towards the river network. Buffer strips are taken into account in the INCA parameterisation, 569
through the in-channel module of the INCA model versions. Some example of its applications are 570
Crossman et al. (2013), Flynn et al. (2002) and Whitehead et al. (2010). However, the coarse 571
resolution of the land use model did not allow accounting for variations in the buffer strips to respond 572
to changes in the river nutrient concentrations. This is surely a very important point that must be 573
addressed in future investigations. 574
Although a comprehensive analysis of the model uncertainty was not among the aims of this paper, it 575
is important to analyse the sources of uncertainty that affects the results of this study. In particular, 576
the modelling chain employed in this study (a “cascade” of two models: IMPRESSIONS and INCA) 577
propagates errors from the inputs down to the outputs. The uncertainty of the INCA model was 578
assessed separately in different studies. For example, the uncertainty of the INCA model has been 579
assessed in several papers, such as for example Raat et al. (2004), who pointed out the problem of 580
equifinality and suggested a multi-objective calibration approach, as well as the use of frequent 581
measurements (fortnightly frequency) as reference values for calibration. Dean et al. (2009) applied a 582
generalised likelihood uncertainty estimation (GLUE) framework to the INCA-P model, and concluded 583
that the uncertainty due to the model structure and parameterisation was similar to the uncertainty of 584
the measured values of total phosphorus in the river. Rankinen et al. (2006) also applied a GLUE 585
approach to evaluate the uncertainty of the INCA-N model results, integrating “soft data”, or 586
experimental knowledge of the processes, into the calibration procedure. Bussi et al. (2016) also 587
showed a sensitivity analysis of the sediment version of INCA (included in INCA-P), providing an 588
estimation of the parametric uncertainty of the model results. The parametric uncertainty of the whole 589
combination of these two models was not quantified in this study, although it can be assessed 590
qualitatively. This modelling combination involves around 25-30 influential parameters, based on 591
previous uncertainty assessments (Bussi et al., 2016; Dean et al., 2009; Futter et al., 2014; Jackson-592
Blake and Starrfelt, 2015; Raat et al., 2004; Rankinen et al., 2006; Whitehead et al., 2015). As stated 593
for example by Skeffington et al. (2007), in a modelling chain the output uncertainty is typically less 594
than the summed uncertainty in the input parameters. It can be reasonably stated that the final 595
uncertainty of the modelling chain is of the same order of magnitude than the uncertainty of the single 596
models. This level of uncertainty is normally considered acceptable for climate change and land-use 597
change analysis in the literature, in particular when reproducing highly uncertain processes. It is also 598
worth pointing out that uncertain models can still provide extremely useful information for planners 599
and managers, especially for scenario analysis where the factors of change in the variable of interest 600
are used rather than the absolute values of those variables (Cosby et al., 1986). Furthermore, the 601
model parametric uncertainty must be considered along with other sources of uncertainty, among 602
which the most important is probably the climate scenarios uncertainty. This is acknowledged to be a 603
very relevant source of uncertainty in climate change impact assessment studies (Kay et al., 2009; 604
Prudhomme and Davies, 2009a, 2009b; Wilby and Harris, 2006). Here, climate models were not used 605
in the modelling cascade, but they were still employed to define the “probable” area of the response 606
surfaces. UKCP09 projections were developed to include a very broad range of possible future 607
reasonable to think that the ranges of water quality variations due to changes in average precipitation 609
and temperature include both the uncertainty regarding future climate and the modelling chain 610
parametric uncertainty (the latter probably being much lower than the former). Nevertheless, as stated 611
before, a much more comprehensive study is needed to quantify with more accuracy the uncertainty 612
of the modelling chain results. 613
Lastly, the methodology used in this study has certain limitations that must be accounted for and 614
stressed. The scenario neutral methodology, as stated in other studies (Bussi et al., 2016b; 615
Prudhomme et al., 2010) is based on selecting the main drivers of change given a selected variable. 616
In this case, the variable is water quality and the drivers of change are changes in annual precipitation 617
and changes in annual temperature. Other drivers of changes could be considered. For example, 618
Prudhomme et al. (2010) considered alterations in the seasonality of precipitation, and Bussi et al. 619
(2016a) took into account changes in extreme precipitation. In this paper we did not address the 620
changes in nutrients caused by climatic changes other than variations in the average precipitation and 621
temperature. Clearly, this is a very important limitation, given that changes in extreme events and 622
seasonality can also cause alterations in the water quality, independently from the variations in the 623
mean. However, in this paper we only analysed changes in the long-term mean of nutrient 624
concentration, and thus it seems reasonable to consider only alterations in the average climate. This 625
limitation should also be assessed in future developments of this study. 626
627
6
Conclusions
628
An assessment of the impact of long-term climatic changes on land use and water quality was carried 629
out, using the INCA water quality model within a scenario-neutral framework, for the River Thames 630
catchment (UK). Contrary to most of the previous studies in the field of climate and land use/land 631
cover changes impact assessment, in the present study the land use was not treated as a static 632
parameter of the catchment, but rather as a dynamic variable, which varies depending on the long 633
term response of European agriculture and forestry to climate change (especially precipitation and 634
temperature). 635
Using a land use allocation model coupled with a water quality model, this study demonstrated a 636
methodological approach to evaluate the joint impact of climate and land use changes on water 637
quality, taking into account the autonomous adaptation of land use and agriculture to a changing 638
climate. The European scale of application of the land use allocation reflects an appropriate scale for 639
the representation of food and timber production systems and markets. This study also proved the 640
importance of such a dynamical approach in reproducing land use response to climate, showing that 641
considering this factor can, in some circumstances, lead to results that are completely different than if 642
the land use adaptation is not considered. 643
644
This study showed how temperature warming is expected to cause a shift from arable land to fertilised 645
grassland in the River Thames catchment, although this pattern could be slightly altered depending 646
on the long-term variations of the annual precipitation. Climate change is expected to decrease the 647
(effluents). This study demonstrated the importance of representing catchment land use change as a 656
dynamic variable responding to climate change in future water quality assessments, considering land 657
use allocation in a way that reflects large-scale market supply and demand. 658
Acknowledgements
659This study forms part of the MaRIUS project (Managing the Risks, Impacts and Uncertainties of 660
droughts and water Scarcity), which is funded by the Natural Environment Research Council (NERC) 661
under the UK Droughts and Water Scarcity Programme (Grant NE/L010364/1 and NE/L010186/1). 662
The IAP was developed through funding from the European Commission Seventh Framework 663
Programme under Grant Agreement No. 244031 (The CLIMSAVE Project; Climate change integrated 664
assessment methodology for cross-sectoral adaptation and vulnerability in Europe; www.climsave.eu) 665
and 603416 (the IMPRESSIONS project; Impacts and Risks from High End Scenarios: Strategies for 666
Innovative Solutions; www.impressions-project.eu). The meteorological data (precipitation and 667
temperature) were provided by the UK Met Office. The river flow data were provided by the National 668
River Flow Archive. The nutrient data were provided by the Environment Agency of England and 669
Wales and by the Centre of Ecology and Hydrology’s Thames Initiative platform. 670
References
671Annetts, J., Audsley, E., 2002. Multiple objective linear programming for environmental farm planning. J. Oper. 672
Res. Soc. 53, 933–943. doi:10.1057/palgrave.jors.2601404 673
Audsley, E., Trnka, M., Sabaté, S., Maspons, J., Sanchez, A., Sandars, D., Balek, J., Pearn, K., 2014. 674
Interactively modelling land profitability to estimate European agricultural and forest land use under future 675
scenarios of climate, socio-economics and adaptation. Clim. Change 128, 215–227. doi:10.1007/s10584-676
014-1164-6 677
Bennett, N.D., Croke, B.F.W., Guariso, G., Guillaume, J.H.A., Hamilton, S.H., Jakeman, A.J., Marsili-Libelli, S., 678
Newham, L.T.H., Norton, J.P., Perrin, C., Pierce, S.A., Robson, B., Seppelt, R., Voinov, A.A., Fath, B.D., 679
Andreassian, V., 2013. Characterising performance of environmental models. Environ. Model. Softw. 40, 680
1–20. doi:10.1016/j.envsoft.2012.09.011 681
Bloomfield, J.P., Bricker, S.H., Newell, A.J., 2011. Some relationships between lithology, basin form and 682
hydrology: a case study from the Thames basin, UK. Hydrol. Process. 25, 2518–2530. 683
doi:10.1002/hyp.8024 684
Bowes, M.J., Gozzard, E., Johnson, A.C., Scarlett, P.M., Roberts, C., Read, D.S., Armstrong, L.K., Harman, S.A., 685
Wickham, H.D., 2012. Spatial and temporal changes in chlorophyll-a concentrations in the River Thames 686
basin, UK: are phosphorus concentrations beginning to limit phytoplankton biomass? Sci. Total Environ. 687
426, 45–55. doi:10.1016/j.scitotenv.2012.02.056 688
Brown, C., Brown, E., Murray-Rust, D., Cojocaru, G., Savin, C., Rounsevell, M., 2014. Analysing uncertainties in 689
climate change impact assessment across sectors and scenarios. Clim. Change 128, 293–306. 690
doi:10.1007/s10584-014-1133-0 691
Bussi, G., Dadson, S.J., Whitehead, P.G., Prudhomme, C., 2016a. Modelling the future impacts of climate and 692
land-use change on suspended sediment transport in the River Thames (UK). J. Hydrol. 542, 357–372. 693
doi:10.1016/j.jhydrol.2016.09.010 694
Bussi, G., Whitehead, P.G., Bowes, M.J., Read, D.S., Prudhomme, C., Dadson, S.J., 2016b. Impacts of climate 695
change, land-use change and phosphorus reduction on phytoplankton in the River Thames (UK). Sci. Total 696
Environ. 572, 1507–1519. doi:10.1016/j.scitotenv.2016.02.109 697
Christensen, J.H., Hewitson, B., Busuioc, A., Chen, A., Gao, X., Held, I., Jones, R., Kolli, R.K., Kwon, W.-T., 698
Laprise, R., Magaña Rued, V., Mearns, L., Menéndez, C.G., Räisänen, J., Rinke, A., Sarr, A., P., W., 2007. 699
Regional climate projections, in: Solomon, S., Qin, D., Manning, M., Chen, Z., Marquis, M., Averyt, K.B., 700
Tignor, M., Miller, H.L. (Eds.), Contributionof Working Group I to the Fourth Assessment Report of 701
theIntergovernmental Panel on Climate Change Climate Change2007:The Physical Science Basis. 702
Cambridge University Press, Cambridge, pp. 847–940. 703
Crossman, J., Futter, M.N., Oni, S.K., Whitehead, P.G., Jin, L., Butterfield, D., Baulch, H.M., Dillon, P.J., 2013a. 704
Impacts of climate change on hydrology and water quality: Future proofing management strategies in the 705
Lake Simcoe watershed, Canada. J. Great Lakes Res. 39, 19–32. doi:10.1016/j.jglr.2012.11.003 706
Crossman, J., Whitehead, P.G., Futter, M.N., Jin, L., Shahgedanova, M., Castellazzi, M.S., Wade, A.J., 2013b. 707
The interactive responses of water quality and hydrology to changes in multiple stressors, and implications 708
for the long-term effective management of phosphorus. Sci. Total Environ. 454–455, 230–44. 709
doi:10.1016/j.scitotenv.2013.02.033 710