warwick.ac.uk/lib-publications
Original citation:Du Lac, Melchior, Scarpelli, Andrew H., Younger, Andrew K. D., Bates, Declan and Leonard, Joshua N.. (2017) Predicting the dynamics and heterogeneity of genomic DNA content within bacterial populations across variable growth regimes. ACS Synthetic Biology, 6 (7). pp. 1131-1139.
Permanent WRAP URL:
http://wrap.warwick.ac.uk/82264
Copyright and reuse:
The Warwick Research Archive Portal (WRAP) makes this work of researchers of the University of Warwick available open access under the following conditions. Copyright © and all moral rights to the version of the paper presented here belong to the individual author(s) and/or other copyright owners. To the extent reasonable and practicable the material made available in WRAP has been checked for eligibility before being made available.
Copies of full items can be used for personal research or study, educational, or not-for-profit purposes without prior permission or charge. Provided that the authors, title and full bibliographic details are credited, a hyperlink and/or URL is given for the original metadata page and the content is not changed in any way.
Publisher’s statement:
ACS AuthorChoice - This is an open access article published under an ACS AuthorChoice License, which permits copying and redistribution of the article or any adaptations for non-commercial purposes.
The version presented here may differ from the published version or, version of record, if you wish to cite this item you are advised to consult the publisher’s version. Please see the ‘permanent WRAP url’ above for details on accessing the published version and note that access may require a subscription.
Predicting the Dynamics and Heterogeneity of Genomic DNA
Content within Bacterial Populations across Variable Growth
Regimes
Melchior du Lac,
†,∇Andrew H. Scarpelli,
‡,∇Andrew K. D. Younger,
‡Declan G. Bates,
*
,†and Joshua N. Leonard
*
,§,∥,⊥,#†Warwick Integrative Synthetic Biology Centre, School of Engineering, University of Warwick, Coventry CV4 7AL, United Kingdom ‡Interdepartmental Biosciences Graduate Program,§Department of Chemical and Biological Engineering,∥Center for Synthetic
Biology,⊥Chemistry of Life Processes Institute, and #Robert H. Lurie Comprehensive Cancer Center, Northwestern University, Evanston, Illinois 60208, United States
*
S Supporting InformationABSTRACT: For many applications in microbial synthetic biology, optimizing a desired function requires careful tuning of the degree to which various genes are expressed. One challenge for predicting such effects or interpreting typical characterization experiments is that in bacteria such asE. coli, genome copy number varies widely across different phases and rates of growth, which also impacts how and when genes are expressed from different loci. While such phenomena are relatively well-understood at a mechanistic level, our quantitative understanding of such processes is essentially limited to ideal exponential growth. In contrast, common experimental phenomena such as growth on heterogeneous media, metabolic adaptation, and oxygen restriction all cause substantial deviations from ideal exponential growth, particularly as cultures approach the higher densities at which industrial biomanufacturing and even routine screening experiments are conducted. To meet the need for predicting and explaining how gene dosage impacts cellular functions outside of exponential growth, we here report a novel modeling strategy that leverages agent-based simulation and high performance computing to robustly predict the dynamics and heterogeneity of genomic DNA content within bacterial populations across variable growth regimes. We show that by feeding routine experimental data, such as optical density time series, into our heterogeneous multiphasic growth simulator, we can predict genomic DNA distributions over a range of nonexponential growth conditions. This modeling strategy provides an important advance in the ability of synthetic biologists to evaluate the role of genomic DNA content and heterogeneity in affecting the performance of existing or engineered microbial functions.
KEYWORDS: genome replication, genomic heterogeneity, DNA copy number, computational modeling, synthetic gene circuits
F
or many applications in microbial synthetic biology, optimizing a desired function, such as biosynthesis via an engineered metabolic pathway, requires careful and labor-intensive optimization of the degree to which various genes are expressed.1 Transgene copy number, genomic integration site, promoter strength, translational efficiency, and culture conditions all impact “function” in a manner that is difficult to predict and typically requires high throughput screening2−4 or evolutionary selection for such properties.5 One challenge for predicting such effects or even interpreting typical characterization experiments is that in bacteria such asE. coli, genome copy number varies widely across different phases of growth, often exceeding eight copies per cell during portions of a typical fermentation.6−9 Genomic replication also impactshow and when endogenous genes are expressed from different loci,10and in addition, growth rate affects gene expression at a global level.11 While such phenomena are relatively well-understood at a mechanistic level and benefit from decades of research in this area, there are important gaps in our quantitative understanding of such processes that limit our ability to predict or explain the impact of genomic copy number variation on engineered biological functions.
In E. coli, upon which this discussion will focus, DNA replication begins at the origin of replication, oriC,8 and is
Special Issue: IWBDA 2016
Received: November 2, 2015
Published: September 30, 2016
Research Article
facilitated by DnaA.12 The initiation of replication is largely regulated by DnaA, which accumulates at oriC via an ATP-dependent process to alter the conformation of oriC and recruits the helicase, DnaB, which initiates the process of replication.13−15Replication proceeds in both directions from
oriC and continues until termination, a process that is coordinated by interactions between the protein Tus and one of 10Tersequences along the genome.16Tus complexes with
Tersites in an asymmetric fashion, which enables the complex to function as a direction-specific terminator of replication. When a replication fork reaches a Tus complex from one direction, the Tus complex will dissipate and replication will continue.17 If the replication fork reaches the Tus complex from the other direction, however, the Tus complex will remain intact, inhibiting further replication until the opposite replication fork is able to complete replication from the other direction. Thus, the concentration of active (ATP-bound) DnaA is generally understood to integrate the effects of cell size and other aspects of cell state in order to regulate genome replication, although these processes are only indirectly connected to the regulation of cell division. Indeed, decoupling the regulation of cell division and genome replication enablesE. colito grow rapidly when nutrients are abundant. The minimal time required to replicate the genome is about 40 min, but by initiating multiple rounds of replication prior to cell division, the doubling time can be substantially shorter than 40 min.8
The regulation of cell division in E. coli is less well understood than is the regulation of DNA replication, but regulation is strongly coupled to cell size,18and a number of essential regulators of cell division have been identified.19The
first protein to localize at the point of division is FtsZ, a tubulin homologue that forms a ring around the nucleoid of the cell.20 This ring can form well before the two distinct genomic copies separate into distinct regions. The ring then complexes with the membrane-bound ZipA, tethering the ring to the membrane in preparation to pinch the membrane during division.21 This leads to the recruitment of a number of proteins to form the divisome, which contracts the membrane while actively transporting chromosomes to opposite daughter cells to complete the process of division.22While the adaptive benefits of such decoupling between genome replication and cell division are well understood, this decoupling also presents challenges for predicting both dynamics and intercellular variations in genomic DNA content.
To address these issues, a number of theoretical models have been developed to predict variations in genomic DNA content. The most widely used model was first created in 1968 by Cooper and Helmstetter (hereafter, CH model).23 The CH model was the first to formally describe the relationship between mass accumulation and chromosome dynamics of a bacterium, and it explained, among other things, the aforementioned dynamics associated with overlapping rounds of genome replication.23The central observation motivating the CH model is that every DNA replication initiation event occurs at a fixed ratio between the number of origins of replication (copies of oriC) and the mass of the cell.24 To explain this observation, the CH model separates the cell cycle into three distinct phases. The“C”phase represents the time required to complete one round of genomic DNA replication. Once the cell completes at least one round of replication, the “D” phase represents the period during which the cell then undergoes segregation of the chromosomes into two daughter cells to complete cell division. If the doubling time is greater than the
sum of the C and D periods, then another phase arises called the“B”phase, which is simply the time required for the cell to accumulate enough mass to initiate a new round of replication.25By combining the CH model with a probability density function (PDF) describing the theoretical age distribution of a population growing exponentially,26 the DNA distributions of such a population can be calculated using the growth rate, C and D times.27This strategy has been widely used to determine the C and D parameters, for example by fitting simulated DNA distributions to experimentally measured DNA distributions sampled from exponentially growing cultures.28,29
However, outside the scope of exponential growth the previously described PDF representing the age distribution of a population is no longer valid, since the previous assumption of unrestricted growth cannot be made. During a typical batch fermentation, cells exiting exponential growth experience a transition phase, a stationary phase, andfinally a death phase, during which growth limiting factors becoming increasingly important. Furthermore, cells grown upon complex media may exhibit multiple instances of such phases, as well as other dynamics.27,29 To help explain growth restriction, various mechanistic growth models have been proposed,30 each of which is an extension of the Malthusian growth model with context-specific parameters that restrict growth in ways that may be loosely attributed to biological mechanisms.31,32 However, Malthusian models generally provide poor fits to experimentally observed growth curves for a wide range of growth conditions.33Monod pioneered the early development of empirical models that betterfit experimental growth curves, by mathematically linking the growth rate of a population of cells to particular growth-limiting substrates.34,35Except in the case of idealized three phase growth curves, however, all such models are generally highly inaccurate.36Since the vast majority of synthetic biology characterization experiments utilize batch fermentations, such as shake flasks, and microtiter plate cultures, which exhibit complex growth dynamics particularly as cell densities become appreciable, new tools are required to predict and evaluate genomic DNA content under such conditions.30,36,37
To meet this need, we report a novel modeling strategy that leverages agent-based simulation and high performance computing to robustly predict the dynamics and heterogeneity of genomic DNA content within bacterial populations across variable growth regimes. We show that by directly feeding routinely collected experimental data, such as optical density (OD) time series, into our mechanistic simulations, our model predicts genomic DNA distributions that accurately reproduce those observed experimentally over a range of nonexponential growth conditions.
■
RESULTS AND DISCUSSIONAgent-Based Simulation Generates a Heterogeneous Multiphasic Growth (HMG) Simulator.Most simulations of bacterial population dynamics start with a simple model of growth, typically framed at the single cell level, which is then expanded to predict the growth dynamics of populations.28,29,38 Our objectives are not well served by this approach, in that from a bioengineering standpoint, it would be useful to have a model that works in the reverse direction−starting from simple, experimentally measured growth curves (OD vs time), such a model would enable one to infer the growth dynamics of the individual cells within such a population. To achieve this goal of
ACS Synthetic Biology Research Article
DOI:10.1021/acssynbio.5b00217
describing chromosomal dynamics across a heterogeneous population, we designed an agent-based simulation framework termed the heterogeneous multiphasic growth (HMG) simulator. This framework comprises two distinct innova-tionsan “injection growth” mechanism and a novel agent-based description of the bacterial cell cycle.
The“injection growth”mechanism was designed to enable us to relate experimentally measured growth curves to the growth of individual cells within the simulation (see Supporting Information section I.2.3). To implement this mechanism, at every time step, we calculate the population’s instantaneous volumetric changes (where, in this case“volumetric”refers to the collective cellular volume of the population), and distribute the changes in volume equally among all members of a population (assuming a well-mixed system). This mechanism thus enables us to match the growth of simulated cells to the growth of the measured population without restricting our analysis to the limited window or assumption of balanced growth, such that the injection growth model may be used across various phases of growth.30,36,37 Because population dynamics under exponential growth have been extensively studied and robustly mathematically defined, we leverage this knowledge to initiate our simulated population of cells such that the simulated DNA distributions and cell states match those expected for exponentially growing cells.6,23,38In practice, this requires us tofirst identify the section of the experimental growth curve in which cells are growing exponentially, and we developed a partially automated strategy for doing so (see Supporting Information Figure S3). We then initiate our simulations using this measured exponential growth rate, and the model is advanced under conditions of Malthusian growth to generate a population of simulated cells that represent a distribution of states observed during exponential growth. We hypothesized that if such an injection model were coupled to a suitably mechanistic description of DNA replication and cell
division, it may be possible to predict genomic DNA distributions beyond exponential phase growth (Figure 1).
The second innovation of the HMG simulator comprises a novel agent-based model of the bacterial cell cycle, wherein the growth and each individual cell in a population is simulated in parallel. The central algorithm describing this model is summarized in Figure 2. The advantage of performing population simulations using this method is 2-fold. First, biological noise can be accurately captured in a predictive and mechanistically meaningful manner. Second, we can examine the dynamics of individual cells in a population to elucidate their role in the overall dynamics of a population, which facilitates both model development and utilization. As described above, the overall goal of our modeling framework is to take an experimentally measured growth curve (OD vs time) as an input and predict the dynamics and distributions in genomic DNA content over time; therefore, we explicitly do not attempt topredictgrowth as a function of any experimental parameter.
[image:4.625.137.483.64.250.2]After calculating the volume injection rate, each individual cell of our agent-based simulation otherwise follows the standard CH model, including the following key steps: (1) When the volume of a cell reaches the critical initiation volume (Vi), alloriCin that cell are deemed competent for replication initiation (or “open”); (2) Replication at each oriC is stochastically initiated to represent asynchronicity between independent chromosomes as well as overlapping rounds of replication events on a single chromosome; (3) When the C period“timer”elapses for any replication event in a cell, the D period segregation“timer”starts; (4) When the D period timer elapses, the cell splits into two daughter cells, with each partially or completely replicated chromosome being randomly assigned to one daughter or the other in a symmetrical fashion. At the time of cell division, new cell cycle parameters (C and D timers) are assigned to each daughter cell and Gaussian noise is
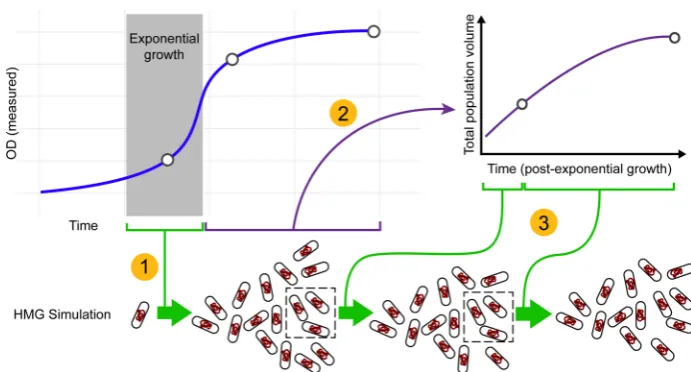
Figure 1.Injection-based strategy for connecting the HMG simulator to empirical growth data. This cartoon summarizes the process by which
empirical growth data (e.g., a measured OD vs time curve) is used to“drive”the HMG simulator via the volume injection method, where the open
circles represent the sections of the growth curve where DNA distributions were measured. Thus, in this illustration, the simulation would contain three independent steps: (1) The region of exponential growth is identified. This exponential growth rate is used to drive the HMG simulation from a single cell inoculate to a diversified population of exponentially growing cells; (2) During postexponential growth, the OD curve is used to calculate
the rate at which the overall cell volume (of the population) is increasing (seeSupporting Informationsection I.2.3); (3) At each time point, the
calculated rate of volumetric change (per cell) is“injected”into each cell in the population, each of which advances its cell state via the HMG
algorithm outlined in Figure 1. The dashed rectangles indicate that during each time step of the simulation, a random subset of 5000 cells is taken
forward into the subsequent time step of the simulation in order to keep simulations computationally tractable (seeSupporting Informationsection
I.2.3 for additional discussion).
applied (as illustrated by the gray boxes in Figure 1). To validate our injection model framework, we fed previously reported C and D parameters associated with a particular growth rate into our HMG simulation and confirmed that the DNA distribution predicted under conditions of exponential growth matched those generated by a validated Monte Carlo simulation of the canonical CH model38(Figure S1).
Our HMG simulator also captures the fact that many laboratory bacterial strains contain a mutant version of therecA
gene (recA1) which has greatly reduced DNA-dependent ATPase activity,39which is the case for the strain used in this study (TOP10). As critical mass is reached, alloriCloci in the cell open simultaneously, such that in a WT population of cells, the vast majority of individual cells contain 1, 2, 4, 8, ···(i.e., 2n) chromosome copies per cell.25Populations ofrecA1cells, on the other hand, contain individuals with whole numbers (1, 2, 3, 4, etc.) of chromosome copies per cell.40 Our current understanding is that this phenomenon likely stems from a dysfunctional DNA repair mechanism,40−42although the exact mechanisms by which the lack of functional RecA impacts the replication and repair mechanism is still the subject of intensive research43(see extended discussion inSupporting Information section I.3.2). Therefore, we decided to capture the impacts of RecA deficiency by including only high-level consequences that
are generally believed to lead to the observed aberrant chromosome copy number phenotype: in our simulation, when DNA damage occurs in RecA-deficient cells, the inability to repair this damage by homologous recombination results, stochastically, in degradation of either the replicating strand or the entire replicating chromosome (Figure S6). Although there is no direct evidence that recA mutation-associated DNA degradation varies with growth rate,40,44there is evidence that mutantrecAphenotypes are exacerbated by faster growth rates, so a reasonable explanation is that faster growth leads to more replications forks, and therefore more stalled replication forks, and therefore more instances in which lack of RecA leads to DNA degradation.45
[image:5.625.109.521.70.399.2]Parameter Optimization Allows Matching of the HMG Simulator to Measured DNA Distributions from Shake Flask Experiments. We next developed a strategy for calibrating our HMG simulator to experimentally generated growth curves that include both exponential and postexponen-tial growth phases. When considering exponenpostexponen-tial growth under various conditions, the times for replication (C period) and segregation (D period) are highly correlated with growth rate.29,38Overall, as the growth rate decreases, both C and D periods increase from some minimal value, and these
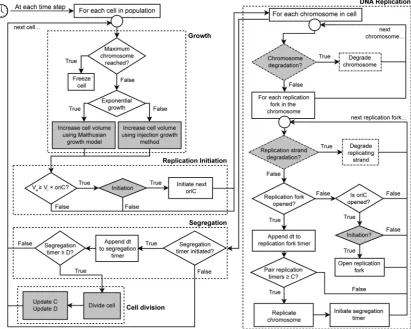
Figure 2.Heterogeneous multiphasic growth (HMG) simulation algorithm. Thisfigure summarizes the algorithms used to advance our agent-based
simulation of bacterial growth. As described in the text and elaborated inSupporting Informationsection I.2.3, this algorithm marries our“injection”
model for driving growth based upon experimentally measured growth curves with either the original CH model of bacterial replication (ignoring the
dashed boxes) or an extended version of the CH model which incorporates the effects of recA mutation (including the dashed boxes). In each time
step of the simulation, each cell is advanced through thefive indicated processes: (1) growth, (2) opening of origin(s) of replication, (3) DNA
replication and DNA degradation, (4) segregation, and (5) cell division. Gray boxes indicate the steps in the algorithm where noise is applied to the
cell cycle (seeSupporting Informationsection I.4) (C, replication timer; D, segregation time; Vi, critical mass; dt, time step; Va, current cell mass;
OriC, origin of replication).
ACS Synthetic Biology Research Article
DOI:10.1021/acssynbio.5b00217
relationships are relatively well-described by simple empirical functions (seeSupporting InformationFigure S8).
To evaluate our HMG simulator against experimentally measured DNA distributions, wefirst measured DNA content across multiple phases and conditions of growth using the type of shakeflask cultures typically used for routine characterization of engineered strains (Figures 3 and 4). As a base case implementation of our HMG simulator, we calculated C and D parameters using functions based upon analyzing exponential growth,1and in this base case, we omitted any description of
recA-related defects (Figure 2)29,38 (see HMG simulator descriptions from ref38 in the captions for Figures 3 and 4 andSupporting InformationFigure S3). As expected, this base-case simulation produced relatively close matches to the experimental data during exponential growth and early stages of the transition to the stationary phase (Figures 3 and 4). However, as the population departs further from exponential growth and approaches a stationary phase, these predictions become increasingly inaccurate.
To improve upon these predictions for postexponential growth, we next attempted to improve the HMG simulator in several ways. First, we incorporated the simplified description ofrecA-associated DNA degradation (seeSupporting Informa-tion section I.3). Next, we attempted to optimize both parameters associated with this DNA degradation as well as
parameters for the functions relating C and D periods to growth rate. To this end, we utilized a genetic algorithm (GA) to fit simulation parameters to one subset of our data− experimentally measured DNA distributions for TOP10 cells grown in LB at two different shake rates (230 and 23 rpm) (Figure 3). This updated and optimized HMG simulation exhibited a 26.72% and 37.7% improvement in accuracy for predicting measured DNA distributions for the 230 and 23 rpm cases, respectively, as quantified by a similarity score (see Supporting Information section I.5.1; lower scores denote a closerfit to the data).
[image:6.625.63.561.64.358.2]We next investigated whether the updated and optimized HMG simulator could also predict genomic DNA dynamics for cells grown under conditions not included in the training data (i.e., as model validation), and to this end we examined cells grown in M9 medium. As shown inFigure 4, the updated and optimized HMG simulator generates excellentfits during both exponential and postexponential growth, and the optimized parameters provide a significantly better prediction of the experimental data than was achieved using standard parameters from the literature (increases in accuracy were 40.34% and 49.15% for cells shaken at 230 and 23 rpm, respectively, as measured by a similarity score). This improvement in performance is also readily visualized, qualitatively, by comparing histograms corresponding to the data presented as
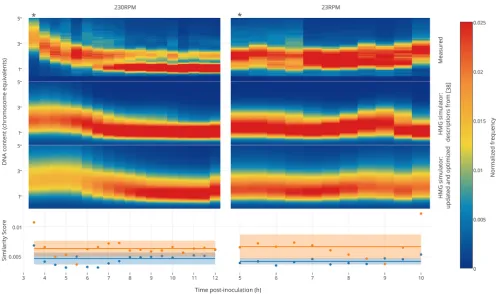
Figure 3.Training of the HMG simulator framework. The HMG simulator was“fed”growth curves for TOP10 cells grown in LB, shaken at 230 or
23 rpm (Figure S4), and simulated DNA distributions were compared with those which were measured empirically. The measured DNA
distributions shown here each represent a single experiment, each of which is representative of two or more independent experiments. Thefirst
column within each heat map represents the exponential growth phase (indicated by the asterisk (∗)), and all subsequent time points represent
postexponential growth. The simulator was run using two different models: the first model was based upon a prior description of exponential
growth,38 which omits any consequences of recA mutation, and the second (updated and optimized) model incorporated our description of the
consequences of recA mutation with parametric optimization (see main text). Similarity scores indicate the degree to which each prediction matches
the observed DNA distribution, using a scoring function described in theSupporting Informationsection I.5.1 (lower scores represent betterfits).
The solid lines on the two bottom panels represent the mean similarity score across the time course, and the shaded boxes represent the standard
deviation of these scores across the time course. Histograms corresponding to the heat maps shown here are presented inFigures S9(LB 230 rpm)
andS10(LB 23 rpm).
heat maps inFigures 3and4, (Figures S9, S10, S11, and S12), which clearly indicate the points at which the pure CH model, run under the HMG simulator, breaks down.
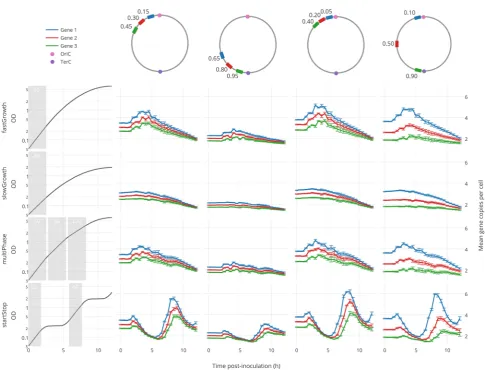
The HMG Simulator Can Guide Construct Design and Evaluation.To illustrate the potential usefulness of our model as a design tool, we considered a scenario in which the designer wishes to insert three novel genes into theE. coligenome, and the HMG simulator is used to predict how insertion position impacts gene dosage dynamics across various growth conditions. For example, if these genes encoded three enzymes, then such dynamics could substantially impact the relative concentration of these enzymes relative to both one another and to endogenous enzymes and other gene products. To this end, we generated theoretical growth curves representing different biologically realistic growth dynamics, and we used the optimized HMG simulator to predict gene dosage dynamics (Figure 5). The scenarios considered could represent fast and slow growth, growth on heterogeneous substrates (e.g, multiphase growth), and discontinuous growth conditions such as might be observed during metabolic adaptation (e.g., start−stop). As expected, genes located closer tooriC exhibit greater variation in mean copy number than do those distal from oriC, since genes located closer to oriC are present at higher copy numbers overall. While the simple fast and slow growth conditions both exhibit straightforward dynamics
gene dosage decreases with decreasing growth rate and approaches 1 at the stationary phasethe ratio between gene copy numbers (both during and after exponential growth) varies substantially as a function of genomic integration locations. Moreover, during multiphase growth, which is observed during most typical characterization experiments, gene dosage (and relative gene dosage) varies substantially between the two time frames corresponding to distinct rates of exponential growth (0−200 min and 200−400 min). Finally, the start−stop growth conditions result in dramatic spikes in gene dosage as simulated cultures exited intermediate“pauses” to resume rapid growth.
[image:7.625.65.559.63.356.2]Each of these examples suggests strategies by which a synthetic biology practitioner might make use of the HMG simulator. As a hypothesis generation tool, the HMG simulator may be used to evaluate whether gene dosage may plausibly explain why an engineered function or pathway behaves differently under different growth regimes. Conversely, the HMG simulator may be used to design experiments to probe how gene dosage impacts the performance of a particular function. Ultimately, the HMG simulator may be paired with other design tools to facilitate the design of novel functions that operate in a desirable fashion over a range of growth conditions.
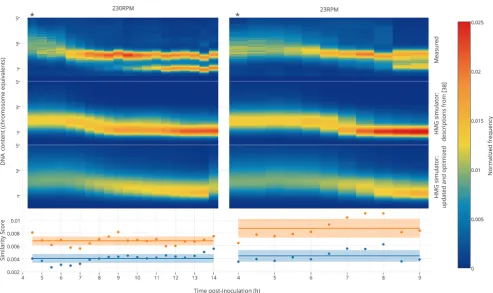
Figure 4.Validation of the HMG simulator framework. The HMG simulator was“fed”growth curves for TOP10 cells grown in M9, shaken at 230
or 23 rpm (Figure S4), and simulated DNA distributions were compared with those which were measured empirically. The measured DNA
distributions shown here each represent a single experiment, each of which is representative of two or more independent experiments. Thefirst
column within each heat map represents the exponential growth phase (indicated by an asterisk (∗)), and all subsequent time points represent
postexponential growth. The simulator was run using two different models: the first model was based upon a prior description of exponential
growth,38 which omits any consequences of recA mutation, and the second (updated and optimized) model incorporated our description of the
consequences of recA mutation with parameters optimized based upon growth in LB (i.e., using the same updated and optimized model described in
Figure 3). Similarity scores indicate the degree to which each prediction matches the observed DNA distribution, using a scoring function described
in theSupporting Information section I.5.1 (lower scores represent betterfits). The solid lines on the two bottom panels represent the mean
similarity score across the time course, and the shaded boxes represent the standard deviation of these scores across the time course. Histograms
corresponding to the heat maps shown here are presented inFigures S11(M9 230 rpm) andS12(M9 23 rpm).
ACS Synthetic Biology Research Article
DOI:10.1021/acssynbio.5b00217
■
CONCLUSIONSThis investigation developed and validated a novel modeling approach to meet the need for synthetic biologists to be able to predict and evaluate the impact of genomic (and gene locus) copy number variation across a population of bacterial cells and across variable growth regimes. The results reported here have validated the overall HMG simulation strategy, and the injection growth model upon which it is based. Although we observed that a single calibrated version of the HMG simulator could make accurate predictions across a range of conditions, some conditions resulted in lower prediction accuracy for reasons that are not yet clear. Thus, further investigations are required to determine the extent to which any set of model calibrations enables predictions across genotypes, growth conditions, and other perturbations such as plasmid and transgene load. Ultimately, we expect that the HMG simulator will provide a powerful tool for the evaluation and design of synthetic microbial functions that perform robustly across a range of growth conditions (all software is freely available from the authors upon request).
■
MATERIALS AND METHODSCulture Conditions and Strains. Cells were grown in Lysogeny Broth (LB) Lennox formulation (10 g/L of tryptone, 5 g/L of yeast extract, 5 g/L of NaCl) or supplemented M9 (M9 minimal medium with 0.4% glycerol, 0.2% casamino acids, and 1 mM thiamine hydrochloride) as specified, and all cultures were run at 37 °C. Streptomycin was used at a final concentration of 50μg/mL. All experiments were conducted using the commercially available TOP10 strain (F- mcrA Δ (mrr-hsdRMS-mcrBC) φ r-hsdRMS- Δ r-hsd nupG recA1 araD139Δ(ara-leu)7697 galE15 galK16 rpsL(StrR) endA1λ-) (Invitrogen).
[image:8.625.69.555.60.430.2]Growth Assays.For shake-flask cultures, cells were grown overnight with appropriate levels of streptomycin. Cells were then diluted 50×into 100 mL of growth medium in a 250 mL Erlenmyer flask and placed in a shaking incubator, shaken at speeds indicated. Samples were collected every 30 min postdilution to determine the optical density at 600 nm (hereafter, simply OD) and for quantification of genomic distributions byflow cytometry.
Figure 5.HMG simulator-based prediction of gene dosage effects. The updated and optimized HMG simulator was used as a testbed to predict gene dosage dynamics over a range of hypothetical growth curves (left column). Here we track three genomic loci (blue, red, and green rectangles),
located at various positions relative tooriC(pink circle). Numbers accompanying the chromosome maps in the top row indicate the relative distance
of each locus fromoriC, in each scenario, on a scale where 1.0 is completely distal (e.g., the primary Ter site, teal rectangle). Each predicted trajectory
represents the mean copy number of each locus per cell, averaged over 100 independent simulations, with error bars representing one standard deviation. For each hypothetical growth curve (left column), each shaded area is labeled with the doubling rate calculated for that window of growth.
Each simulation was inoculated (initiated) under conditions of exponential growth, using the doubling rate calculated for thefirst indicated period of
exponential growth (gray shading), and thereafter simulations proceeded using the injection method through the remainder of the growth curves.
DNA Content Analysis. For examination by flow cytometry, cells were initially diluted into 200μL of ice-chilled PBS, and then 800 μL ice-chilled ethanol was added to this solution. The solution was gently shaken and then pelleted by centrifugation for 5 min at 1000g. Ethanol solution was discarded,and cells were resuspended in 500μL of ice-chilled PBS, a second such centrifugation was applied, and cells were resuspended in 500μL of ice-chilled PBS containing 0.1μg/mL DAPI (Thermo Fisher). Fixed and stained cells were stored at 4
°C (no more than 24 h) until analysis byflow cytometry using an LSR II (BD). Data were analyzed using FlowJo software (Treestar); a minimum of 2000 individual cells (typically out of ∼25 000 events) was analyzed per sample.
Simulations and Optimization Tools. The model was written in ANSI C, wrapped with python3. To optimize the growth parameters we used the python DEAP (Distributed Evolutionary Algorithms in Python) evolutionary computa-tional framework.46 The AeMuLambda algorithm, with a Gaussian mutation function (mu = 0.0, sigma = 0.005, probability = 0.75) was used on a Linux Ubuntu (64bit) 24-core Intel(R) Xeon(R) CPU E5-2620 v2 @ 2.10 GHz, 250GB RAM. The SOBOL quasirandom sequence was generated using the python Sensitivity Analysis Library (SALib). B-Spline fit was made using the Wave Analysis for Fatigue and Ocean-ography (WAFO) python package library. Noise convolution and nonlinear regression was performed using the Scipy toolbox in python. Sum of Gaussian fit for deconvolution of DNA distributions was performed using the MATLAB interactive peakfitting program (ipf11) script.
■
ASSOCIATED CONTENT*
S Supporting InformationThe Supporting Information is available free of charge on the ACS Publications websiteat DOI:10.1021/acssynbio.5b00217. Supplemental figures, model development and methods (PDF)
■
AUTHOR INFORMATION Corresponding Authors*E-mail: [email protected].
*E-mail: [email protected].
Author Contributions
∇M.L. and A.S. contributed equally to this work. D.B. and J.L.
conceived the study. A.S. and A.Y. conducted experiments. M.d.L. wrote and developed the computational simulations. M.d.L., A.S., D.B., and J.L. designed the experiments and analyzed the data. M.L., A.S., D.B., and J.L. wrote the manuscript.
Notes
The authors declare no competingfinancial interest.
■
ACKNOWLEDGMENTSThis work was supported by the National Science Foundation, Awards PHY-0943390 and MCB-1341414, by the National Academies Keck Futures Initiative (NAKFI-SB6), by the UK Engineering and Physical Sciences Research Council (Grants EP/H019154/1 and EP/K034359/1) and by the UK Biotechnology and Biological Sciences Research Council (Grant BB/K003240/1). This work was supported by the Northwestern University Flow Cytometry Facility and a Cancer Center Support Grant (NCI CA060553). The flask from the abstract image was a modifed form of Erlenmayer_shape.svg
posted to wikimedia.org by Danilo Prudencio Silva under the Creative Commons Attribution-Share Alike 3.0 Unported l i c e n s e (h t t p s : / / c o m m o n s . w i k i m e d i a . o r g / w i k i / File:Erlenmayer_shape.svg).
■
ABBREVIATIONSCH, Cooper and Helmstetter (model of the cell cycle); DEAP, Distributed Evolutionary Algorithms in Python; Expo Param, parametric relationships used in our HMG simulator based upon published experiments conducted during exponential growth; GA, genetic algorithm; HMG, Heterogeneous Multi-phasic Growth (model); LB, lysogeny broth; OD, optical density at 600 nm; Opti Param, parametric relationships used in our HMG simulator based upon optimizations performed in this study; PDF, probability density function
■
REFERENCES(1) Cho, C., Choi, S. Y., Luo, Z. W., and Lee, S. Y. (2015) Recent advances in microbial production of fuels and chemicals using tools
and strategies of systems metabolic engineering.Biotechnol. Adv. 33,
1455−1466.
(2) Santos, C. N. S., Regitsky, D. D., and Yoshikuni, Y. (2013) Implementation of stable and complex biological systems through
recombinase-assisted genome engineering. Nat. Commun. 4, 2503
DOI: 10.1038/ncomms3503.
(3) Moser, F., Broers, N. J., Hartmans, S., Tamsir, A., Kerkman, R., Roubos, J. A., Bovenberg, R., and Voigt, C. A. (2012) Genetic circuit
performance under conditions relevant for industrial bioreactors.ACS
Synth. Biol. 1, 555−564.
(4) Wang, H. H., Kim, H., Cong, L., Jeong, J., Bang, D., and Church, G. M. (2012) Genome-scale promoter engineering by coselection
MAGE.Nat. Methods 9, 591−593.
(5) Tyo, K. E., Ajikumar, P. K., and Stephanopoulos, G. (2009) Stabilized gene duplication enables long-term selection-free
heterolo-gous pathway expression.Nat. Biotechnol. 27, 760−765.
(6) Akerlund, T., Nordstrom, K., and Bernander, R. (1995) Analysis of cell size and DNA content in exponentially growing and
stationary-phase batch cultures of Escherichia coli.J. Bacteriol. 177, 6791−6797.
(7) Hill, N. S., Kadoya, R., Chattoraj, D. K., and Levin, P. A. (2012)
Cell size and the initiation of DNA replication in bacteria.PLoS Genet.
8, e1002549.
(8) Skarstad, K., and Katayama, T. (2013) Regulating DNA
replication in bacteria.Cold Spring Harbor Perspect. Biol. 5, a012922.
(9) Gonze, D. (2013) Modeling the effect of cell division on genetic
oscillators.J. Theor. Biol. 325, 22−33.
(10) Jin, D. J., Cagliero, C., and Zhou, Y. N. (2012) Growth rate
regulation in Escherichia coli.FEMS microbiology reviews 36, 269−287.
(11) Klumpp, S., Zhang, Z., and Hwa, T. (2009) Growth
rate-dependent global effects on gene expression in bacteria. Cell 139,
1366−1375.
(12) Messer, W. (2002) The bacterial replication initiator DnaA.
DnaA and oriC, the bacterial mode to initiate DNA replication.FEMS
Microbiol Rev. 26, 355−374.
(13) Atlung, T., and Hansen, F. G. (1999) Low-Temperature-Induced DnaA Protein Synthesis Does Not Change Initiation Mass in
Escherichia coliK-12.J. Bacteriol. 181, 5557−5562.
(14) Skarstad, K., Boye, E., and Steen, H. B. (1986) Timing of initiation of chromosome replication in individual Escherichia coli
cells.EMBO J. 5, 1711−1717.
(15) Kurokawa, K., Nishida, S., Emoto, A., Sekimizu, K., and Katayama, T. (1999) Replication cycle-coordinated change of the adenine nucleotide-bound forms of DnaA protein in Escherichia coli.
EMBO J. 18, 6642−6652.
(16) Kamada, K., Horiuchi, T., Ohsumi, K., Shimamoto, N., and Morikawa, K. (1996) Structure of a replication-terminator protein
complexed with DNA.Nature 383, 598.
ACS Synthetic Biology Research Article
DOI:10.1021/acssynbio.5b00217
(17) Mulcair, M. D., Schaeffer, P. M., Oakley, A. J., Cross, H. F., Neylon, C., Hill, T. M., and Dixon, N. E. (2006) A molecular mousetrap determines polarity of termination of DNA replication in E.
coli.Cell 125, 1309−1319.
(18) Robert, L. (2015) Size sensors in bacteria, cell cycle control, and
size control.Front. Microbiol. 6, 515.
(19) Osella, M., and Lagomarsino, M. C. (2013)
Growth-rate-dependent dynamics of a bacterial genetic oscillator.Phys. Rev. E Stat
Nonlin Soft Matter Phys. 87, 012726.
(20) Buddelmeijer, N., and Beckwith, J. (2002) Assembly of cell
division proteins at the E. coli cell center. Curr. Opin. Microbiol. 5,
553−557.
(21) Natale, P., Pazos, M., and Vicente, M. (2013) The Escherichia
coli divisome: born to divide.Environ. Microbiol. 15, 3169−3182.
(22) Stouf, M., Meile, J.-C., and Cornet, F. (2013) FtsK actively
segregates sister chromosomes in Escherichia coli.Proc. Natl. Acad. Sci.
U. S. A. 110, 11157−11162.
(23) Helmstetter, C. E., and Cooper, S. (1968) DNA synthesis
during the division cycle of rapidly growing Escherichia coliBr.J. Mol.
Biol. 31, 507−518.
(24) Bremer, H., and Dennis, P. P. (2008) Modulation of chemical composition and other parameters of the cell at different exponential
growth rates.EcoSal Plus 3, No. 10.1128/ecosal.5.2.3,DOI: 10.1128/
ecosal.5.2.3.
(25) Abner, K., Aaviksaar, T., Adamberg, K., and Vilu, R. (2014)
Single-cell model of prokaryotic cell cycle.J. Theor. Biol. 341, 78−87.
(26) Powell, E. O. (1958) An outline of the pattern of bacterial
generation times.J. Gen. Microbiol. 18, 382−417.
(27) Skarstad, K., Steen, H. B., and Boye, E. (1985) Escherichia coli DNA distributions measured by flow cytometry and compared with
theoretical computer simulations.J. Bacteriol. 163, 661−668.
(28) Stokke, C., Flatten, I., and Skarstad, K. (2012) An easy-to-use simulation program demonstrates variations in bacterial cell cycle
parameters depending on medium and temperature. PLoS One 7,
e30981.
(29) Michelsen, O., Teixeira de Mattos, M. J., Jensen, P. R., and Hansen, F. G. (2003) Precise determinations of C and D periods by
flow cytometry in Escherichia coli K-12 and B/r. Microbiology 149,
1001−1010.
(30) Lopez, S., Prieto, M., Dijkstra, J., Dhanoa, M. S., and France, J. (2004) Statistical evaluation of mathematical models for microbial
growth.Int. J. Food Microbiol. 96, 289−300.
(31) Turner, M. E., Bradley, E. L., Kirk, K. A., and Pruitt, K. M.
(1976) A theory of growth.Math. Biosci. 29, 367−373.
(32) Pruitt, K. M., and Kamau, D. N. (1993) Mathematical models of bacterial growth, inhibition and death under combined stress
conditions.J. Ind. Microbiol. 12, 221−231.
(33) Ferenci, T. (1999)’Growth of bacterial cultures’50 years on:
towards an uncertainty principle instead of constants in bacterial
growth kinetics.Res. Microbiol. 150, 431−438.
(34) Bren, A., Hart, Y., Dekel, E., Koster, D., and Alon, U. (2013)
The last generation of bacterial growth in limiting nutrient.BMC Syst.
Biol. 7, 27.
(35) Monod, J. (1949) The growth of bacterial cultures.Annu. Rev.
Microbiol. 3, 371−394.
(36) Buchanan, R. L., Whiting, R., and Damert, W. (1997) When is simple good enough: a comparison of the Gompertz, Baranyi, and
three-phase linear models for fitting bacterial growth curves. Food
Microbiol. 14, 313−326.
(37) Zwietering, M. H., Jongenburger, I., Rombouts, F. M., and van’t
Riet, K. (1990) Modeling of the bacterial growth curve.Appl. Environ.
Microbiol. 56, 1875−1881.
(38) Keasling, J. D., Kuo, H., and Vahanian, G. (1995) A Monte
Carlo simulation of the Escherichia coli cell cycle.J. Theor. Biol. 176,
411−430.
(39) Bryant, F. R. (1988) Construction of a recombinase-deficient mutant recA protein that retains single-stranded DNA-dependent
ATPase activity.J. Biol. Chem. 263, 8716−8723.
(40) Skarstad, K., and Boye, E. (1993) Degradation of individual
chromosomes in recA mutants of Escherichia coli. J. Bacteriol. 175,
5505−5509.
(41) Khan, S. R., and Kuzminov, A. (2012) Replication forks stalled at ultraviolet lesions are rescued via RecA and RuvABC
protein-catalyzed disintegration in Escherichia coli.J. Biol. Chem. 287, 6250−
6265.
(42) Kuzminov, A., and Stahl, F. W. (1997) Stability of linear DNA in recA mutant Escherichia coli cells reflects ongoing chromosomal DNA
degradation.J. Bacteriol. 179, 880−888.
(43) Kouzminova, E. A., Rotman, E., Macomber, L., Zhang, J., and Kuzminov, A. (2004) RecA-dependent mutants in Escherichia coli
reveal strategies to avoid chromosomal fragmentation.Proc. Natl. Acad.
Sci. U. S. A. 101, 16262−16267.
(44) Courcelle, J., and Hanawalt, P. C. (2003) RecA-dependent
recovery of arrested DNA replication forks.Annu. Rev. Genet. 37, 611−
646.
(45) Horii, Z. I., and Suzuki, K. (1968) Degradation of the DNA of Escherichia Coli K12 Rec-(JC1569b) after irradiation with ultraviolet
light.Photochem. Photobiol. 8, 93−105.
(46) Fortin, F.-A., Rainville, F.-M. D., Gardner, M.-A., Parizeau, M.,
and Gagne, C. (2012) DEAP: Evolutionary algorithms made easy.́ J.
Mach. Learn. Res. 13, 2171−2175.