arXiv:1705.03503v1 [astro-ph.GA] 9 May 2017
AN ALMA SURVEY OF SUBMILLIMETRE GALAXIES IN THE EXTENDEDCHANDRADEEP FIELD SOUTH: SPECTROSCOPIC REDSHIFTS
A. L. R. Danielson,1A. M. Swinbank,1,2,*Ian Smail,1,2J. M. Simpson,1C. M. Casey,3,4 S. C. Chapman,5E. da Cunha,6
J. A. Hodge,7F. Walter,8 J. L. Wardlow,1 D. M. Alexander,1 W. N. Brandt,9C. de Breuck,10 K. E. K. Coppin11 H. Dannerbauer,12M. Dickinson,13 A. C. Edge,1E. Gawiser,14R. J. Ivison,10A. Karim,17 A. Kovacs,15 D. Lutz,16
K. Menten,17 E. Schinnerer,7 A. Weiß,17 P. van der Werf,7 Draft version May 11, 2017
ABSTRACT
We present spectroscopic redshifts of S870µm >∼2 mJy submillimetre galaxies (SMGs) which have
been identified from the ALMA follow-up observations of 870-µm detected sources in the Extended ChandraDeep Field South (the ALMA-LESS survey). We derive spectroscopic redshifts for 52 SMGs, with a median of z= 2.4±0.1. However, the distribution features a high redshift tail, with ∼23% of the SMGs at z ≥3. Spectral diagnostics suggest that the SMGs are young starbursts, and the velocity offsets between the nebular emission and UV ISM absorption lines suggest that many are driving winds, with velocity offsets up to 2000 km s−1. Using the spectroscopic redshifts and the extensive UV-to-radio photometry in this field, we produce optimised spectral energy distributions (SEDs) usingMagphys, and use the SEDs to infer a median stellar mass ofM⋆= (6±1)×1010M
⊙
for our SMGs with spectroscopic redshift. By combining these stellar masses with the star-formation rates (measured from the far-infrared SEDs), we show that SMGs (on average) lie a factor∼5 above the so-called “main-sequence” atz ∼2. We provide this library of 52 template fits with robust and uniquely well-sampled SEDs available as a resource for future studies of SMGs, and also release the spectroscopic catalog of∼2000 (mostly infrared-selected) galaxies targeted as part of the spectroscopic campaign.
Subject headings: galaxies: starburst, submillimetre: galaxies
1. INTRODUCTION
1Centre for Extragalactic Astronomy, Durham University,
Department of Physics, South Road, Durham DH1 3LE, UK
2Institute for Computational Cosmology, Durham University,
South Road, Durham DH1 3LE, UK
*Email: a.m.swinbank@durham.ac.uk
3Department of Astronomy, The University of Texas at
Austin, 2515 Speedway Boulevard Stop C1400, Austin, TX 78712, USA
4Department of Physics and Astronomy, University of
California, Irvine, Irvine, CA 92697, USA
5Department of Physics and Atmospheric Science, Dalhousie
University, Halifax, NS B3H 4R2, Canada
6Research School of Astronomy and Astrophysics, Australian
National University, Canberra, ACT 2611, Australia
7Leiden Observatory, Leiden University, P.O. Box 9513, 2300
RA Leiden, The Netherlands 0000-0001-5434-5942
8Max-Planck-Institut f¨ur Astronomie, K¨onigstuhl 17,
D-69117 Heidelberg, Germany
9Department of Astronomy and Astrophysics and the
Insti-tute for Gravitation and the Cosmos, The Pennsylvania State University
10European Southern Observatory, Karl Schwarzschild Straße
2, 85748, Garching, Germany
11Centre for Astrophysics Research, Science and Technology
Research Institute, University of Hertfordshire, College Lane, Hatfield AL10 9AB, UK
12Universit¨at Wien, Institut f¨ur Astrophysik,
T¨urkenschanzstraße 17, 1180, Wien, Austria
13National Optical Astronomy Observatory, Tucson, AZ
85719, USA
14Department of Physics and Astronomy, Rutgers University,
Piscataway, NJ 08854-8019, USA
15Astronomy Department, University of Minnesota, MN
12345, USA
16Max-Planck-Institut f¨ur extraterrestrische Physik,
Giessen-bachstraße, 85748, Garching, Germany
17Max-Planck-Institut f¨ur Radioastronomie, Auf dem H¨ugel
69, D-53121 Bonn, Germany
Submillimeter galaxies (SMGs) with 850µm fluxes of S850 >1 mJy represent a population of dusty star-bursts whose space density peaked ∼10 Gyr ago. Al-though they are relatively rare, their far-infrared lumi-nosities (LIR >2×10¹²L⊙) imply high star-formation
rates (>∼300 M⊙yr−1) and so SMGs appear to con-tribute at least 20% of the total cosmic star-formation rate density over z= 1–4 (e.g. Chapman et al. 2005; Barger et al. 2012; Casey et al. 2014; Swinbank et al. 2014). If they can maintain their star-formation rates, SMGs also have the potential to consume all their cold gas reservoir within just 100 Myr (e.g. Tacconi et al. 2008; Bothwell et al. 2013), and so double their stel-lar masses within their short but intense lifetime (e.g. Hainline et al. 2009; Magnelli et al. 2012). Their abil-ity to form up to 1011M
⊙ of stars within a short
period of time makes them candidates of progenitors of z= 1–2 compact quiescent galaxies (Toft et al. 2014; Simpson et al. 2015a; Ikarashi et al. 2015) as well as lo-cal massive elliptilo-cals (e.g. Lilly et al. 1999; Genzel et al. 2003; Simpson et al. 2014). These characteristics sug-gest that bright SMGs represent an essential popula-tion for models of galaxy formapopula-tion and evolupopula-tion (e.g. Efstathiou & Rowan-Robinson 2003; Baugh et al. 2005; Swinbank et al. 2008; Narayanan et al. 2009; Dav´e et al. 2010; Hayward et al. 2011; Lacey et al. 2015).
millimetre wavelengths and indeed, above z ∼3.5, the 1.4 GHz flux of a galaxy with a star-formation rate of
∼100 M⊙yr−1 falls below ∼15µJy and so below the
typical sensitivity limit of deep radio surveys. This has the potential to bias the redshift distribution to z <∼3.5, especially if a significant fraction of submil-limetre sources do not have multi-wavelength counter-parts. Indeed, in single-dish 850µm surveys, up to 50% of all submillimetre sources are undetected at radio wave-lengths (e.g. Ivison et al. 2005, 2007; Biggs et al. 2011). Some progress can be made by targeting lensed sources whose multi-wavelength identifications are less ambigu-ous, and indeed spectroscopic redshifts have been derived for SMGs up toz∼5 (e.g. Weiß et al. 2013).
Due to the angular resolution and sensitivity of the ALMA interferometer, it has become possible to iden-tify the counterparts of submillimetre sources to <∼0.3′′
accuracy without recourse to statistical asssociations at other wavelengths. To identify a sample of SMGs in a well studied field with a well defined selection function, Hodge et al. (2013) undertook an ALMA survey of 122 SMGs found in the ExtendedChandraDeep Field South (ECDFS): the “ALESS” survey. This survey followed up 122 of the 126 submillimetre sources originally de-tected with the LABOCA instrument on the Atacama Pathfinder Experiment 12 metre telescope (APEX); the LABOCA ECDFS Sub-mm Survey (LESS) (Weiß et al. 2009). Each LESS submillimetre source was targeted with ALMA at 870µm (Band 7). The typical FWHM of the ALMA synthesised beam was∼1.5′′(significantly
smaller than the LABOCA 19.2′′ beam), thus allowing
us to directly pinpoint the position of the SMG precisely. From these data, Karim et al. (2013) (see also Simpson et al. 2015b) showed that statistical identifi-cations (e.g. using radio counterparts) were incorrect in ∼30% of cases, whilst the single-dish submillimetre sources also suffer from significant “multiplicity”, with >35% of the single-dish sources resolved into multi-ple SMGs brighter than >∼1 mJy. This flux limit cor-responds approximately to a far-infrared luminosity of LFIR >∼1012L⊙ at z ∼2, and so it appears that a large
fraction of the single-dish submillimetre sources often contain two (or more) Ultra-Luminous Infrared Galaxies (ULIRGs). Consequently, a new ALESS SMG catalogue was defined comprising 131 SMGs (Hodge et al. 2013).
One of the primary goals of the ALESS survey is to provide an unbiased catalog of SMGs for which we can derive molecular gas masses, as well as measure spatially resolved dynamics of the gas and stars in order to iden-tify the trigering mechanisms that cause the burst of star formation. The first necessary step in this process is to
by redshift identification and sample properties in§3. In
§4 we show the ALESS redshift distribution and discuss the spectroscopic completeness. In § 5 we discuss the velocity offsets of various different spectral lines, search for evidence of stellar winds and galaxy-scale outflows and investigate the environments of SMGs and the in-dividual and composite spectral properties. We present our conclusions in §6. In the Appendix, we give the ta-ble of ALESS SMG redshifts and provide information on individual SMGs from the sample.
Unless otherwise stated the quoted errors on the me-dian values within this work are determined through bootstrap analysis and are quoted as the equivalent of 68.3% confidence limits. Throughout the paper we use a ΛCDM cosmology with H0= 72 km s−1Mpc−1, Ωm= 0.27 and ΩΛ= 1 - Ωm (Spergel et al. 2003) and a Chabrier initial mass function (IMF; Chabrier 2003). Unless otherwise noted, all magnitudes are on the AB system.
2. OBSERVATIONS AND REDUCTION
2.1. Sample definition
The 870µm LESS survey (Weiß et al. 2009) was under-taken using the LABOCA camera on APEX, covering an area of 0.5×0.5 degrees centered on the ECDFS. The to-tal exposure time for the survey was 310 hours, reaching a 1-σsensitivity ofσ870µm∼1.2 mJy beam−1with a beam of 19.2′′FWHM. In total, we identified 126 submillimetre
quan-titative difference to the statistics of the redshift distri-bution.
To search for spectroscopic redshifts, we initiated an observing campaign using the the FOcal Reducer and low dispersion Spectrograph (FORS2) and VIsible Mul-tiObject Spectrograph (VIMOS) on VLT, but to sup-plement these observations, and in particular to in-crease the wavelength coverage and probability of de-termining redshifts, we also obtained observations with XSHOOTER on VLT, the Gemini Near-Infrared Spec-trograph (GNIRS) and the Multi-Object Spectrometer for Infra-Red Exploration (MOSFIRE) on the Keck i
telescope, all of which cover the near-infrared. As part of a spectroscopic campaign targeting Herschel-selected galaxies in the ECDFS, ALESS SMGs were included on DEep Imaging Multi-Object Spectrograph (DEIMOS) slit masks on Keckii(e.g. Casey et al. 2012). These ob-servations probe a similar wavelength range to FORS2 targeting some of the ALMA-identified SMGs that could not be targeted with VLT (due to slit collisions). In to-tal, we observed 109 out of the 131 ALESS SMGs in the combined main and supp samples. In many cases we have ALESS SMGs with spectra from five different spec-trographs covering a broad wavelength range and we can cross check the spectroscopic redshifts across all of the instruments. Next, we discuss the various instruments involved in our survey. We note that for all observations described below, flux calibration was carried out using standard stars to calibrate instrumental response.
2.2. VLT FORS2 / VIMOS
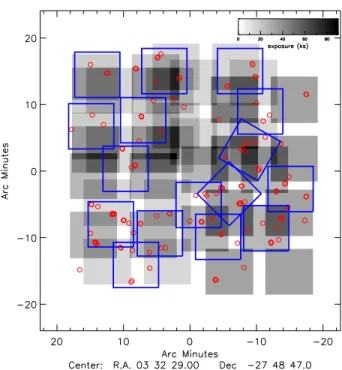
Our spectroscopic programme aimed to target as many of the ALESS SMGs as possible using a dual approach with FORS2 and VIMOS (for a typical SMG redshift of z ∼1–3, we are sensitive to Lyα and UV ISM lines with VIMOS or [Oii]λ3727 with FORS2). In total, we observed for 100 hours each with VIMOS and FORS as part of programme 183.A-0666. We used deep exposures on ten (overlapping) VIMOS masks to cover the field, plus deep integrations for sixteen FORS masks (which cover a sub-set of the field but target the regions with the highest density of ALMA SMGs; Fig. 1). All of the FORS observations were carried out in grey time and all of the VIMOS observations carried out in dark time during service mode runs with seeing ≤0.8′′ and clear
sky conditions (transparency variations below 10%). Our dual-instrument approach allowed us to probe a large wavelength range using VIMOS LR-Blue grism (4000– 6700˚A ) and FORS2 300I (6000–11000 AA ). When de-signing the slit masks, the first priority was always given to the SMGs, but we also infilled the masks with other mid- or far-infrared selected galaxies from the FIDEL Spitzer survey (Magnelli et al. 2009), the HerMES and PEP Herschel surveys of this field (Oliver et al. 2012; Lutz et al. 2011), S1.4GHz >30µJy radio sources and Chandra X-ray sources (Lehmer et al. 2005; Luo et al. 2008) or optical/near-infrared colour selected galaxies (see Table 3 and Fig. 15).
In Fig. 1 we show the spectroscopic coverage of the ECDFS from our FORS2 and VIMOS programmes, where the darkest areas demonstrate the areas with the longest total exposure time and the FORS2 pointings are overlaid. In total, we recorded 5221 galaxy spectra,
Fig. 1.—The coverage of our ten VIMOS pointings (greyscale) and 16 FORS2 pointings (blue boxes) in the ECDFS. The ALESS SMG positions are shown as small red circles. VIMOS has four quadrants separated by small gaps. There is significant overlap between the VIMOS pointings, we therefore show the pointings here with the darkest areas corresponding to the regions with the longest total exposure time. Our FORS2/VIMOS programme cov-ers 62 out of the 109 targeted SMGs in the ECDFS.
targeting 2454 (unique) galaxies.
2.2.1. FORS2
FORS2 covers the the wavelength range λ= 3300– 11000˚A and provides an image scale of 0.25′′pix−1in the standard readout mode (2×2 binning). FORS2 was used in its multi-object spectroscopy mode with exchangeable masks (MXU). We varied the slit length and orienta-tion for each target in order to observe the maximum number of sources on each mask (Fig. 1), but we con-sistently used a slit width of 1′′. We used ∼40–70 slits
per mask and the OG590 order-sorting filter with the 300I grism which results in a wavelength range covering 6000–11000˚A. The typical resolution in this configuration is R=λ/ ∆λ∼660. We used 16 pointings, although in a small number of cases, we moved slits between expo-sures if there were multiple sources within ∼5′′ which
could not be simultaneously observed on a mask. Each mask was observed in blocks of 3×900 s with each ex-posure nodded up and down the slits by ∼1.0′′ to aid
sky-subtraction and cosmic-ray removal when the im-ages were combined. Each mask was typically observed six times (with a range of three to nine times depend-ing on the number of SMGs on the mask and their me-dian brightness), resulting in an on-source exposure time 4.5 hrs (with a range of 2.25–6.75 hr).
wavelength-four quadrants each of a field-of-view of 7 ×8 with a detector pixel scale of 0.205′′pix−1. Each observing block comprised 3×1200 s exposures dithering ±1.0′′
along the slit. The exposure time per mask was 3–9 hr, again depending on the number of SMGs on the mask and their average brightness. Slit widths of 1.0′′ were
used, for which the typical resolution is R ∼180 and the dispersion is 5.3˚A pix−1 for the LR blue grism with the OS blue order sorting filter (∼4000–6700˚A). We used 40–160 slits per quadrant, totalling 160–400 slits over the four quadrants. The data were reduced using the standard ESOREX pipeline package for VIMOS. The frames were stacked in two-dimensions before extract-ing the one-dimensional spectra. In a number of cases, the data suffer from overlapping spectra which results in a second order overlapping the adjacent spectrum (this can be seen in the VIMOS two-dimensional spectrum of ALESS 057.1 in Fig. 2).
2.3. XSHOOTER
To improve the wavelength coverage of our observa-tions, we also obtained XSHOOTER observations of 20 ALESS SMGs. XSHOOTER simultaneously observes from UV to near-infrared wavelengths covering wave-length ranges of 3000–5600˚A, 5500–10200˚A and 10200– 24800˚A for the UV (UVB), visible (VIS) and near-infrared (NIR) arms respectively. Targets were priori-tised for XSHOOTER follow-up based on their K-band magnitudes. Our XSHOOTER observations were taken in visitor mode as part of programme 090.A-0927(A) from 2012 December 7–10 in dark time. We observed each source for ∼1 hr in generally clear conditions with a typical seeing of ∼1.0′′. Our observing strategy was
4×600 s exposures per source, nodding the source up and down the slit. The pixel scales were 0.16, 0.16 and 0.21′′pix−1for the UVB, VIS and NIR arms respectively. The slits were all 11′′long and 0.9′′wide for the VIS and
NIR arms and 1.0′′wide for the UVB arm. The typical
resolution was R ∼4350, 7450, 5300 for the UVB, VIS and NIR arms respectively. The data reduction was car-ried out using the standardesorexpipeline package for XSHOOTER.
2.4. MOSFIRE
We also targeted 36 ALESS SMGs with the MOSFIRE spectrograph on Keck i(2012B H251M, 2013B U039M, and 2013B N114M) in H- (1.46–1.81µm) and K-band (1.93–2.45µm). Observations were taken in clear or pho-tometric conditions with the seeing varying from 0.4– 0.9′′. In all cases we used slits of width 0.7′′. The pixel
1–1.3′′. We used a setup with the 600ZD (600 lines
mm−1) grating with a 7200˚A blaze angle and the GG455 blocking filter which resulted in a wavelength range of 4850–9550˚A. Slit widths of 0.75′′ were used and the
masks were filled with 40–70 slits per mask. The pixel scale of DEIMOS is 0.1185′′pix−1 and the typical reso-lution was R ∼3000. Individual exposures were 1200 s, and the total integration times were 2–3 hrs. The data were reduced using the DEEP2 DEIMOS data reduction pipeline (Cooper et al. 2012; Newman et al. 2013).
2.6. GNIRS
The Gemini Near-Infrared Spectrograph (GNIRS) was used to target eight ALESS SMGs as (programme GN-2012B-Q-90) between 2012 November 10–15 and De-cember 4–23. The targets were selected based on their K-band magnitude and whether they had a photomet-ric redshift that was predicted to place strong emission lines in the near-infrared. The instrument was used in cross-dispersing mode (via the SXD prism with 32 lines mm−1), using the short camera, with slit widths of 0.3′′, slit lengths of 7′′ and a pixel scale of 0.15′′pix−1. The wavelength coverage with this setup is 9000–25600˚A, typically with R ∼1700. Our observing strategy com-prised 200 s exposures and nodding up and down the slit by∼1′′. Each observing block comprised eight coadds of
three exposures, resulting in an exposure of ∼1.3 hr per source. The GNIRS data were reduced using the Gemini
irafpackage.
2.7. ALMA
Spectroscopic redshifts for two of our SMGs, ALESS 61.1 and ALESS 65.1 were determined from serendipitous detections of the [Cii]λ158µm line in the ALMA band (Swinbank et al. 2012). Although based on single line identifications, both redshifts have been con-firmed by the identification of12CO(1–0) emission using ATCA (Huynh et al. 2013; Huynh et al. 2017, submit-ted).
Once all of the data were collected from the different spectrographs, we collated the spectra for each ALESS SMG. The instruments used to observe each SMG are listed in Table 1.
3. ANALYSIS
3.1. Redshift identification
ALRD). Any emission / absorption features that were identified were fit with a Gaussian profiles to deter-mine their central wavelengths. In the FORS2, VI-MOS and DEIVI-MOS data the most commonly identified lines were Lyα, Civλλ1548.89,1550.77 ˚A, Ciiiλ1909 ˚A, Heiiλ1640 AA and [Oii]λλ3726.03,3728.82 ˚A. In the near-infrared, we typically detect Hα, Niiλ6583 and [Oiii]λλ4959, 5007 and in a small number of cases, Hβ (see Tables 2 & 3). The optical / near-infrared counter-parts of the SMGs are often faint and we detect con-tinuum in only ∼50% of the 52 SMGs for which we determine a redshift, (compared to∼75% for the radio-identified submillimetre sources in Chapman et al. 2005). The spectra often only contain weak continuum, emis-sion and / or absorption lines, making redshifts difficult to determine robustly. We therefore assign four quality flags to our spectroscopic data:
1. Q = 1 denotes a secure redshift where multi-ple features were identified from bright emis-sion / absorption lines;
2. Q = 2 denotes a redshift but derived from one or two bright emission (or strong absorption) lines;
3. Q = 3 is a tentative redshift based on one (or some-times two tentative) emission or absorption lines. In these cases, we often use the photometric red-shift as a guide to identify the line. These redred-shifts are therefore not independent of the photometric redshifts and are thus highlighted in the analysis;
4. Q = 4 is assigned to galaxies with no emission lines or continuum detected and so no redshift could be determined.
Examples of spectra from which Q = 1, 2 & 3 redshifts are determined are shown in Fig. 2. Since the ECDFS has been the focus of extensive spectroscopic campaigns (although focusing mainly on bright optical/UV-selected galaxies) six of our ALMA SMGs have published archival spectroscopic redshifts, and we highlight these in Table 2. 1
The emission / absorption lines we are using to de-rive redshifts have a range of physical origins within the galaxies. For example, nebular emission lines arise from Hii regions and so are expected to trace the systemic redshift, whereas UV ISM lines can trace outflowing ma-terial and so can be offset from the systemic redshift by several 100 km s−1 (e.g. Erb et al. 2006; Steidel et al. 2010). Lyαemission, which is often used to derive spec-troscopic redshifts, also suffers resonant scattering. As such, to derive redshifts for each galaxy we adopt the following approach:
1. Wherever possible, systemic redshifts are deter-mined using nebular emission lines such as Hα, [Oii]λλ3726,3729, [Oiii]λλ4959,5007 and/or Hβ. If none of these lines are available we use Heii or Ciii]λ1909 in emission if they are narrow.
1Our goal is to provide a quality flag that allows users to gauge
the likely success, (or interpret) follow up observations a source. For example, a non-detection of the 12CO emission in a Q = 1
source should be interpreted as12CO faint, whereas a12CO
non-detection of a Q = 3 source may be due to the faintness of the12CO
emission, or due to a misidentified/spurious redshift.
TABLE 1
Summary of spectroscopic features
Condition Number of galaxies Total [supp]
Total 131 [32]
Q = 1 20 [1]
Q = 2 11 [3]
Q = 3 21 [3]
Redshifts measured 52 [7]
Not observed 22 [10]
Observed but no specz 57 [15]
Lyα 23 [1]
[Oii] 10 [3]
[Oiii] 6 [0]
Hα 14 [3]
[Oiii] & Hα 3 [0]
Hβ 3 [0]
Notes: The numbers in brackets represents the number of suppSMGs included in the total in each row.
2. If no nebular emission lines are detected, we deter-mine the mean of the redshifts from the UV ISM absorption lines of Ciiλ1334.53, Siivλ1393.76 and Siiiλ1526.72, or other strong emission lines such as Nvλ1240, Mgiiλ2800 and Heii.
3. If Lyα is the only detected line then the redshift is determined from a fit to this line, although we caution that the velocity offset from the systemic can be up to∼1000 km s−1. In most of the galax-ies where a redshift is determined solely from Lyα, the observations were taken with VIMOS using the low-resolution (R ∼180) grating, precluding any detailed analysis to determine the shape of the emission line and judge the influence of absorption on its observed profile. Similarly, where possible we avoid using Civλ1549 for measuring the redshifts, since it can be strongly influenced by winds and frequently exhibits a profile which is a superposi-tion of P-Cygni emission and absorpsuperposi-tion, nebular emission and interstellar absorption (or AGN ac-tivity).
For the ALESS SMGs,∼30% of the redshifts are deter-mined from a single line and generally these redshifts are allocated Q = 3 unless strong continuum features (such as breaks across Lyα) are also identified, which leads to an unambiguous identification and a higher quality flag. Single line redshifts are typically backed up by either con-tinuum breaks across Lyα, the absence of other emission lines that would correspond to a different redshift, line profiles (i.e. asymmetric Lyα profile or identifying the doublet of [Oii]λ3726,3729˚A emission). In seven cases, single line redshifts are based on detections of Lyα; in three cases they are determined from Hα detections in near-infrared spectra and in five cases they are from de-tections of the [Oii] doublet.
We summarise the main spectroscopic features that we detect in Table 1 and provide detailed information on each of the 109 observed SMGs in Table 2.
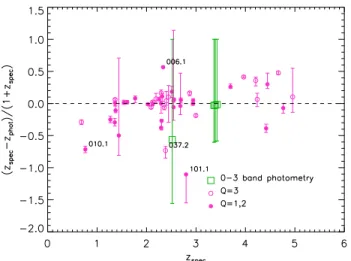
Fig. 3.— A comparison of our spectroscopic redshifts for ALESS SMGs with their estimated photometric redshifts from Simpson et al. (2014). Overall, the photometric redshifts agree well with our spectroscopic redshifts with a median ∆z/(1 +
zspec) = 0.00±0.02. The errors represent the uncertainties on
the photometric redshifts determined from the SED fitting in Simpson et al. (2014). We identify those SMGs with detections in just 0–3 photometric bands where the redshift has been deter-mined by assuming these SMGs have an absolute H-band mag-nitude distribution comparable to that of a complete sample of
z ∼1–2 SMGs. For SMGs with photometric redshift estimated from only 0–1, and 2–3 band photometry are placed at the median for those sources ofz∼4.5 andz∼3.5 respectively.
surements for the ALESS SMGs to the photometric redshift estimates for these SMGs from Simpson et al. (2014) who determine photometric redshifts for 77 of the ALESS SMGs which have 4–19 band photome-try. We flag those sources with spectroscopic red-shifts, but poor photometric coverage and we also high-light the spectroscopic Q = 3 redshifts since their spec-troscopic identification is often guided by the photo-metric redshifts. Nevertheless, even if these Q = 3 SMGs are omitted, there is good agreement between the photometric and spectroscopic redshifts with a median ∆z/(1 +zspec) = 0.00±0.02 and a variance of σ2= 0.1. In four cases, there appear to be significant outliers, with
|∆z/(1 +zspec))| >0.5. In these cases, the large offset between the photometric and spectroscopic redshifts ap-pears to be associated with complex systems or incom-plete photometric coverage, and we briefly discuss these here:
1. ALESS 006.1: the photometry of this ALESS SMG appears to contaminated by an adjacent low-redshift (and unassociated) AGN, and in this case it appears that the SMG is lensed. The photome-try (and photometric redshift) is dominated by the foreground AGN.
2. ALESS 010.1: the Q = 1 spectroscopic redshift is significantly lower than predicted by the photom-etry. There is a blue source slightly offset (<1′′)
from the ALMA position and an IRAC source co-incident with the ALMA position. HST imaging (Chen et al. 2015) reveals two galaxies and it is possible that the blue source is a lens, as confirmed by high-resolution,∼0.1′′ ALMA band 7 follow-up
observations; (Hodge et al. 2016).
3. ALESS 037.2: the Q = 3 spectroscopic redshift is significantly lower than thez >4 predicted by the photometry. However, the spectroscopic redshift is based on two tentative line detections at the cor-rect separation for Hαand [Sii] (see Fig. 2; [Nii], if present would lie under strong sky lines) and the photometric redshift is poorly constrained and based on detections in six bands and limits in a further six. Furthermore, the spectroscopic line identifications would not correspond to any com-mon emission lines if the photometric redshift is correct.
4. ALESS 101.1: this has a Q = 2 redshift based on a single detection of Lyα. It has poor constraints on the photometric redshift with photometric de-tections in only five bands and no dede-tections below J-band. Thus the spectroscopic redshift is signifi-cantly more reliable.
For a significant fraction of the ALMA sample targeted in our survey, we were unable to derive a spectroscopic redshift (these are assignedQ= 4 in Table 2). To under-stand whether this is caused by magnitude limits or their redshifts, we first compare the photometric redshifts of the spectroscopic failures to those for the SMGs for which we were able to determine a spectroscopic redshift. The median photometric redshift of spectroscopic failures is z = 2.4±0.2, compared toz = 2.4±0.1 for the sources for which we were able to measure a spectroscopic shift (these estimates use the best-fit photometric red-shifts values, but they change by less than the quoted uncertainty if the full photometric redshift probability distributions are used instead). This suggests that the SMG with spectroscopic failures are not atmuchhigher redshifts than those SMGs where we have succeeded in obtaining a redshift. Similarly there does not appear to be any correlation with submillimetre flux: for the 52 SMGs with spectroscopic redshifts, the median 870-µm flux isS870µm= 4.2+0−0..34mJy, whereas those 57 SMGs where we could not determine a redshift have a median S870µm= 4.3+0−0..26mJy.
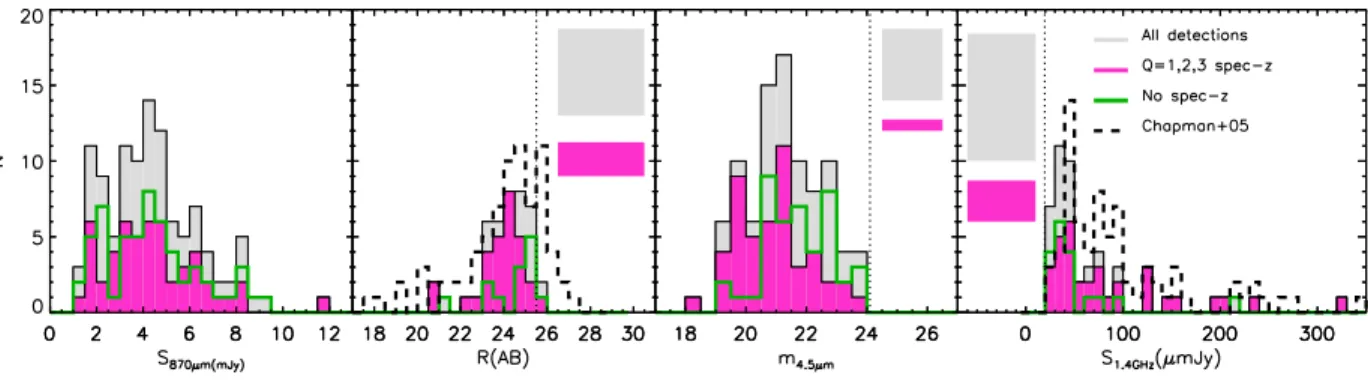
Next, we test the hypothesis that we were unable to measure spectroscopic redshifts for some ALMA SMGs simply due to their faint optical magnitudes. In Fig. 4 we show the distributions of the S870µm flux density,
R-band and 4.5µm magnitudes and 1.4 GHz flux den-sity for the 109 (out of 131) ALESS SMGs that were spectroscopically targeted. The median R-band magni-tude of the ALESS SMGs with spectroscopic redshifts is R = 24.0±0.2 whereas the median magnitude of those SMGs for which we could not measure a redshift is ∼1 magnitude fainter, at R= 25.0±0.4. Turning to longer wavelengths, in the mid-infrared, the median magnitude at 4.5µm is m4.5µm = 20.9±0.2 for the ALESS SMGs with spectroscopic redshifts, as compared to a median of m4.5µm = 21.7±0.2 for those targeted SMGs for which we could not derive a spectroscopic redshift. Hence, there is evidence that the ALESS SMGs for which we were un-able to determine a spectroscopic redshift are marginally fainter in R and m4.5µm than those for which we were able to measure a spectroscopic redshift (and also may have slightly redder R−m4.5 colours).
Fig. 4.—Fundamental observable properties of our spectroscopic sample of SMGs, comprising 870µm fluxes, R-band and 4.5mum magnitudes and 1.4 GHz fluxes. The distributions are compared to those of the parent population of ALESS SMGs (where the parent sample comprises the 109/131 SMGs that were targeted in our spectroscopic survey). In all panels we show three distributions: for the full sample (with and without spectroscopic redshifts); the properties of the SMGs with Q = 1, 2 or 3 spectroscopic redshifts and the distribution for SMGs with photometry but no spectroscopic redshift. As separate boxes we also indicate the proportion of the full and spectroscopic samples which are below the detection limit of the observations in each waveband (these 3σdetection limits are indicated by dotted lines in each panel). On average, we find that the SMGs for which we were able to determine a redshift are marginally brighter in theR-band, and m4.5µm than those for which we were unable to determine a redshift, however, the likelihood of determining a redshift
is independent of the 870µm flux density and so our survey is unbiased in this regard. In addition in theR-band and 1.4 GHz panels we also show the equivalent distribution for the spectroscopic sample of 73 radio-identified submillimetre sources from Chapman et al. (2005), which exhibit comparable properties to our sample. Note that ALESS 020.1 has a very bright radio flux of∼4.2 mJy and is therefore not shown on the 1.4 GHz panel.
versus their 4.5µm apparent magnitudes. At the typical redshift of SMGs (z∼2.4), the 4.5µm emission provides the most reliable tracer of the underlying stellar mass, since it corresponds to rest-frame ∼1.6µm (H-band). As a guide, to crudely test how the 4.5µm magnitude depend on redshift in our sample, we generate a non-evolving starburst track, based on the composite SED for the ALESS SMGs (shown in Simpson et al. 2014 but up-dated to contain the spectroscopic redshift information in Fig. 9). This model SED has been normalised to the median apparent 4.5µm magnitude for the spectroscopic and photometric redshift samples at the median redshift of z∼2.4. The dependence of 4.5µm flux with redshift for our spectroscopic sample is consistent with this track, although with a spread of ∼2 magnitudes at fixed red-shift. However, the data do show a trend of decreasing 4.5µm flux with increasing redshift. Smail et al. (2004) (see also Serjeant et al. 2003) also identified a similarly large spread inK-band magnitudes for SMGs.
Hence we see both a spread in the apparent rest-frame near-infrared luminosities within the SMG population, as well as the fainter optical apparent magnitudes (and redder colours) for those SMGs which we failed to obtain redshifts for and marginally higher photometric redshifts compared to those for which spectroscopic redshifts were measured. Each of these trends are weak, but they do suggest several factors may be driving the spectroscopic incompleteness: a range in stellar masses for SMGs at a fixed redshift (a demonstration of the diversity of the SMG population), varying levels of strong dust extinc-tion and fainter apparent optical fluxes for SMGs at higher redshifts (due to the K correction and increasing distance).
In terms of the radio-detected sub-sample, from the entire main+supp ALESS catalogue, 53 / 131 ALESS SMGs are radio-detected, and we have targeted 52 with spectroscopy, measuring redshifts for 34. The median 1.4 GHz flux density of the SMGs with
spec-troscopic redshifts is S1.4GHz= 63+12−13µJy compared to
S1.4GHz= 39+6−2µJy for those without spectroscopic red-shifts (Fig. 4). Thus, SMGs for which we were unable to determine a spectroscopic redshift are fainter at radio wavelengths than those for which we measured a spec-troscopic redshift.
4. SPECTROSCOPIC REDSHIFT DISTRIBUTION
The spectroscopic redshift distribution of the ALESS SMGs is shown in Fig. 6. In total 52 redshifts have been determined for the ALESS SMGs: 45 main catalogue SMGs and seven supp catalog SMGs. We also overlay the probability density function of the photometric red-shift distribution of ALESS SMGs from Simpson et al. (2014), scaled to the same number of sources. The Q = 1 & 2 and Q = 1, 2 & 3 distributions are shown as individ-ual histograms to test the effect of including the Q = 3 redshifts. The full redshift distribution ranges between z= 0.7–5.0, with a significant (but not dominant) tail at z≥3 for those distributions without a radio-selection.
In Fig. 7 we show the ALESS spectroscopic redshift distribution and compare this with the 1.1-mm selected (U)LIRGs from the recent ALMA surveys of the Hub-bleUltra Deep Field (UDF) by ASPECS (Aravena et al. 2016; Walter et al. 2016) and Dunlop et al. (2016) Given the different selection wavelengths, flux limits and sample sizes between the ALESS SMGs and the ALMA / UDF galaxies, we caution against drawing strong conclusions about the differences between these redshift distributions (for a detailed discussion see B´ethermin et al. 2015). Nevertheless, we note that all of these distributions peak at z ∼2.0±0.5, with a suggestion that fainter sources may lie at lower redshifts on average.
likli-hood of being spurious sources. The median redshift of themaincatalogue SMGs with Q = 1, 2 & 3 redshifts is z = 2.5±0.1 with an interquartile range of z = 2.1–3.4, whereas the median redshift of themain+suppcatalogue with Q = 1, 2 & 3 redshifts is z = 2.4±0.1 with an in-terquartile range of z = 2.1–3.0. The median redshift of the Q = 1, 2 & 3 SMGs in the supp sample alone is z = 2.3±0.5. Thus, the median redshifts of these various samples are all consistent. Indeed, a two-sided Kolmogorov-Smirnov (K-S) test between the main and
supp samples suggests only a 60% likelihood that they are drawn from different populations. Since the statistics of the samples do not vary strongly with the inclusion of thesuppsources, we are therefore confident that includ-ing the suppsources in our analyses is unlikely to bias any of our results.
Since most previous SMG redshift surveys have, by necessity, relied on radio detections to identify probab-listically the likely counterparts, we briefly discuss the properties of the radio-detected subset of the ALESS SMGs, as this provides a reasonable comparison to pre-vious work. In our sample we targeted 52 of the 53 radio-detected SMGs with spectroscopy and measured redshifts for 34 of them (65%). The median 1.4 GHz ra-dio flux density of the 34 rara-dio-detected ALESS SMGs with spectroscopic redshifts is 63+12−13µJy, as compared to 50+6−5µJy forall52 radio-detected SMGs. In contrast, the median radio flux density of the 73 radio-detected sub-millimetre sources in Chapman et al. (2005) with spec-troscopic redshifts is 75+8−3µJy. On average, the radio-detected ALESS SMGs with redshifts are ∼20% fainter at 1.4 GHz than the Chapman et al. (2005) sample and our spectroscopic completeness is∼10% lower. We note that it appears that the Chapman et al. (2005) radio-identified submillimetre sources have a higher AGN frac-tion than our ALESS sample, and indeed up to ∼40% of their sample exhibit signatures of AGN activity in the X-rays, spectra or from their broad-band optical/mid-infrared SEDs (e.g. Alexander et al. 2008; Hainline et al. 2011). Wang et al. (2013) find an AGN fraction of
∼17+16−6 % for the ALESS SMGs. Typically AGN spec-tra have stronger, more easily identifiable emission fea-tures and thus our∼10% lower spectroscopic complete-ness may be due to a lower AGN fraction.
5. DISCUSSION
Although the primary aim of this work is to deter-mine the redshifts of unambiguously identified SMGs to support further detailed follow-up (e.g. CO or Hα dy-namics, Huynh et al. e.g. 2013), there is also a wealth of information contained within the spectra themselves concerning the dynamics, chemical composition, and en-ergetics of these SMGs. Furthermore, the redshifts can be used as constraints in SED models (e.g. constrain-ing the star-formation history and so the stellar masses) and to investigate the environments in which these SMG reside.
5.1. Spectral diagnostics 5.1.1. Stacked spectral properties
Stacked spectra are a useful tool to detect weak fea-tures that are not visible in individual spectra and also
Fig. 5.— A plot showing the distribution of 4.5µm apparent magnitude versus redshift for ALESS SMGs. We see a tendency for more distant SMGs to have fainter 4.5µm magnitudes and to assess this we plot a line showing the expected variation with red-shift for a galaxy with a fixed, non-evolving luminosity, assuming the composite ALESS SED from Simpson et al. (2014) (see also Fig. 9). This track is normalised to the median apparent magnitude in 4.5µm at a median redshift ofz= 2.4. The data roughly follow this trend, although they exhibit at least an order of magnitude variation in 4.5µm magnitude at a fixed redshift. Those SMGs which are found to be physically associated (pairs or triples) with other SMGs are highlighted. Those in associations have a marginal tendency to be among the brighter SMGs (and therefore could po-tentially be more massive; see§5.3). Photometric redshifts (where spectroscopic redshifts are not available) are shown as their ±1σ
ranges given in Simpson et al. (2014) and Table 2. The two ex-treme outliers are identified with their ALESS ID.
for determining the average properties of the popula-tion. We therefore produce composite spectra over two different wavelength ranges, one covering Lyα and UV ISM lines and one around the [Oii]λ3727 and Balmer break, and we use these to search for evidence of emis-sion/absorption features and continuum breaks. To con-struct the composites, we first transform each spectrum to the rest-frame using the best redshift in Table 2. Where the sky subtraction leaves significant residuals, the region within ±5˚A of the sky lines are masked be-fore stacking (and we use the OH line catalogue from Rousselot et al. (2000) to identify the bright sky lines in the near-infrared). We then sum the spectra, inverse weighted by the noise (measured as the standard devi-ation in the region of continuum over which they have been normalised). In the case of the 1000–2000˚A com-posite (Fig. 8), we normalise the spectra by their median continuum value at>1250˚A and in the case of the com-posite around 3400–4400˚A (Fig. 9), we normalise by the median continuum value between 2900–3600˚A. We note that when transforming the spectra to the rest-frame, in a number of cases, the UV ISM lines and Lyα can be significantly offset in velocity from this systemic redshift (see Fig. 12). In the composite spectrum these spectral features may therefore appear broadened and offset.
Fig. 6.—The spectroscopic redshift distribution of the SMGs from our survey. Those SMGs with secure redshifts (Q = 1 & 2) are shown, as well as the distribution for all Q = 1, 2 & 3 redshifts. We compare the distribution to the probability density function of the photometric redshifts from Simpson et al. (2014) normalised to the same total number of sources. We also compare to the redshift distribution of radio-identified submillimetre sources from Chapman et al. (C05 2005). We see very striking differences between the ALESS SMG redshift distribution and that for Chapman et al. (2005), both at low and high redshifts,z<
∼1 andz>∼3.5. In particular the ALESS SMGs have a
spectroscopic redshift distribution that extends to higher redshift, with∼23% of the SMGs atz >3 and an even larger proportion in the more complete, but less precise, photometric redshift distribution from Simpson et al. (2014). To mimic the selection of the radio-identified Chapman et al. (2005) sample, the redshift distribition of the radio-detected ALESS SMGs are highlighted. This shows that there are still discernable differences between the redshift distributions of the radio-detected ALESS SMGs and those from Chapman et al. (2005) at low redshifts,z<
∼1, raising the possibility that some of the low-redshift radio counterparts to submillimetre sources claimed by Chapman et al.
(2005) could be misidentifications. The bin size is ∆z= 0.2 and the grey shaded box indicates the incompleteness in the Q = 1, 2 & 3 sample compared to the parent population of targeted SMGs in the field.
weak Civ absorption and emission and Oi absorption. If the feature identified as Siiv is real, then it and the weaker Civfeatures, both of which show blueshifts, may be indicative of strong stellar winds. To illustrate the typical strength of the absorption features we also over-lay the composite spectrum of∼200 Lyman break galax-ies (LBGs) from Shapley et al. (2003) (the LBG compos-ite shown here corresponds to the quartile of 200 LBGs from the Shapley et al. (2003) sample that has the closest match in Lyαequivalent width to our ALESS sample). We note that due to the different wavelength ranges of the different instruments used and the fact that we de-redshift and stack in the rest-frame, not all the spectra in our stack contribute to the full wavelength range.
We also construct a composite from the Q = 3 spec-tra and plot this in Fig. 8. The purpose of this is to test the reliability of the redshifts derived for the Q = 3 spectra by searching for weak spectral features which are undetected in the individual spectra, but become visible in the stacked spectrum due to the improved signal to noise. In addition to an emission line identified as Lyα (which is frequently the feature used to derive the red-shift for these sources), we see only a potential emission
Fig. 7.—The spectroscopic redshift distribution of the SMGs in our 870µm survey compared to that for two faint 1.1-mm selected samples in the UDF from Aravena et al. (2016) and Dunlop et al. (2016) (we note that the total number of sources for the distribu-tions shown are not the same). These SMG samples have quite different selection functions and levels of incompleteness and so we do not draw any strong conclusions from the apparent differences between them, beyond noting that both distributions peak at rel-atively high redshifts,z∼1.5–2.5, and reach out toz∼5 with the more numerous ALESS 870µm sample showing a more significant high-redshift tail beyondz∼3.
3600˚A is (1.5±0.1)×lower than it is at 3900–4000˚A. To try to place limits on the age of the visible stel-lar populations within the ALESS SMGs, we use the SED templates from Bruzual & Charlot (2003) to pre-dict the spectra expected from a starburst of 100 Myr duration observed at ages of 10 Myr, 100 Myr and 1 Gyr (post-starburst). We redden the model spectra using the reddening law from Calzetti et al. (2000) adopting the median extinction of AV= 2 for the ALESS SMGs, as de-rived from SED fitting (see§5.1.2). As Fig. 9 shows, the stellar continuum emission seen in the composite spec-trum is most similar to an on-going burst (i.e. undergoing star-formation on 10–100 Myr timescales), as expected for these strongly star-forming galaxies.
As well as stacking the spectra, we can also create a rest-frame broad-band SED for a “typical” SMG (or at least “typical” of the brighter/bluer examples for which redshifts can be measured). Simpson et al. (2014) and Swinbank et al. (2014) discuss the optical / near-infrared and far-infrared / radio photometry of the ALESS SMGs (see also da Cunha et al. 2015). By combining the multi-wavelength photometry with spectroscopic redshifts for the 52 ALESS SMGs, we create composite SEDs from the rest-frame UV to radio wavelengths. First, we trans-form the photometry to the rest-frame, and then stack the photometry (normalised by rest-frame H-band lu-minosity; see §5.1.2). A running median is then cal-culated through the data to produce an average SED which we show in Fig. 9. We also overlay ahyper-z fit using a constant star-formation history, which indicates (as expected) a heavily dust reddened spectrum of these SMGs. Our best-fit constant star-formation model shows a slightly bluer continuum than that derived using the photometric redshift sample by Simpson et al. (2014), il-lustrating a modest bias to bluer restframe UV continuua in those SMGs for which we can measure spectroscopic
redshifts for. Nevertheless, our spectroscopic composite SED still display a very red continuum shape and a clear break at ∼3800˚A, as seen in the composite spectrum at this wavelength (Fig. 9).
5.1.2. UV-to-radio SEDs
Using our sample of spectroscopically confirmed SMGs with extensive UV-to-radio photometry, we employ the
magphys SED fitting code from (see da Cunha et al. 2015) to fit the UV-to-radio emission on a galaxy-by-galaxy basis to estimate the dust reddening, far-infrared luminosity and infer the stellar mass for each SMG. Es-timates of these parameters have been made using pho-tometric redshifts, but the addition of spectroscopic red-shifts removes some of the degeneracies between photo-metric redshift, reddening and star-formation histories, to allow more precise estimates to be made. The UV– mid-infrared photometry for the ALESS SMGs is given in Simpson et al. (2014), whilst the (deblended) Her-schel/ SPIRE+PACS, ALMA and radio photometry are given in Swinbank et al. (2014) (see also da Cunha et al. 2015). For each SMG, we use magphys to fit the pho-tometry at the spectroscopic redshift, and we show the best-fit SEDs (normalised by their 8–1000µm luminosi-ties) in Fig. 10 2. These normalised, rest-frame SEDs demonstrate a large range in the UV- to optical-flux density which is driven by a large spread in the dust attenuation. Indeed, the estimated extinction varies from AV ∼0.5–7 magnitudes between SMGs (see also da Cunha et al. 2015).
From the sample, we derive a median extinc-tion of AV= 1.9±0.2 and far-infrared luminosity of
LFIR=(3.2±0.4)×1012L⊙, both of which are
consis-tent with previous estimates (for the same sample) de-rived using photometric redshifts (AV= 1.7±0.2 and
LFIR= (3.5±0.4)×1012L⊙ respectively from Simpson
et al. (2014)). In addition, magphys also returns es-timates of the stellar masses (solving for the star for-mation histories and ages) and we derive a median stel-lar mass for our 52 SMGs with spectroscopic redshifts of M⋆= (6±1)×1010M
⊙, in agreement with previous
estimates for this sample using photometric redshifts and simple assumptions about the star formation his-tories by Simpson et al. (2014), see also da Cunha et al. (2015). This is also consistent with the stellar masses es-timates for the radio-identified submillimetre sources in the Chapman et al. (2005) sample (M⋆ ∼7×10¹⁰M
⊙;
Hainline et al. 2011). In Fig. 11 we plot the ALESS SMGs with spectroscopic redshifts on the stellar mass– star-formation rate plane. For comparison, we overlay the trends proposed for the so-called “main-sequence” of star-forming galaxies atz= 1, 2 & 3 and compare these to the SMGs in the same redshift slices. From this plot, it is clear that the SMGs in our sample lie (on aver-age) a factor∼5 above the so-called “main-sequence” at all three redshifts, with a median specific star-formation rates (sSFR) of sSFR = (6±1)×10−9yr−1 (see also e.g. Magnelli et al. 2012; Simpson et al. 2014).
5.2. Velocity offsets between emission / absorption lines
2 The template SEDs are available from:
Fig. 8.—Composite spectra around the Lyα emission line (∼1215˚A). The spectra are averaged and weighted by their noise and the uncertainty is derived from bootstrap resampling of the spectra included in the stack and is shown as the grey shaded regions. The upper spectrum shows the stack of all the Q = 1 and 2 spectra which shows a number of potential absorption features, as well as the Lyαemission line. For comparison the composite spectrum of LBGs from Shapley et al. (2003) is overlaid in red (and offset for clarity). The Q = 3 stack at the bottom was produced to test the validity of the uncertain Q = 3 redshifts by identifying features in their composite spectrum. The solid blue line is a running median of the Q = 3 composite. We see apparently significant detections of Lyαand a weak feature which may be Ciii]λ1909 in the Q = 3 composite, which if real may indicate that some of these redshifts are correct.
Fig. 10.— The best-fit rest-frame SEDs for all ALESS SMGs with spectroscopic redshifts. These SEDs have been fitted using
magphys(see da Cunha et al. 2008) and are normalised by their far-infrared (8–1000µm) luminosity. The coloured curves represent SEDs for SMGs with Q = 1 & 2 redshifts. They are colour-coded by the logarithm of their ratio of rest-frame S870µm/Hflux density
(with red denoting a higher ratio). Grey curves represent SEDs for SMGs with Q = 3 redshifts. We see a very large spread in the UV to optical flux density arising from a large spread in the attenu-ation. The colour scale in the upper image shows the 52 SEDs ranked by their characteristic dust temperature. These illustrate the wide variety in both the restframe UV/optical/near-infrared and mid-infrared characteristics of SMGs with very similar far-infrared luminosities.
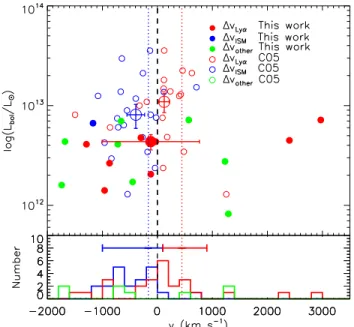
Rest-frame UV optical spectroscopic analysis of high-redshift, star-forming galaxies have shown that redshifts derived from UV ISM absorption lines typically display systematic blue-shifted offsets from the systemic (neb-ular) redshifts (e.g. Erb et al. 2006; Steidel et al. 2010; Martin et al. 2012), whilst redshifts determined from Lyα emission often show a systematic offset redward of the systemic. These velocity offsets are a consequence of large scale outflows (e.g. Pettini et al. 2002; Steidel et al. 2010), where the outflows material between the galaxy and the observer absorbs the UV and scatter Lyα pho-tons from the receeding outflow, redshifting them with respect to the neutral medium within the galaxies. For some of the ALESS SMGs we are able to determine neb-ular, UV ISM and Lyαredshifts, allowing us to compare to the results for other star-forming populations.
In Table 2 we summarise the lines detected for each ALESS SMG and the redshift associated with fitting to each line. We show the velocity offsets between the Lyα, UV ISM and nebular emission lines in Fig. 12. We also overlay the velocity offsets for the radio-identified counterparts to submillimetre sources studied by Chapman et al. (2005). Although the same trend is seen in the SMGs and LBGs (Lyα is redshifted and the UV ISM lines are blueshifted with respect to the systemic redshift), the SMGs display significantly more scatter, with velocity offsets ranging between ∼ −1100 to +700 km s−1for the UV ISM-derived redshifts and be-tween∼ −1500 to +1200 km s−1for the Lyα-derived red-shifts, as compared to−600 to +100 km s−1and∼+100 to +900 km s−1respectively for the LBGs in Steidel et al. (2010). The wide variation in the velocity offsets may be due to a spread in the viewing angle of the winds or the presence of multiple components (Chen et al. 2015
sug-Fig. 11.—The stellar mass–star-formation rate plane for ALESS SMGs with spectroscopic redshifts compared to the so-called “main-sequence” of star-forming star-forming galaxies at z = 1, 2 & 3. We identify the ALESS SMGs with the best spectroscopic redshifts (Q = 1 & 2) and the points are colour coded by their spec-troscopic redshift. Taken at face value plot suggests that atz∼1–3 SMGs have sSFRs which lie between the “main-sequence” and an order of magnitude higher sSFR and on-average their sSFR are a factor of ∼5×higher than the bulk of the star-forming popula-tion at their stellar mass. However, we caupopula-tion that the stellar masses of these highly obscured and strongly star-forming galaxies are systematically uncertain (Hainline et al. 2011). We illustrate the expected conservative uncertainties for the measurements by the error bars plotted in the lower-right of the panel and stress that it is possible that the SMGs could be moved systematically by comparable amounts on this figure.
gest that most SMGs are major mergers and so the spec-tra may have contributions from merging components), or the diversity of conditions within these SMGs, in par-ticular with regard to the strength of large-scale winds. Since the wind must be accelerated by star formation or AGN activity, in Fig. 12 we plot the velocity offsets be-tween lines as a function of bolometric luminosity (we note that only two SMGs in our sample are X-ray AGN; Wang et al. 2013 and neither of these show Lyαand UV ISM lines with extreme offsets from the systemic red-shift). Although there is significant scatter, within the ALESS sample the SMGs with lower bolometric lumi-nosity tend to have wind velocities that are lower than those of the highest luminosity sources.
We note that the outliers in Fig. 12 are ALESS 088.5 and ALESS 049.1, with Lyαoffset from the systemic by >2000 km s−1. For both ALESS 088.5 and ALESS 049.1 the only line available to determine a nebular / systemic velocity was Heiiλ1640, which, as we described previ-ously can originate from the stellar winds from Wolf-Rayet stars, making it less reliable as a systemic velocity tracer than the typical nebular lines (e.g. Hα). It is im-portant to note that the nebular lines such as Hα, [Oiii] and [Oii] may also be influenced by winds, however this is more typically observed as line broadening as opposed to a centroid shifting.
5.3. Environments
Fig. 12.—Top: Velocity offsets of the UV ISM absorption lines and Lyαfrom the systemic redshifts (marked by the dashed line) versus bolometric luminosity (L8−1000µm) for all ALESS SMGs
and the radio-identified submillimetre sources from Chapman et al. (2005), where appropriate lines are detected. The median of each sample is marked by a larger symbol. The red and blue dotted lines represent the mean of the distributions of Lyα and ISM velocity offsets respectively from thez= 2–3 LBG study from (Steidel et al. 2010) and the full range are shown as error bars on the bottom figure. We show a representative error bar for our data derived from the median error on the bolometric lumi-nosity and we estimate a typical redshift measurement error of ∼100 km s−1 from fitting the spectral lines. The green points
in-dicate offsets measured between lines which can be either nebular or ISM lines and are frequently strongly influenced by winds, such as Civλ1549, Nvλ1240, Ciii]λ1909, Mgiiλ2800 and Heii. Note that the far-infrared luminosities for the Chapman et al. (2005) sources are derived from their radio fluxes and may be overesti-mated. Bottom:Histograms of the distributions of velocity offsets for Lyα(red), UV ISM lines (blue) and other lines (green). The histograms include the SMGs from ALESS and the radio-identified submillimetre sources in Chapman et al. (2005), and demonstrate that Lyαand the UV ISM lines in SMGs do indeed respectively peak redward and blueward of the systemic velocity, as expected if these systems are driving outflows and winds.
these sources. Hence, we next use our spectroscopic redshift sample to search for physical associations be-tween SMGs and bebe-tween SMGs and other galaxy pop-ulations within the field. Various studies have in-vestigated the environments of SMGs and suggested that at least some SMGs reside within overdense envi-ronments (e.g. Chapman et al. 2001; Blain et al. 2004; Chapman et al. 2009; Daddi et al. 2009; Capak et al. 2011; Walter et al. 2012; Ivison et al. 2013; Decarli et al. 2014; Smolcic et al. 2016). For example, Blain et al. (2004) (see also Chapman et al. 2009) identified an over-density of six SMGs and two radio galaxies at z = 1.99 within 1200 km s−1of each other in the GOODS-N field. Clustering analysis has also suggested that SMGs cluster on scales of 5–10h−1Mpc−1, while pair counting suggests SMGs have properties consistent with them evolving into the passive red galaxies at z ∼1, and subsequently the members of rich galaxy groups or clusters atz ∼0 (e.g. Blain et al. 2004; Hickox et al. 2012; Chen et al. 2016; Wilkinson et al. 2016).
jections dominating multiplicity in the brightest SMGs, and strongly suggests that a significant proportion of these high-redshift ULIRGs are likely to be physically associated. These SMGs are typically separated by∼6′′
which corresponds to ∼40–50 kpc if they lie at the same redshift.
With our survey, we can use a simple approach and exploit the spectroscopic redshifts to search for asso-ciations and overdensities in the ALESS SMG popula-tion. First, we search for physical associations between SMGs in the same ALMA map (i.e. within∼18′′) where
the SMGs lie within 2000 km s−1 (although an offset of 2000 km s−1is larger than the typical velocity dispersion of rich clusters, even at z ∼0, we broaden our search window to account for potential outflow-driven shifts in the spectral features used to derive the redshifts of many of the SMGs (see §5.2). Unfortunately, there are only three ALESS maps in which we were able to determine a reliable spectroscopic redshift for two or more of the SMGs (ALESS 017.1, 017.2; 075.1, 075.2; 088.1, 088.2, 088.5 and 088.11), and in none of these maps do we find any small-scale clustering of SMGs along the line of sight, the range of redshift offsets between these (pre-viously blended) components is ∆z = 0.06–1.25. Only in ALESS 067 do we have indirect evidence for an in-teracting pair of SMGs (ALESS 067.1 and ALESS 067.2) based on the morphology of the sources inHST imaging (Chen et al. 2015).
Next, we search for physical associated between SMGs across the whole ECDFS field (i.e. between the ALMA maps). We identify seven pairs of SMGs within 2000 km s−1 of each other, with ALESS 075.2, ALESS 088.5 and ALESS 102.1 also appearing as a triple “association”. These pairs/triples of SMGs have an aver-age offset of∼4 Mpc in the plane of the sky (with a range of ∼2–15 Mpc). On these scales, the pairs (or triples) may lie within the same large-scale structure but are un-likely to lie within the same dark matter halos.
1.0,3. From this catalog, we select only secure redshifts and remove duplicates (we also remove cases in which two secure but differing redshifts are given from two different references).
In Fig. 13 we plot the spectroscopic redshift distri-bution of the ALESS SMGs, together with the field population. In those cases where ≥2 SMGs lie within 2000 km s−1, these associations do not often statistically coincide with significant over-densities in the background galaxy population, although the two SMGs at z ∼1.36 are coincident with a slight peak in the radio / MIPS sources at that redshift.
Finally, returning to Fig. 5 we have highlighted there the ten SMGs that are members of pairs (or triples) with spectroscopic redshift offsets between components of ≤2000 km s−1. The median apparent magnitude at 4.5µm for these ten SMGs ism4.5µm= 20.4+0−0..76 as com-pared to a median ofm4.5µm= 21.1+0−0..14for the 42 ALESS SMGs in the parent spectroscopic sample which are not in identified “associations”. We conclude that there is no evidence in the current sample that the SMGs in “as-sociations” are any brighter (and thus potentially more massive) than those not in “associations”.
6. CONCLUSIONS
In this work we present the results from a redshift sur-vey of ALMA-identified SMGs. Our main conclusions are:
• The redshift distribution for ALESS SMGs with spectroscopic redshifts is centered at z= 2.4±0.1, but with a full range of z = 0.7–5.0 and an in-terquartile range ofz= 2.1–3.0. This is consistent with the photometric redshift distribution for these sources, and the median is consistent with previ-ous estimates based on the radio-identified coun-terparts to submillimetre sources (Chapman et al. 2005). However, since we do not rely on a radio se-lection, our sample is not biased against higher red-shift SMGs and indeed, 23% of the ALESS SMGs with spectroscopic redshifts lie atz >3.
• We identify velocity offsets up to∼3000 km s−1 be-tween the redshifts measured from nebular emis-sion lines (i.e. Hα, [Oiii], Hβ and [Oii]) and those measured from Lyα or UV ISM absorption lines. We conclude that it is likely that the extreme SFRs within the SMGs (typically ∼300±30 M⊙yr−1)
are driving strong galaxy-scale outflows in many of these systems.
3 http://www.eso.org/sci/activities/garching/projects/goods/MASTERCAT v3.0.dat
which includes redshifts from Cristiani et al. (2000); Croom et al. (2001); Bunker et al. (2003); Dickinson et al. (2004); Stanway et al. (2004a,b); Strolger et al. (2004); Szokoly et al. (2004); van der Wel et al. (2004); Le F`evre et al. (2005); Doherty et al. (2005); Mignoli et al. (2005); Ravikumar et al. (2007); Vanzella, E. et al. (2008); Popesso et al. (2009); Balestra et al. (2010); Coppin et al. (2010); Silverman et al. (2010); Kurk et al. (2013); and redshifts also taken from Kriek et al. (2008); Boutsia et al. (2009); Taylor et al. (2009); Treister et al. (2009); Wuyts et al. (2009); Casey et al. (2011); Xia et al. (2011); Bonzini et al. (2012); Cooper et al. (2012); Coppin et al. (2012); Iwasawa et al. (2012); Mao et al. (2012); Le F`evre et al. (2013); Georgantopoulos et al. (2013); De Breuck et al. (2014); Williams et al. (2014) and the 2dF Galaxy Redshift Survey (Colless et al. 2003)
• Since many of our spectra of SMGs are too faint to exhibit any obvious emission or absorption fea-tures (continuum is only detected in∼50% of the sources), we produce composite spectra over vari-ous wavelength ranges to search for weaker features in the “typical” ALESS SMG optical-to-near in-frared spectrum. At rest-frame 1000–2000˚A we see strong, asymmetric Lyα emission and blueshifted Siii and potentially Siiv absorption suggestive of strong stellar winds. Our composite spectrum at rest-frame 3400–4400˚A shows a Balmer break, in-dicative of on-going star formation. Comparing our composite to spectral models we suggest that it is most consistent with a young starburst with an age of∼10 Myr.
• We use our precise spectroscopic redshifts to re-duce the uncertainties when modelling the SEDs of our SMGs usingmagphysand find a large spread in the dust attenuation (AV ∼0.5–7 magnitudes) with a median AV= 1.9±0.2. We also derive a median stellar mass ofM⋆= (6±1)×1010M⊙ and
by combining with our estimates of their star-formation rates, we show that SMGs lie (on aver-age)∼5 times above the so-called “main-sequence” at z ∼1–3. We provide this library of template SEDs for 52 SMGS with precise redshifts and well-sampled photometry as a resource for future studies of SMGs.
This work has highlighted the challenges of measur-ing spectroscopic redshifts at optical-to-near infrared wavelengths for dusty star-forming galaxies identified by ALMA, and thus demonstrates the importance of al-ternative methods of measuring redshifts such as mid-infrared spectroscopy (e.g. Valiante et al. 2007) and the increasing importance of blind submillimetre / millimetre spectral searches with ALMA (e.g. Weiß et al. 2013).
Neverthless, we find that the SMG population is a diverse population of dusty galaxies most common at z ∼2.4, with evidence of energetic outflows which are likely to be predominantly driven by star formation, al-though some may have a contribution from AGN. The main goal of this study was to provide redshifts for subse-quent studies such as CO gas or further detailed integral field unit (IFU) follow-up observations. Such studies will allow us to separate out the relative contributions of star formation and AGN, to probe the conditions within the star-forming gas to better understand this extreme and diverse population of galaxies.
ACKNOWLEDGMENTS
Fig. 13.—Top: The spectroscopic redshift distribution of SMGs (Q = 1, 2 & 3) compared to the less luminous galaxy populations in the field. The latter is based on the catalogue compiled by Luo et al. (2011) with the addition of recent redshifts from the full FORS2/VIMOS survey (Table 2 & 3) and from Williams et al. (2014). We plot all the galaxies in the ECDFS for which we have spectroscopic redshifts (including the SMGs), we also plot the distributions for just the radio/MIPS sources, as well as the SMGs. We see little correlation between the peaks in the SMG redshift distribution and the general galaxy distribution. The binning is 6000 km s−1in all panels.Bottom:Expanded
views of the redshift distribution around the associations of the ALESS SMG compared to the overall galaxy redshift distribution. We find a maximum of three SMGs in our adopted 2000 km s−1 window, in addition to three pairs of SMGs. The pairs/triples in the SMG
population do not obviously coincide with overdensities in the less-active galaxy populations across the field. The colour coding is the same as Fig. 13 and the top axis indicates velocity relative to the redshift of the pair/triple.
support from a McCue Fellowship at the University of California, Irvines Center for Cosmology and the Univer-sity of Texas at Austins College of Natural Science. JLW is supported by a European Union COFUND/Durham Junior Research Fellowship under EU grant agreement number 267209. AK acknowledges support by the
Col-laborative Research Council 956, sub-project A1, funded by the Deutsche Forschungsgemeinschaft (DFG). ALMA is a partnership of ESO (representing its member states), NSF (USA) and NINS (Japan), together with NRC (Canada) and NSC and ASIAA (Taiwan), in cooperation with the Republic of Chile. The Joint ALMA Observa-tory is operated by ESO, AUI/NRAO and NAOJ.
REFERENCES
Alexander D. M., Brandt W. N., Smail I., Swinbank A. M., Bauer F. E., Blain A. W., Chapman S. C., Coppin et al., 2008, AJ, 135, 1968