© 2019, IRJET | Impact Factor value: 7.211 | ISO 9001:2008 Certified Journal
| Page 8
COMPARATIVE ANALYSIS OF THE OPERATION OF HORIZONTAL
SCREW-TYPE DISPENSER WITH AND WITHOUT A COMPENSATING
SCREW-CONVEYOR DEVICE
Dean Todorov
1, Bozhidar Kolev
21
PhD – student, Agrarian and Industrial Faculty, Department of Agricultural Machinery,
“Angel Kanchev” University of Ruse, Bulgaria
2
Assoc. Professor, Eng., PhD, Department of Agricultural Machinery,
“Angel Kanchev” University of Ruse, Bulgaria
---***---Abstract - This report presents the results from the planned multi-factor experiments that have been performed and the
comparative analysis of the results of the two different structures.
Key Words: Dispensers, Auger, Small ruminants, Pelleted feed, Volumetric efficiency;
1. INTRODUCTION
Based on preliminary studies1 of a dispenser with a horizontal screw-type auger and of the same dispenser with an added
compensating auger, the intervals of variation of the manageable factors and the results regarding their effect on productivity, dispensing error and specific energy consumption have been established. This report presents the results from the planned multi-factor experiments that have been performed and the comparative analysis of the results of the two different structures.
[image:1.595.80.516.469.719.2]2. EXPOSITION
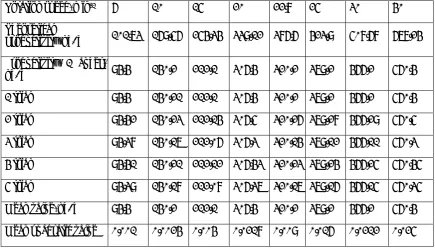
Table -1: Summary table of productivity at different rotation speeds
Rotation speed, min-1 6 10 15 20 22.8 25 30 40
Theoretical
productivity, kg/h 101.73 169.56 254.34 339.12 386.6 423.9 508.68 678.24
Productivity, 1 auger,
kg/h 94.4 140.2 212.1 306.4 320.2 379.2 466.2 560.4
1 trial 94.4 140.21 212.1 306.4 320.2 379.2 466.2 560.4
2 trial 94.42 140.23 212.14 306.5 320.26 379.28 466.29 560.5
3 trial 94.38 140.17 212.06 306.3 320.14 379.12 466.11 560.3
4 trial 94.41 140.21 212.12 306.43 320.23 379.24 466.25 560.45
5 trial 94.39 140.18 212.08 306.37 320.17 379.16 466.15 560.35
Mean value, kg/h 94.4 140.2 212.1 306.4 320.2 379.2 466.2 560.4
Mean quadratic value 0.001 0.0024 0.004 0.0218 0.009 0.016 0.0212 0.025
1 Todorov, D., et. al. Preliminary studies on horizontal screw-type dispenser with and without a compensating screw-conveyor
device.
© 2019, IRJET | Impact Factor value: 7.211 | ISO 9001:2008 Certified Journal
| Page 9
Productivity, 2 augers,
kg/h 98.8 165.4 246.24 325.9 371.3 400 483.25 630
1 trial 98 165.4 246.24 325.9 371.3 403 483.24 633
2 trial 99.5 167.4 249.24 329.9 375.8 404.5 489.25 630
3 trial 97.6 163.4 243.24 321.9 366.8 396.5 477.25 40
4 trial 99.5 166.4 247.74 327.9 373.6 395.5 486.26 6.281
5 trial 99.4 164.4 244.74 323.9 369 400.5 480.25 633
Mean value, kg/h 98.8 165.4 246.24 325.9 371.3 400 483.25 630
Mean quadratic value 0.925 1.581 2.372 3.162 3.574 3.937 4.745 6.281
Coefficient of variation,
% 0.00936 0.00955 0.00963 0.0097 0.00963 0.00984 0.009819 0.00997
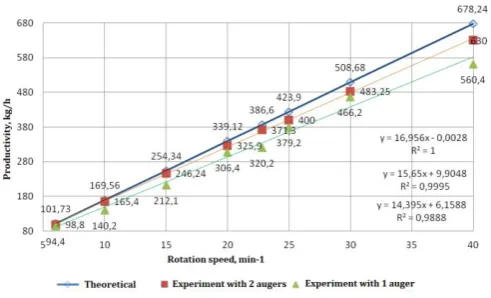
Summary graph of productivity in case of operation with a single auger and with two augers as compared to the theoretical productivity at different rotation speeds.
Chart -1: Comparison between theoretical productivity and productivity in case of operation with a single auger or two
augers
2.1 Multi-factor experiments
[image:2.595.178.424.376.525.2]The levels and intervals of variation of the manageable factors have been identified based on preliminary information and single-factor experiments that have been conducted. The natural and coded values of the factors are given in table 2.
Table -2: Natural and coded values of factors
Indicator
Natural values Coded values
1
x ,
x
2,x
3, 1
x
2
x
3
x
min-1 m º
Lower limit of change 20 0.4 -10
© 2019, IRJET | Impact Factor value: 7.211 | ISO 9001:2008 Certified Journal
| Page 10
Interval of change 5 0.3 10
Main level 25 0.7 0 0 0 0
Lower level 20 1.0 +10 -1 -1 -1
Upper level 30 0.4 -10 +1 +1 +1
[image:3.595.32.564.235.724.2]Interval of variation 5 0.3 10 1 1 1
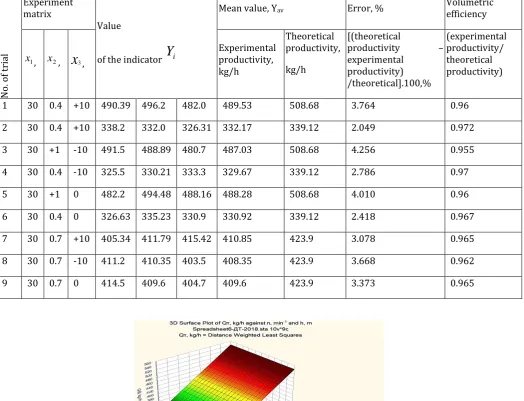
Table -3: Productivity dependence on rotation speed and the feed level in the hopper
N
o.
of
tr
ia
l
Experiment matrix
Value
of the indicator
Y
iMean value, Yav Error, % Volumetric efficiency
1
x ,
x
2,x
3, Experimental productivity,kg/h
Theoretical productivity,
kg/h
[(theoretical
productivity –
experimental productivity) /theoretical].100,%
(experimental productivity/ theoretical productivity)
1 30 0.4 +10 490.39 496.2 482.0 489.53 508.68 3.764 0.96
2 30 0.4 +10 338.2 332.0 326.31 332.17 339.12 2.049 0.972
3 30 +1 -10 491.5 488.89 480.7 487.03 508.68 4.256 0.955
4 30 0.4 -10 325.5 330.21 333.3 329.67 339.12 2.786 0.97
5 30 +1 0 482.2 494.48 488.16 488.28 508.68 4.010 0.96
6 30 0.4 0 326.63 335.23 330.9 330.92 339.12 2.418 0.967
7 30 0.7 +10 405.34 411.79 415.42 410.85 423.9 3.078 0.965
8 30 0.7 -10 411.2 410.35 403.5 408.35 423.9 3.668 0.962
9 30 0.7 0 414.5 409.6 404.7 409.6 423.9 3.373 0.965
Fig -1: Dependency of productivity Q on the auger rotation speed n, min-1 and the feed level in the hopper h, m
[image:3.595.38.563.253.654.2]© 2019, IRJET | Impact Factor value: 7.211 | ISO 9001:2008 Certified Journal
| Page 11
Regres sion Summary for D ependent Variable: Qт, k g/h (Spreadsheet6-D T-k orek cia-2018.s ta) R=1.00000000 R?=1.00000000 Adjusted R?=1.00000000
F(2,6)=676E13 p<0.0000 Std.Error of es timate: .00000
N=9
b* Std.Er r. of b*
b Std.Er r. of b
t(6) p-v alue
Interc ept n, min-1
h, m
0.00000 0.000004 0 1.000000
1.000000 0.000000 16.95600 0.000000 116235962 0.000000
-0.000000 0.000000 -0.00000 0.000004 -0 1.000000
Results from multi-factor regression
Productivity: Qt, kg/h Multiple R = 1.00000000 F = --
R2= 1.00000000 df = 2, 6, No. of cases: 9 adjusted R2= 1.00000000 p = -- Standard error of estimate: .000001787, Intercept: .000000000 Std.Error: .0000045 t( 6) = .00000 p = 1.0000
Rotation speed, n, min-1 b*=1.00 feed level in hopper, h, m b*=-.00 (the significant b* are marked in red)
The range of change in productivity is between 300 kg/h and 540 kg/h. The value within this range is 240 kg/h. This is a sufficient value. It is evident that under these manageable factors, productivity changes at a rate that is convenient for the final selection of the productivity the dispenser will operate at.
Based on the multi-factor experiment for identification of the dependency of productivity on the auger rotation speed and the feed level in the hopper it has been established that the level of feed in the hopper is an insignificant factor. The productivity depends solely on the rotation speed.
Qt = 16.965.n, kg/h (1)
This corresponds to the single-factor experiments that have been performed. After increasing the height from minimum to maximum (full load of the hopper), productivity increases by only 2.5 kg/h. At the area of the centre of the experiment plan, productivity is 424.12 kg/h.
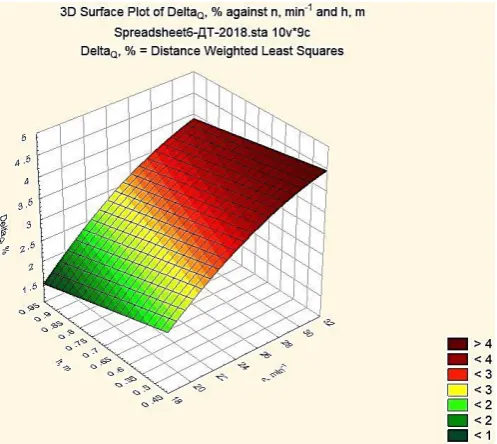
[image:4.595.175.424.450.672.2]2.2 Dependency of the dispensing error on the rotation speed and the feed level in the hopper
Fig -2: Dependency of the dispensing error Δр % on the auger rotation speed n, min-1 and the feed level in the hopper h, m
Table -5:
Multiple Regression Results
© 2019, IRJET | Impact Factor value: 7.211 | ISO 9001:2008 Certified Journal
| Page 12
R2= .98509835 df = 2,6, No. of cases: 9 adjusted R2= .98013114 p = .000003
Standard error of estimate: .104781165
Intercept: .347138889 Std.Error: .2634042 t( 6) = 1.3179 p = .2356
n, min-1 b*=.928 h, m b*=-.35 (the significant b* are marked in red)
Under this model, both factors are significant. Thus, the equation of the dependency of the dispensing error on the auger rotation speed and the feed level in the hopper looks as follows:
ΔQ = 0.347 + 0.159.n – 1.52.h + 18.61.n2 – 7.087.h2, % (2)
Regarding the auger rotation speed, there is a non-linear relationship of second order. This is in contrast to the established linear dependencies both from the single-factor experiments and from the model on productivity in the previous subsection.
This can be explained by the influence of accidental factors, such as change in the grid voltage, different humidity of the batch of the feed used, etc.
Despite this, the range of the error is within the limits of 1.5 % (at the lowest auger rotation speed and the highest feed level in the hopper) to 4.5 % (at the highest auger rotation speed and the lowest feed level in the hopper). These are acceptable values, because they are below the accepted possible values for dispensers of 5 %. This means that under these manageable factors, the error changes insignificantly and this is an indicator of the stability of the dispensing process.
It should be noted that the surface curvature is only significant with respect to the rotation speed and has a lower value.
Nevertheless, the error at the centre of the plan is 2.15 %.
2.3 Dependency of volumetric efficiency during dispensing on the rotation speed and the feed level in the hopper
Fig -3: Dependency of volumetric efficiency Vef on the auger rotation speed n, min-1 and the feed level in the hopper h, m
Table -6:
Regression Summary f or Dependent Variable: U Ef f, - (Spreadsheet6-DT-n-h-alf a-2018.sta) R= .95819030 R?= .91812865 Adjusted R?= .89083821
F(2,6)=33.643 p<.00055 Std.Error of estimate: .00176
N=9
b* Std.Err.
of b*
b Std.Err.
of b
t(6) p-value
Intercept n, min-1
h, m
0.986500 0.004434 222.4846 0.000000 -0.919255 0.116813 -0.001133 0.000144 -7.8695 0.000223
0.270369 0.116813 0.008333 0.003600 2.3146 0.059894
Multiple Regression Results
© 2019, IRJET | Impact Factor value: 7.211 | ISO 9001:2008 Certified Journal
| Page 13
R2= .91812865 df = 2,6, No. of cases: 9 adjusted R?= .89083821 p = .000549, Standard error of estimate: .001763834, Intercept: .986500000 Std.Error: .0044340 t( 6) = 222.48 p = .0000
n, min-1 b*= -.92, h, m b*= .270 (the significant b* are marked in red)
The dependency of volumetric efficiency on the auger rotation speed and the feed level in the hopper is an issue of interest.
The coefficient associated to the factor of feed level in the hopper is insignificant.
U Eff = 0.987 – 0.0011.n, % (3)
The range of change in volumetric efficiency is between 0.964 (at maximum productivity and minimum feed level in the hopper) and 0.973 (at minimum auger rotation speed and maximum feed level in the hopper). It is evident that the volumetric efficiency changes negligibly at the values of these manageable factors and does not have effect on the operation of the dispenser.
At the centre of the plan, the volumetric efficiency has the following value
U Eff = 0.987 – 0.025– 0.007 = 0.962 (4)
The low values of the ranges of change both with respect to the error and with respect to volumetric efficiency are noticeable.
This explains the high level of stability of the process of dispensing using the auger device.
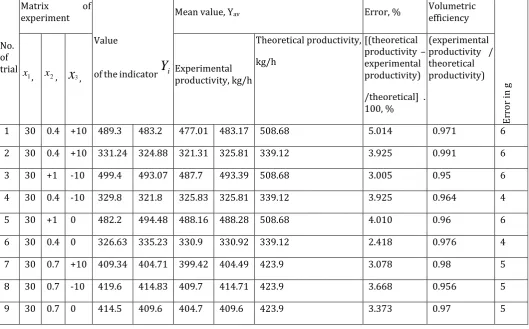
[image:6.595.34.564.390.719.2]2.4 Productivity based on rotation speed and slope
Table -7: Values of productivity at different rotation speeds
No. of trial
Matrix of
experiment
Value
of the indicator
Y
iMean value, Yav Error, % Volumetric efficiency
Er
ro
r
in
g
1
x ,
x
2,x
3,Experimental productivity, kg/h
Theoretical productivity,
kg/h
[(theoretical productivity – experimental productivity)
/theoretical] . 100, %
(experimental productivity / theoretical productivity)
1 30 0.4 +10 489.3 483.2 477.01 483.17 508.68 5.014 0.971 6
2 30 0.4 +10 331.24 324.88 321.31 325.81 339.12 3.925 0.991 6
3 30 +1 -10 499.4 493.07 487.7 493.39 508.68 3.005 0.95 6
4 30 0.4 -10 329.8 321.8 325.83 325.81 339.12 3.925 0.964 4
5 30 +1 0 482.2 494.48 488.16 488.28 508.68 4.010 0.96 6
6 30 0.4 0 326.63 335.23 330.9 330.92 339.12 2.418 0.976 4
7 30 0.7 +10 409.34 404.71 399.42 404.49 423.9 3.078 0.98 5
8 30 0.7 -10 419.6 414.83 409.7 414.71 423.9 3.668 0.956 5
© 2019, IRJET | Impact Factor value: 7.211 | ISO 9001:2008 Certified Journal
| Page 14
Fig -5: Dependency of productivity Q kg/h on the auger rotation speed n, min-1 and the auger slope, º
Multiple Regression Results
[image:7.595.169.433.354.408.2]Dependent: Qd, kg/h Multiple R = 1.00000000 F = R2= 1.00000000 df = 2.6, No. of cases: 9 adjusted R2= 1.00000000 p = -- Standard error of estimate: .000002056, Intercept: 16.200000000 Std.Error: .0000043 t( 6) = 3810E3 p = 0.0000, n, min--1 b*=.998 Alfa, degree b*=.065 (the significant b* are marked in red)
Table -8
Regression Summary f or Dependent Variable: Qд, kg/h (Spreadsheet6-DT-korekcia-2018.sta) R=1.00000000 R?=1.00000000 Adjusted R?=1.00000000
F(2,6)=441E13 p<0.0000 Std.Error of estimate: .00000
N=9
b* Std.Err.
of b*
b Std.Err.
of b
t(6) p-value
Intercept n, min-1
Alf a, degree
16 .20000 0 .000004 3809512 0 .000000 0 .997898 0 .000000 15 .73600 0 .000000 93735359 0 .000000 0 .064810 0 .000000 1 .02200 0 .000000 6087795 0 .000000
The range of change in productivity is between 300 kg/h and 530 kg/h. It is evident that under these manageable factors, productivity changes at a rate that is convenient for the final selection of the productivity the dispensing unit will operate at.
Based on the multi-factor experiment for identification of the dependency of productivity on the auger rotation speed and the feed level in the hopper it has been established that both factors are significant for the dispensing process. Productivity depends on both factors.
Qd = 16.2 + 15.736.n + 1.022.у, kg/h (5)
This corresponds to the single-factor experiments that have been performed. In case of a change in the auger slope from minimum to maximum, productivity changed by 11 kg/h.
At the area of the centre of the experiment plan, productivity is 400.62 kg/h.
The auger slope with respect to the horizon is a significant factor for productivity. Each degree brings productivity deviation of 1.1 kg/h. The acceptable deviation is up to 2.5 kg/h. This means that the acceptable deviation from the horizon is up to 2.7º.
2.5 Dependency of error on rotation speed and slope
[image:7.595.175.424.627.738.2]© 2019, IRJET | Impact Factor value: 7.211 | ISO 9001:2008 Certified Journal
| Page 15
Multiple Regression Results
Dependent: DeltaQ, % Multiple R = .98841603 F = 127.2437
R2= .97696626 df = 2.6
No. of cases: 9 adjusted R2= .96928834 p = .000012
Standard error of estimate: .226109794
Intercept: -.712166667 Std.Error: .4676581 t(6) = -1.523 p = .1786
n, min-1 b*=.534 Alfa, degree b*=-.83 (the significant b* are marked in red)
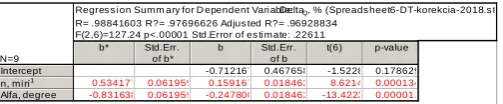
Table -9
Regres s ion Summ ary for D ependent Variable: DeltaQ, % (Spreads heet6-DT-korekcia-2018.s ta)
R= .98841603 R?= .97696626 Adjus ted R?= .96928834 F(2,6)=127.24 p<.00001 Std.Error of es timate: .22611 N=9
b* Std.Err. of b*
b Std.Err. of b
t(6) p-value Intercept
n, min-1
Alfa, degree
-0.712167 0.467658 -1.5228 0.178629
0.534177 0.061959 0.159167 0.018462 8.6214 0.000134
-0.831638 0.061959 -0.247800 0.018462 -13.4223 0.000011
Under this model, both factors are significant. Thus, the equation of the dependency of the dispensing error on the auger rotation speed and the feed level in the hopper looks as follows:
ΔQs = -4.5933 + 0.4782.n – 0.499.h - 0.0064.n2 – 0.01.h. n,% (6)
Regarding the auger rotation speed, there is a non-linear relationship of second order. This is in contrast to the established linear dependencies both from the single-factor experiments and from the model on productivity in the previous subsection.
This can be explained by the influence of accidental factors, such as change in the grid voltage, different humidity of the batch of the feed used, etc.
Despite this, the range of the error is within the limits of 0.2% (at the lowest auger rotation speed and the highest backward slope of the auger, elevation at the outlet) to 4.2% (at the highest auger rotation speed and the lowest forward slope of the auger, lowering of the outlet). These are acceptable values, because they are below the accepted possible values for dispensers of 5 %, which is an indicator of the stability of the dispensing process.
It should be noted that the surface curvature is only significant with respect to the rotation speed, because the error at the centre of the plan is 2.36 %.
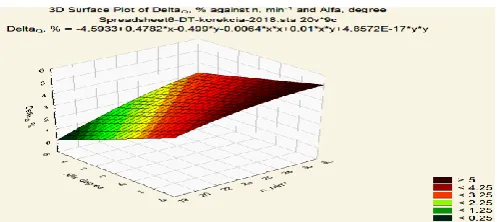
[image:8.595.174.426.266.318.2]2.6 Dependence of volumetric efficiency on the rotation speed and slope
Fig -7: Dependency of volumetric efficiency Vef (based on the theoretical model) on the auger rotation speed n, min-1 and
© 2019, IRJET | Impact Factor value: 7.211 | ISO 9001:2008 Certified Journal
| Page 16
Table -10
Regression Summary f or Dependent Variable: U Ef f, - (Spreadsheet6-DT-n-h-alf a-2018.sta) R= .99483468 R?= .98969603 Adjusted R?= .98626138
F(2,6)=288.15 p<.00000 Std.Error of estimate: .00149 N=9
b* Std.Err. of b*
b Std.Err. of b
t(6) p-value Intercept
n, min-1
Alf a, degree
1.010333 0.003083 327.6890 0.000000 -0.567450 0.041441 -0.001667 0.000122 -13.6931 0.000009
0.817127 0.041441 0.002400 0.000122 19.7180 0.000001
Multiple Regression Results
Dependent: U Eff, - Multiple R = .99483468 F = 288.1500
R2= .98969603 df = 2.6
No. of cases: 9 adjusted R?= .98626138 p = .000001
Standard error of estimate: .001490712
Intercept: 1.010333333 Std.Error: .0030832 t(6) = 327.69 p = .0000
n, min-1 b*=-.57 Alfa, degree b*=.817
The dependency of volumetric efficiency on the auger rotation speed and the auger slope is an issue of interest.
U Eff = 1.01 – 0.0017.n – 0.0039.h (7)
The coefficient associated with the factors of second order is insignificant like it is for the mixed effects.
The range of change of volumetric efficiency is between 0.946 (at the highest auger rotation speed and the lowest backward slope of the auger, lowering at the outlet) to 0.997% (at the lowest auger rotation speed and the highest forward slope of the auger, elevation of the outlet).
This means that at these values of the manageable factors, volumetric efficiency changes negligibly and does not influence the operation of the dispensing unit, with value of the volumetric efficiency of 0.9675 at the centre of the plan.
3. CONCLUSIONS
Based on the data presented in table 1 and fig. 1, the following conclusions can be made:
1. Experimental productivity is lower than the theoretical one;
2. These differences are the result of different factors related to the nature of the material dispensed, the constructive
features of the unit, the kinematic mode of the process, the electrical actuation, etc.
3. It was established that during operation of the dispenser with a single operating auger, the process is unstable and the
dispensing precision error exceeds 18% which is the result of the uneven filling of the interturn space.
4. The established volumetric efficiency (between 0.828 and 0.928 ) has a high dispersion due to the insufficient filling of
the auger;
5. The introduction of a second, compensating auger in the dispenser improves the process stability, reduces the
dispensing error (3.61% at 22.8 min-1) and increases the volumetric efficiency to 0.971 at 22.8 min-1, i.e. the
experimental values for productivity obtained tend to the ones calculated theoretically;
6. Adequate mathematical productivity models have been obtained based on:
a. the auger rotation speed and the feed level in the hopper,
b. rotation speed and slope of the unit,
© 2019, IRJET | Impact Factor value: 7.211 | ISO 9001:2008 Certified Journal
| Page 17
7. Adequate mathematical models of the dispensing error have been obtained based on:
a. the auger rotation speed and the feed level in the hopper,
b. rotation speed and slope of the unit,
c. feed level in the hopper and the slope of the unit;
8. Adequate mathematical models of the volumetric efficiency have been obtained based on:
a. the auger rotation speed and the feed level in the hopper,
b. rotation speed and slope of the unit,
c. feed level in the hopper and the slope of the unit;
REFERENCES
[1] D. Todorov, “Dissertation,” unpublished.
Eng. Dean Todorov, PhD-student Major field of study: Agricultural Engineering.
Assoc. Professor Eng. Bozhidar Kolev, PhD
Major field of study: Agricultural Engineering.