The ontogeny of auditory sensitivity has been studied in birds and mammals and, while there are distinct species differences, the maturation of hearing has been shown to follow a predictable pattern (Rubel, 1984; Rubel et al. 1984). Auditory capacity is first evident in the middle frequencies and then expands rapidly into the higher and lower frequency range. Hearing sensitivity improves in a monotonic fashion, reaching an asymptotic or ‘adult-like’ condition, in most species, within several weeks of hatching or birth. In addition, the frequency-resolving power of the auditory system is at first quite poor, but it improves significantly as development progresses (Saunders et al. 1980; Rebillard and Rubel, 1981; Rubel, 1984; Rubel et al. 1984).
Descriptions of functional auditory development suggest that the maturation of frequency range, threshold sensitivity and resolution all attain adult-like capability at approximately the same time (Rubel, 1984). The time required to achieve a final level of auditory maturation, however, varies among species. As might be expected, this plateau in functional development coincides roughly with the maturation of auditory structures within the peripheral ear.
The contribution of the middle-ear system to hearing development has recently been investigated in a precocial bird
(Cohen et al. 1992b,c) and three species of altricial rodents (Cohen et al. 1992a, 1993; Doan et al. 1994, 1995). These studies showed a clear relationship between the development of middle-ear structures and the functional maturation of middle-ear sound conduction. In all cases, when the structural development of the middle ear was complete, adult-like sound conduction was exhibited.
All reptiles exhibit precocial sensory-motor capacity at the time of hatching. In addition, body size, including the skull, increases throughout life. It is possible that components of the middle-ear system also expand as the skull becomes larger. Indeed, such a change in the middle-ear apparatus has been reported for the alligator lizard (Gerrhonotous multicarinatas) (Rosowski et al. 1988) and was accompanied by improvements in middle-ear sound admittance measured at the tympanic membrane. Improved sound conduction through the middle ear could result in better hearing sensitivity. This appears to be the case in a medium-sized gecko Underwoodisaurus milii (B. M. Johnstone and Y. L. Werner, unpublished observations). These investigators noted that the audiogram, when measured objectively using electrophysiological responses from the peripheral auditory system, seemed to be more sensitive in adults than in juveniles.
487
The Journal of Experimental Biology 201, 487–502 (1998)Printed in Great Britain © The Company of Biologists Limited 1998 JEB1053
Gekkonoid lizards increase in body size throughout life, and the present study investigates whether changes in auditory function accompany these increases. Middle-ear structures in four groups of animals, adults and juveniles of two gekkonoid species (Eublepharis macularius and Oedura marmorata), were examined. Tympanic membrane velocity and phase were also measured in all four groups. An indication of peripheral auditory function was obtained for each group by measuring compound action potentials (CAPs) from the round window membrane. The middle-ear contribution to CAP thresholds was obtained by comparing threshold levels of the CAP response with and without an intact middle-ear system. The results from these
studies indicated that significant changes occurred in middle-ear structure, tympanic membrane velocity and CAP threshold between the younger and older animals. In addition, the adults of both species exhibited better auditory function when the acoustic stimulus was delivered to the tympanic membrane than when it was delivered to the columella footplate. The findings show clearly that increased body size (or age) is accompanied by functional changes in the auditory periphery.
Key words: gekkonoid lizard, auditory function, middle ear, laser interferometry, compound action potentials, Eublepharis macularius, Oedura marmorata.
Summary
Introduction
HOW BODY SIZE AFFECTS MIDDLE-EAR STRUCTURE AND FUNCTION AND
AUDITORY SENSITIVITY IN GEKKONOID LIZARDS
YEHUDAH L. WERNER1, LYNDA G. MONTGOMERY2, SHAWN D. SAFFORD2, PETAR G. IGIC2 AND
JAMES C. SAUNDERS2,*
1Department of Evolution, Systematics and Ecology, Hebrew University of Jerusalem, 91904 Jerusalem, Israel and 2Department of Otorhinolaryngology: Head and Neck Surgery, University of Pennsylvania, Philadelphia, PA 19104,
USA
*Author for correspondence (e-mail: [email protected])
The present study tests the hypothesis that body growth in gekkonoid lizards is accompanied by allometric growth in the structures of the middle ear and that this, in turn, produces improved middle-ear function and hearing capacity. The hypothesis is evaluated by making comparative measurements of the following in juvenile and adult geckos: the sizes of the body and various middle-ear structures; tympanic membrane velocity in response to sound; and compound action potential (CAP) thresholds with the tympanic membrane and columella intact and then excluded. Geckos were selected as the subjects for several reasons. First, their vocal behavior (Frankenberg and Werner, 1992) lends special interest to their auditory function and, second, their auditory physiology seems to be less temperature-dependent than that of many other lizards (Werner, 1972, 1976). We used geckos of two species: Eublepharis macularius Blyth (Gekkota: Eublepharidae), and Oedura marmorata Gray (Gekkota: Diplodactylinae).
Materials and methods Animals
Eublepharis macularius were bred in captivity at the Center for Reptile and Amphibian propagation, Boerne, TX, USA. The animals were received in late June 1994 and used in experiments during July 1994. Juveniles were 3–6 weeks old when studied, while the adults were healthy females 8–12 years old. Voucher specimens have been deposited in the Hebrew University reptile collection: HUJ-R 18885-18900. Oedura marmorata were collected by N. Werner and Y. L. Werner in Western Australia from granite outcrops 6–8 km north of Mount Magnet township, during September–October 1993 and were used in experiments during June–July 1994. Maturation in O. marmorata takes 5 years and is accompanied by color change (Cogger, 1957; Y. L. Werner, personal observation). Thus, we estimated that, at the time of capture, the juveniles were up to 2.5 years old and the adults were at least 4.5 years old. Voucher specimens are also in the Hebrew University collection: HUJ-R 18934–18944.
Collecting in Australia and exporting to the United States occurred under permits SF001105 from the Department of Conservation and Land Management of Western Australia, and PWS-P935483 from the Australian Nature Conservation Agency. At the University of Pennsylvania, all geckos were maintained and tested under a protocol approved by the Institutional Animal Care and Use Committee.
From the time of capture or receipt until the time of testing (except during transportation), the animals were housed in small groups in glass terraria with adequate sheltering material and free access to water. They were fed mealworms, waxmoth larvae (in Australia) or crickets three times a week. The maintenance and testing temperatures are described below, and all subjects were in good health at the time of testing.
Four groups of animals were used: adult and juvenile E. macularius, and adult and juvenile O. marmorata. Between five and eight individuals were examined in each group. Small animals were considered to be juveniles, while large animals
were considered adults. Thus, the concepts of size and age are treated here as synonymous.
Temperature regime
The dependence of the reptilian audiogram on both the experimental and acclimation temperatures (Werner, 1972, 1976, 1983), and our desire to provide data of comparative value, encumbered the experimental design (Werner, 1989). The animals were housed at a constant 25 °C in a 12 h:12 h light:dark cycle. Physiological experiments were conducted near the preferred body temperature of each species, which was maintained with an electric thermal blanket, rectal temperature sensor and temperature controller (Werner, 1976). The experimental temperature was 30 °C for E. macularius (M. G. Angilletta, L. G. Montgomery and Y. L. Werner, unpublished data) and 34 °C for O. marmorata (Angiletta and Werner, 1998).
Anesthesia
Small animals require allometrically larger doses of anesthetic (Sedgwick, 1986). Following Wever (1978), we used a solution of 20 % urethane in reptilian saline. The initial dose was 0.012 ml g−1. Additional doses (each 20 % of the initial dose) were needed in the smaller geckos.
General procedure
The peripheral auditory system of each lizard was examined in four separate studies consisting of (1) structural evaluation of the middle-ear system; (2) measurements of tympanic membrane velocity during sound stimulation; (3) an evaluation of peripheral auditory function using electrophysiological recordings of the compound action potential (CAP); and (4) an evaluation of auditory sensitivity again using the CAP response but with the middle-ear system removed. In practice, the structural evaluation was performed last.
Morphological measurements of the middle ear Various middle-ear structures were quantitatively measured to evaluate the hypothesis that overall growth of the animal was accompanied by changes in the size of these structures. Body mass in grams and the rostrum–anus (snout–vent) length (in mm) were measured. The changes in these body size variables, and the sizes of various middle-ear components (see below), between juveniles and adults were evaluated with independent-sample t-tests. Changes in tympanic membrane and columella footplate area were also correlated with body length. In addition, the middle-ear area ratio and mechanical lever ratio were calculated and compared between juveniles and adults.
Tissue preparation
489
Lizard middle ear
whole body was fixed in 10 % buffered formalin (pH 6.5) for 2 weeks, and then stored in 70 % ethanol.
The first aspect measured was the area of the opening to the external auditory meatus. A series of dissections was then performed, with the aid of an operating microscope, to expose or remove various aspects of the middle-ear system. The first dissection removed portions of the lateral skin and muscle around the ear canal to expose the tympanic membrane completely. The tympanic membrane was then excised along its perimeter and the columella footplate separated gently from the oval window. Finally, the tympanic membrane, the extracolumella and the columella were removed from the middle-ear cavity.
Morphological measurements
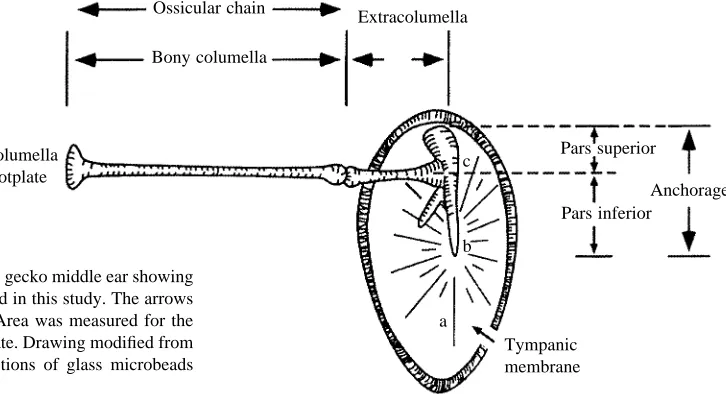
Fig. 1 indicates the structures of the conductive apparatus that were measured after each stage of the dissection. The measurements were obtained by placing the specimen in the optical axis of a Nikon Multiphot macrophotography system equipped with a high-resolution television camera. The video output from the camera was connected to a computer-aided image-analysis and morphological measurement system (JAVA, Jandel Inc.). This measurement system allowed direct video imaging of the middle-ear dissections. The images were contrast-enhanced so that structures of interest (Fig. 1) could be seen more distinctly. A millimeter rule, placed adjacent to each dissection, provided a calibration standard that was entered into the JAVA program, and this permitted measurements to be expressed directly in metric units.
The side of the head was oriented on the Multiphot stage at right angles to the optical axis. An image of the external opening to the ear canal was then electronically frozen and, using the mouse to guide the cursor, the perimeter of this opening was traced on the image. From this tracing, the computer calculated the area of the opening in square millimeters. Following the various dissections, the areas of the tympanic membrane and the columella footplate were obtained in a similar manner.
The total length of the ossicular chain, from its articulation with the extracolumella anchorage to, and including, the footplate was measured. These were obtained after the ossicular apparatus had been removed from the middle ear. The extracolumella was then separated from the bony columella, and the lengths of both segments were determined. The bony columella length was measured from its insertion point with the extracolumella to the most distant point on the inner surface of the footplate. The length of the extracolumella was measured from its attachment with the extracolumella anchorage to its articulation with the bony columella (see Fig. 1).
The tympanic membrane was placed face down on the microscope stage and smoothed out so that the extracolumella anchorage could be seen clearly from above. Three measurements were made of the anchorage (see Fig. 1): (1) the length of the pars superior portion, from the approximate center axis of the extracolumella to the distal tip of the superior leg of the anchorage; (2) the total length of the extracolumella anchorage from the tip of the superior process to the tip of the inferior process; and (3) the length of the inferior process (pars inferior) of the anchorage from the center of the extracolumella to the tip of the inferior process.
From these measurements, the area ratio was obtained by dividing the tympanic membrane area by that of the columella footplate. Similarly, the lever ratio was calculated by dividing the total extracolumella anchorage length (the length of the pars superior and the pars inferior) by the length of the pars superior. This ratio defines the second-order lever system of the reptilian middle ear and has been described fully by other authors (Wever and Werner, 1970; Manley, 1990).
Tympanic membrane velocity
The possibility that size changes in the conductive apparatus produce functional changes in sound transmission through the middle-ear system was evaluated by using laser interferometry to measure tympanic membrane velocity and phase in juveniles and adults of both species. The tympanic membrane velocity
Ossicular chain
Bony columella
Extracolumella
Columella footplate
Tympanic membrane c
b
a
Pars superior
Pars inferior
Anchorage
[image:3.609.202.565.73.270.2]and phase were examined during constant sound pressure level (SPL) stimulation of the tympanic membrane. These measures provided an indication of the tympanic membrane velocity transfer function, which describes how sound energy in the acoustic signal is transferred to a velocity and phase response in the tympanic membrane.
Preparation
Animals were anesthetized, and a small amount of soft tissue at the entrance to the ear canal was removed to reveal the tympanic membrane. Wax, dirt, ear mites and other debris were removed gently from the membrane surface. The animal was positioned on its back, and the head stabilized on a metal plate with Plasticine. The animals were placed on their backs for consistency with later experiments (see below). The metal plate was secured to a heavy-duty x–y stage which, in turn, was placed on a large granite stone located in a sound-attenuated room. The stone was isolated from the table top by vibration dampers. The x–y stage allowed the animal to be moved in these axes with micrometer accuracy.
Acoustic stimuli and calibration
Free-field stimulation was used in these experiments. A 14 cm midrange speaker (model 405–8H, Altec Lansing Inc.) was suspended approximately 12 cm above the head of the lizard. Pure-tone stimuli from the speaker were generated with a computer-controlled frequency synthesizer (model system one, Audio Precision Inc.). The synthesizer was programmed to increase, in a stepwise fashion, through 77 frequencies between 0.15 kHz and 20.0 kHz. A calibrated probe tube (5.0 cm long, 0.5 mm internal diameter) was connected to a 12.5 mm condenser microphone. The tip of the probe tube was positioned at the perimeter of the tympanic membrane. During calibration, the synthesizer stepped through all the test frequencies keeping the voltage across the loud speaker constant. The output signals from the probe-tube microphone were connected to the analyzer section of the synthesizer. The analyzer section measured the voltage component of each test tone as detected by the microphone. Low-frequency noise in this measurement was eliminated by using a moving one-third octave filter centered about each test tone. This filter was a built-in function of the analyzer. A look-up table was created (under software control) with test frequency and voltage in adjacent columns. The software then calculated corrections for each frequency so that the voltage delivered to the speaker by the generator portion of the synthesizer would produce a constant SPL of 100 dB at the surface of the tympanic membrane. All decibel measures were referenced against 20µPa. Once the acoustic system was calibrated, the interferometer laser beam was focused on the tympanic membrane.
Interferometer methods and procedures
The optical head of the laser interferometer was located 20 cm from the tympanic membrane and secured to an x–y–z micromanipulator. Thus, it was possible to move either the
animal or the laser head to bring the laser beam into alignment with the tympanic membrane.
Glass microbeads, 15–30µm in diameter and weighing between 5 and 10 ng (Bigelow et al. 1996), were placed at three locations on the tympanic membrane, and the velocity and phase response of the membrane were measured at each location. These positions were (1) at the anterior quadrant of the membrane approximately mid-way between the conical tip and the anterior edge of the membrane, (2) at the conical tip of the membrane at the end of the inferior process of the extracolumella anchorage, and (3) along the axis of the extracolumella anchorage at the point where the shaft of the extracolumella articulated with the anchorage. These positions are illustrated in Fig. 1 and in the inset to Fig. 6A.
The tip of a single human body hair was used to pick up the microbead and deposit it onto the membrane surface. These beads adhered securely to the surface because of the thin layer of cerumen covering the membrane (Cohen et al. 1992c). The glass bead increased the reflectance of the laser beam by over 300 % compared with the reflectance of the tympanic membrane surface alone. The alignment of the laser beam with the glass bead was adjusted until a reflected component was detected with maximum signal strength. These procedures significantly improved the signal-to-noise ratio of the velocity signals detected by the interferometer (Cohen et al. 1992c).
The synthesizer was then instructed (through software) to step through the 77 test frequencies and each was presented at 100 dB SPL. The output signal from the interferometer was connected to the analyzer section of the synthesizer and, as each tone was presented, a voltage signal proportional to the velocity of the tympanic membrane was stored in the computer memory. At the same time, the phase response of the membrane was also stored. The phase response was referenced to that of the probe-tube microphone. A real-time plot of velocity and phase appeared on the computer monitor as the synthesizer stepped through the test tones.
Data analysis
Between five and six animals were used in each juvenile and adult group. The mean and standard error of the mean (S.E.M.), at all frequencies, were calculated for each group. The averaged tympanic membrane frequency response plots were subjected to a smoothing procedure which calculated the running average for a window of six adjacent test frequencies. This window was systematically moved in one-step intervals through the entire frequency range. The smoothing procedure helped eliminate local perturbations of the frequency response curve due to small anomalies in calibration or unique response properties of the tympanic membrane at the point of measurement.
Compound action potential responses
491
Lizard middle ear
nerve fibers. The sensitivity of this response, when plotted at different frequencies, defines a CAP audiogram and provides an indication of function in the peripheral auditory system. These audiograms were used here to reveal differences in auditory sensitivity (measured at the cochlea) as body size changed. Note that CAP ‘thresholds’, CAP ‘sensitivity’ and CAP ‘audiograms’ as used here indicate only events at the level of the cochlea and auditory nerve. Any changes in hearing, as defined behaviorally, are not predicted directly by the CAP responses. This series of experiments was performed on the same subjects in which the tympanic membrane velocity was measured and subsequent to those measurements. Preliminary work revealed that the velocity measurements would be affected by the surgery required for the CAP studies. Surgical preparation
An incision was made in the ventral surface of the lower jaw in a caudal–rostral direction to reveal the underlying muscles, which were then separated to expose the middle-ear cavity. Small insect pins with bent ends served to retract the muscles. With the muscles retracted laterally, the inner surface of the tympanic membrane, the columella and the round-window membrane were revealed.
Acoustic stimuli and calibration
A 25 mm flange attached to one end of a sound tube (6.25 mm diameter, 63 mm long) was secured to, and sealed over, the acoustic opening of a headphone (model DT-48, Beyer Dynamics Inc.). The headphone was attached to an x–y–z manipulator which facilitated placement of the sound tube. The position of the sound tube was adjusted so that it formed a tight seal over the tympanic membrane, which had been partially exposed for the velocity experiments (see above). The SPL at the end of the sound tube was calibrated with a probe-tube microphone (model ER-7, Entyomotic Inc.). The probe tube itself was constructed from polyethylene tubing (0.5 mm i.d., 5 cm long) and was inserted into the center of the sound tube. The tip of the probe tube extended beyond the end of the sound tube by approximately 2 mm, and when the sound tube was sealed over the tympanic membrane, the probe tube lay within 1 or 2 mm of the membrane surface. The probe tube was attached to a calibrated microphone and the voltage output of the microphone was converted to dB sound pressure level (SPL) relative to 20µPa.
At the start of a test session, the acoustic stimulus was calibrated at each of 14 test frequencies using the synthesizer and the same procedures described above to generate tones and measure the microphone response. The sine-wave output from the synthesizer was connected to an electronic switch to produce tone bursts. The tone bursts, each with a rise and decay time of 5 ms and a plateau of 30 ms (total duration 40 ms), were delivered to the ear at a rate of 8 s−1. Sound intensity was varied
under computer control over the range 0–120 dB SPL. Compound action potential recordings
An electrode was formed from a 10 cm length of
Teflon-coated silver wire (0.2 mm diameter) by cutting one end with a razor blade and then removing about 1.0 mm of Teflon from the tip. The wire was straightened and mounted in an electrode holder attached to a micromanipulator. The electrode was positioned so that the exposed tip was in contact with the round-window membrane. Reference electrodes were placed in the adjacent muscles of the jaw. The output from the round-window electrode was amplified 20 000 times, filtered (bandwidth 0.01–3.0 kHz), and displayed on an oscilloscope. The sweep of the oscilloscope was synchronized to the presentation of the tone bursts. The signal-to-noise level of the evoked potential was enhanced by signal averaging. A maximum of 124 sweeps contributed to each average, and this took approximately 15 s to obtain. If a response was apparent in fewer sweeps, the averaging process was terminated.
Thresholds were obtained at 14 frequencies from 0.2 to 20.0 kHz. The tone-burst intensity was set initially to a suprathreshold level of 110 dB. If an averaged CAP response was observed, the intensity was decreased by 10 dB and another average obtained. The stepwise decrements in stimulus level continued until an averaged response was no longer identified above the background noise. The tone burst intensity was then increased by 5 dB and a final average obtained. The threshold was defined as that SPL half-way between those steps where a response was and was not detected. This procedure was repeated for each test frequency. Further details of this method for estimating the CAP threshold have been reported elsewhere (Saunders et al. 1980; McFadden and Saunders, 1989).
Data analysis
The thresholds (in dB) at each frequency were averaged across the subjects in each group to generate a composite CAP audiogram. A two-way analysis of variance (ANOVA) was conducted using a general linear model where one factor was animal size (juvenile or adult) and the other was frequency. The statistical analysis was conducted on the dB SPL threshold values rather than the threshold pressures.
Determination of CAP thresholds after exclusion of the middle ear
Differences in auditory sensitivity between animals of different sizes could result from alterations in middle-ear sound conduction, from sensitivity changes in the inner ear, or from changes in the response properties of the cochlear nerve. In order to understand better the middle-ear contribution to CAP thresholds, the role of the conductive apparatus was assessed by excluding it from the system. The CAP thresholds obtained from the intact middle ear, as described above, were used as the reference data for these experiments. The CAP thresholds were then redetermined after excising the conductive apparatus and directly stimulating the footplate and oval window. Surgical preparation
of its shaft. The tympanic membrane was cut around its perimeter and, together with the distal stump of the columella, was removed through the external ear canal.
Acoustic stimuli and calibration
Tone burst stimuli were used with the same parameters and repetition rate, and at the same 14 test frequencies, as described above. The sound tube was modified by placing a plastic cap over its open end. This cap extended the length of the sound tube by 5 mm and reduced the orifice at the open end to a diameter of 2.5 mm. The polyethylene tubing of the probe tube was then extended into this cap so that SPL could be determined as close as possible to the end. The sound tube was then placed over the stump of the columella and gently pressed onto the bony surface around the oval window. A small amount of petroleum jelly, rubbed onto the open end of the cap, ensured a tight seal against the bone. Calibration with the probe tube provided an indication of the tone burst SPL (at each test frequency) acting on the surface of the columella footplate. Procedures and data analysis
The threshold difference in the CAP audiograms, between stimulation of the intact tympanic membrane and stimulation of the columella footplate, provided an indication of the sound conduction efficiency through the intact middle ear. The CAP thresholds for each frequency obtained after excising the conductive apparatus were subtracted from those obtained with the intact middle ear in each animal. The resulting curve, averaged over all subjects in each age group, defined the transmission loss (in dB) and provided an indication of the change in sound transmission due to exclusion of the middle ear. These indications of middle-ear function (the transmission losses expressed in dB) were compared between juveniles and adults of the same species using a two-way ANOVA. Additional details of this procedure and the interpretation of transmission loss functions can be found elsewhere (Wever and Werner, 1970; Werner and Wever, 1972; Wever, 1978).
Results Morphological analysis
Table 1 summarizes the means and S.E.M. for each of the variables measured for both the juveniles and adults of the two species. The results of unpaired t-tests between the two groups are also shown. There were significant differences in body mass and snout–vent length between juveniles and adults of both species. E. macularius body mass and length increased by 379 % and 118 %, respectively, while in O. marmorata they increased by 149 % and 42 %, respectively, from juvenile to adult individuals. Statistically reliable increases in head length and width were also found in both species (results not shown). Accompanying these changes in body size were significant differences in the area of the external ear opening, the tympanic membrane and the columella footplate. The tympanic membrane area increased from juvenile to adult in E. macularius by 250 % and in O. marmorata by 56 %. The
footplate growth in both species was smaller (95 % and 30 %, respectively). Fig. 2 shows the relationships between tympanic membrane and columella footplate area and snout–vent length. Individual values for juvenile and adult animals are plotted for both species and the solid lines represent the linear regressions for these data. In Fig. 2A, the correlations between these variables were 0.98 (P<0.01) and 0.93 (P<0.01) for E. macularius and O. marmorata, respectively. The relationship between footplate area and snout–vent length in Fig. 2B reveals a correlation for E. macularius that was 0.93 (P<0.01), while for O. marmorata it was 0.59 (P<0.05). The greater growth of the tympanic membrane relative to the footplate resulted in an increase in the adult area ratio (hydraulic amplification) by 81 % and 20 % in the two species, respectively.
The area ratios presented in Table 1 were calculated using the total tympanic membrane area rather than the ‘effective’ area (two-thirds of the total area) as suggested by von Bèkèsy (1960). We used the total area because the ‘effective’ area for the lizard tympanic membrane is unknown.
Bony columella length and extracolumella anchorage length showed significant differences between animal sizes (Table 1).
Snout–vent length (mm)
Eublepharis macularius
Adults Juveniles
Oedura marmorata
Adults Juveniles
A
B 0
0.2 0.4 0.6 0.8 1.0
40 60 80 100 120
0 10 20 30 40
Columella footplate area (mm
2)
Tympanic membrane area (mm
2)
[image:6.609.321.553.71.394.2]493
Lizar
[image:7.609.51.722.139.467.2]d middle ear
Table 1. Comparison between juvenile and adult middle-ear structure in two gecko species
Tympanic Ossicular Bony Pars Pars External
Body Snout–vent membrane Footplate chain Extracolumella columella Extracolumella superior inferior ear
mass length area area Area length length length anchorage length length Lever opening
Animal (g) (mm) (mm2) (mm2) ratio (mm) (mm) (mm) (mm) (mm) (mm) ratio (mm)
Eublepharis macularius
Juvenile 3.34 52.32 7.97 0.40 19.93 1.40 0.32 1.07 1.71 0.33 1.48 5.57 3.58
S.E.M. 0.41 0.99 0.20 0.02 1.34 0.03 0.03 0.05 0.15 0.01 0.07 0.27 0.30
N=5–6
Adult 16.01 113.9 27.87 0.78 35.73 3.73 0.64 3.09 3.23 0.63 2.60 5.17 7.61
S.E.M. 3.44 2.0 0.97 0.03 1.53 0.12 0.03 0.10 0.09 0.04 0.97 0.25 0.15
N=6–8
t 3.32 24.91 17.4 9.55 7.48 19.1 7.68 17.83 8.82 7.66 11.21 1.10 12.22
d.f. 9 12 12 12 11 10 10 10 10 10 10 10 10
P <0.01 <0.01 <0.01 <0.01 <0.01 <0.01 <0.01 <0.01 <0.01 <0.01 <0.01 >0.05 <0.01
Oedura marmorata
Juvenile 8.18 67.30 9.56 0.32 29.88 1.62 0.38 1.22 2.13 0.46 1.66 4.79 1.74
S.E.M. 5.05 2.43 0.68 0.02 1.65 0.11 0.06 0.13 0.06 0.03 0.07 0.37 0.13
N=5–6
Adult 20.36 95.61 14.89 0.43 34.62 2.46 0.54 1.95 2.78 0.58 2.15 4.98 2.76
S.E.M. 1.11 2.17 0.87 0.02 2.91 0.12 0.06 0.08 0.04 0.03 0.03 0.19 0.21
N=5–7
t 2.35 8.53 4.70 3.79 2.59 5.40 1.74 5.03 7.89 1.88 7.11 0.51 3.67
d.f. 8 11 11 10 10 10 10 10 10 10 10 10 10
P <0.05 <0.01 <0.01 <0.01 <0.05 <0.01 >0.05 <0.01 <0.01 >0.05 <0.01 >0.05 <0.01
Area ratio is tympanic membrane area:footplate area.
However, the calculated values of the lever ratio did not change significantly, in both species, indicating isometric growth in the length of the extracolumella anchorage and the pars superior. This observation was true even in O. marmorata, where the pars superior did not show a significant increase in length.
In juvenile and adult O. marmorata, we observed qualitative differences in the degree of ossification of the bony columella. The juvenile columella was pliable along the entire length of its shaft, whereas in the adult it was fully ossified. In juvenile E. macularius, the bony portion of the columella was ossified for over two-thirds of its length from the columella footplate and cartilaginous over the remaining portion. The columella in the adult appeared to be fully ossified. The changes in head size in both species were accompanied by an overall expansion of the middle-ear cavity. We were unable to measure directly the volume of this cavity because of the size and complexity of the Eustachian tube opening. This opening was large and allowed the middle-ear space to communicate widely with the oral cavity.
The morphological examination revealed that the overall differences in body size were accompanied by size increases in the middle-ear structures of both species. While no gain in the mechanical lever ratio was found, both species showed an increase in the area ratio, which should produce a gain in the middle-ear pressure amplifier.
Tympanic membrane velocity
Fig. 3A shows the frequency response curve at the columella insertion point of the tympanic membrane for E. macularius juveniles and adults. The juvenile curve between 0.6 and 1.6 kHz rises at a rate of approximately 16 dB per octave. Between 1.6 and 5.0 kHz, the response was relatively flat with a peak-to-peak velocity of approximately 1 mm s−1.
From 5.0 to 10.0 kHz, the tympanic membrane response declined at a rate of approximately 25 dB per octave. The results for the adult animal show a change in the shape of the tympanic membrane response curve. A peak can be identified at 2.2 kHz with a maximum velocity of 2.15 mm s−1. The rates
of decline in the adult response, on either side of this peak, were approximately 14 dB per octave on the low-frequency side and 15 dB per octave on the high-frequency side. The most pronounced differences in the velocity curves between juveniles and adults were a sharpening of the resonant peak and the loss of high-frequency sensitivity in adults. Fig. 3B shows the ratios between the adult and juvenile tympanic membrane transfer functions. The data in this figure were obtained by calculating the ratio of the velocity results (adult divided by juvenile) at each test frequency and then expressing it as a dB value. The results in Fig. 3B show that there is a mean gain of approximately 3–4 dB in the adult response between 0.3 and 1.0 kHz. Between 1.1 and 1.7 kHz, there is a 2–3 dB loss. A second region of gain as large as 7 dB occurs between 2.0 and 2.7 kHz. Finally, a loss of sensitivity in the adult response of as much as 14 dB is seen between 3.0 and 12.0 kHz. Above 13.0 kHz and below 0.3 kHz, the
tympanic membrane responses of the adults and juveniles were similar.
Fig. 4A shows the velocity results from the tympanic membrane for O. marmorata. In this species, the juveniles exhibited a low-frequency tympanic membrane response between 0.2 and 3.0 kHz that grew at a rate of 8 dB per octave. The velocity response remained relatively constant at 0.9 mm s−1 between 3.0 and 5.0 kHz, while from 5.0 to
15.0 kHz the response declined at a rate of 18 dB per octave. The tympanic membrane response of adult O. marmorata differed from that of the juvenile in having a relatively sharp resonant peak at 2.5 kHz. The low-frequency response declined from the peak at a rate of 11 dB per octave, while the high-frequency response declined at 17 dB per octave. The ratio (in dB) between these velocity functions is presented in Fig. 4B. Between 0.25 and 3.0 kHz, the adult tympanic membrane response had a gain of approximately 3–7 dB relative to the juvenile response. Above 5.0 kHz, the response was up to 15 dB less sensitive than in the juvenile.
In summary, both E. macularius and O. marmorata showed
Columella
0.01 0.1 1 10
Juveniles, N=6 Adults, N=6 Eublepharis macularius
−20 −15 −10 −5 0 5 10
A
B 0.1 0.3 0.6 1.0 3.0 6.0 10.0 20.0
Peak-to-peak velocity (mm s
−1)
Difference (dB)
Frequency (kHz)
[image:8.609.315.557.73.420.2]495
Lizard middle ear
a change in the tympanic membrane velocity function with increasing body size. As size increased, there was a sharpening of the peak response and a downward shift in peak frequency. The larger animals of both species showed a tendency towards enhanced velocity at low frequencies and reduced velocity in the high frequencies when compared with the smaller animals. The tympanic membrane phase response at the location of the columella for both species is shown in Fig. 5. Juvenile E. macularius (Fig. 5A) appear to have a slightly lower phase delay than the adults, although the shape of the two functions is similar. Across the test frequencies examined (0.15–20.0 kHz), the phase delay increased from approximately −100 ° to approximately −1300 °. The results for O. marmorata (Fig. 5B) show that the phase responses in adults and juveniles were nearly identical. The phase lag increased from approximately −50 ° in the low frequencies to between −1600 and −2100 ° at the highest frequency.
The results in Fig. 6A use adult velocity functions in O. marmorata as an example to describe the tympanic membrane
response measured from three locations on the membrane surface; the anterior surface of the membrane, the tip of the inferior process and over the insertion point of the extracolumella. The small drawing in Fig. 6A illustrates these locations. The three curves are approximately parallel below 10.0 kHz, but vary widely above that frequency. The largest velocity responses were found in the anterior part of the tympanic membrane, while the lowest were measured at the insertion point of the extracolumella. The ratio (in dB) of the velocity values between the tip of the inferior process and the columella represents the lever function of the extracolumella anchorage. Changes in the lever ratio (inferior process velocity/columella velocity) across frequency are illustrated in Fig. 6B. The lever ratio in O. marmorata adults was relatively constant between 0.15 and 5.0 kHz at 2.0–2.3. By 10.0–12.0 kHz, the lever ratio had increased to 5 – 6. At higher frequencies, the results became very variable.
Lever ratios for the juveniles were similar to those calculated for adults (Fig. 6B), except between 5.0 and 12.0 kHz where they were somewhat smaller. The similarities between velocity-derived lever ratios in juveniles and adults correspond well with the anatomically-derived lever ratios given in Table 1. Although both approaches give roughly constant lever ratios as body size changed, the ‘anatomically’-derived ratios of 4.79 and 4.98 were substantially larger than the ‘velocity’-derived ratios of 2.78 and 2.87 (representing the mean of data
−20 −15 −10 −5 0 5 10
Oedura marmorata
0.01 0.1 1 10
Adults, N=6 Juveniles, N=6 Columella
A
B
0.1 0.3 0.6 1.0 3.0 6.0 10.0 20.0
Peak-to-peak velocity (mm s
−1)
Difference (dB)
Frequency (kHz)
Fig. 4. (A) The peak-to-peak velocity function measured from the columella location on the tympanic membrane for groups of adult and juvenile O. marmorata. Values are means +1 S.E.M. (N=6). (B) The ratio in dB between the values plotted in A for juveniles and adults.
−2000 −1500 −1000 −500 0
−2000 −1500 −1000 −500 0
Eublepharis macularius
Oedura marmorata Columella Columella Adult, N=5 Juvenile, N=4
Adult, N=6 Juvenile, N=5
A
B
0.1 0.3 0.6 1.0 3.0 6.0 10.0 20.0
Phase angle (degrees)
[image:9.609.321.562.67.377.2]Frequency (kHz)
Fig. 5. The tympanic membrane phase response in juvenile and adult
[image:9.609.53.295.73.436.2]points between 0.15 and 4.0 kHz in Fig. 6B) for the juveniles and adults, respectively. There could be several reasons for this discrepancy. It is possible that the structural complexity between the articulation of the extracolumella and extracolumella anchorage led to errors in the measurement of pars superior and pars inferior lengths. It is also possible that measuring the pars superior length after removal of the tympanic membrane may have resulted in an underestimation of its length, which would have led to an overestimation of the anatomically derived lever ratio. Finally, it is also possible that the extracolumella anchorage itself does not move as a rigid structure. Parts of it may bend in some way that reduces the functional lever ratio. Bending of the pars inferior at high frequencies has been demonstrated in the tokay gecko (Gekko gecko) (Manley, 1972b, 1990).
Compound action potential responses
Mean CAP thresholds for adults and juveniles are presented in Figs 7A and 8A. The CAP threshold curves of E. macularius adults and juveniles (Fig. 7A) are almost parallel. The most
sensitive thresholds were between 0.5 and 1.0 kHz in both age groups. Interestingly, the adult responses were consistently more sensitive than those of the juveniles by approximately 13 dB across all frequencies. These differences in sensitivity between the two groups were statistically significant (ANOVA: F=53.27; d.f.=1,131; P<0.01). There was also a significant frequency effect (F=37.40; d.f.=13,131; P<0.01). The interaction between body size and frequency, however, was not significant (F=1.50; d.f.=13,131; P>0.05).
The difference between the adult and juvenile CAP thresholds provides an indication of the dB gain of the adults (Figs 7B, 8B). In E. macularius, this difference averaged 8.7 dB between 3.0 and 7.0 kHz and 19 dB between 10.0 and 20.0 kHz.
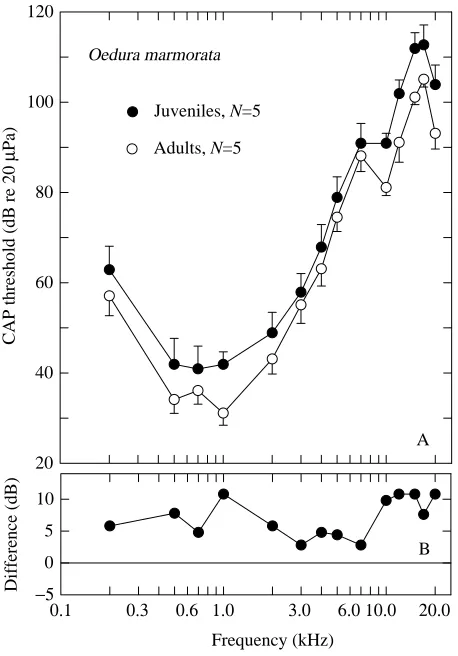
Results for O. marmorata (Fig. 8) were similar: adult CAP responses were on average 7 dB more sensitive than those of the juveniles. The ANOVA revealed a significant size effect (F=22.88; d.f.=1,112; P<0.01) and a significant frequency
Oedura marmorata
0.01 0.1 1 10
Adults, N=5
Inferior process
0 2.0 4.0 6.0 8.0
Columella
A
B Juveniles, N=4
Adults, N=5 Tympanic membrane
0.1 0.4 1.0 4.0 10.0 20.0
Peak-to-peak velocity (mm s
−1)
Lever ratio
Frequency (kHz)
Col Inf TM
Extra columella
Bony columella
Fig. 6. (A) The tympanic membrane response at three locations on the membrane surface (see inset) for adult O. marmorata. Values are means ± 1 S.E.M. (N=5). The arrows in the inset indicate the measurement sites: Col, columella; Inf, inferior process; TM, tympanic membrane. See Fig. 1 for structures of the middle ear. (B) The lever ratio obtained by dividing the velocity response at the inferior process by that at the columella for adult and juvenile O.
mormarata.
Eublepharis macularius
Juveniles, N=5
Adults, N=6
A
B
−10 −5 0 5 10 15 20 25 30
0.1 0.3 0.6 1.0 3.0 6.0 10.0 20.0 20
40 60 80 100
CAP threshold (dB re 20
µ
Pa)
Difference (dB)
Frequency (kHz)
Fig. 7. (A) Compound action potential (CAP) audiograms for sound stimulation to the intact tympanic membrane in juvenile and adult E. macularius. Values are means ± 1 S.E.M. (N=5 for juveniles, N=6 for
[image:10.609.319.555.70.437.2] [image:10.609.45.289.72.383.2]497
Lizard middle ear
effect (F=94.64; d.f.=13,112; P<0.01). The frequency by size interaction, however, was not significant (F=0.37; d.f.=13,112; P>0.05). The dB gain of the adult (Fig. 8B) was relatively constant across frequencies at approximately 7 dB.
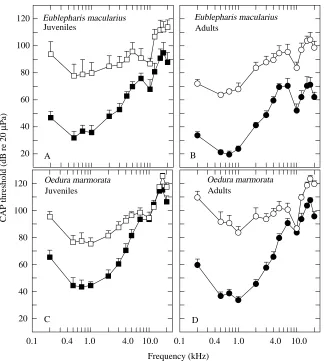
CAP thresholds after exclusion of the middle ear Fig. 9 shows the CAP thresholds from acoustic stimulation of the tympanic membrane or columella footplate (oval window) in all groups. There was a substantial loss in CAP sensitivity in all animals when the middle-ear conductive apparatus was removed. In addition, the general shape of the CAP audiogram after removal of the middle ear changed, being somewhat flatter than the curve obtained with the tympanic membrane intact.
Fig. 10A illustrates the dB transmission loss curve for juvenile and adult E. macularius. Over all frequencies, the adult transmission loss averaged −36 dB while that in the juveniles was −30 dB. The ANOVA revealed that the 6 dB age difference was significant (F=4.66; d.f.=1,125; P<0.05). A significant frequency effect was also noted (F=5.29; d.f.=13,125; P<0.05), but the interaction between animal age and frequency was not significant (F=0.55; d.f.=13,125; P>0.05).
The difference in transmission loss between O. marmorata juveniles and adults was much larger than that found in E. macularius, averaging 15 dB greater in the adults (Fig. 10B) (ANOVA, F=68.0; d.f.=1,112; P<0.01). There also was a significant frequency effect (F=14.5; d.f.=13,112; P<0.01). The interaction between size and frequency, however, was insignificant (F=0.71; d.f.=13,112; P>0.05). Removal of the tympanic membrane had the greatest effect on the frequencies between 0.2 and 2.0 kHz in both age groups (Fig. 10B).
In summary, differences were found in middle-ear sound transmission between juveniles and adults of both species, with the efficiency of sound transmission being better in the adult than in the juvenile gecko. This effect was more pronounced in O. marmorata than in E. macularius.
Discussion
The present study has shown that increasing body size in two gecko species is accompanied by increased tympanic membrane area, columella footplate area, columella length and area ratio. Significant differences were also found in middle-ear sound conduction and CAP sensitivity between juveniles and adults in these two species.
The tympanic membrane velocity functions exhibited the characteristic bandpass shape seen in other reptilian middle ears (Moffat and Capranica, 1978; Saunders and Johnstone, 1972) including other gekkonoid species (Manley, 1972a,b,c). However, previous reports of tympanic membrane velocity in reptiles have rarely exceeded a frequency of 10.0 kHz. The velocity responses we measured above 10.0 kHz were more variable than at lower frequencies (see Figs 3, 4, 6), and the CAP thresholds showed a discontinuity at approximately 10.0–12.0 kHz with a decline in sensitivity at 20.0 kHz (Figs 7, 8). These observations suggest that it is prudent to view the physiological data from these high frequencies with caution.
Size-related changes in CAP sensitivity
Perhaps the most important observations in the present study were the changes in CAP thresholds with body size (Figs 7, 8) suggesting greater sensitivity in adults than in juveniles. The CAP sensitivity varied somewhat between the species, but on average was 7–10 dB better in the adult. The discussion will consider the possible mechanisms that might account for the observed improvement in the CAP thresholds with body size. The first possible mechanism is that the sensory epithelium of the cochlear receptor organ may increase in size throughout life. The auditory receptor epithelium in amphibians and fish expands in area with age (Li and Lewis, 1974; Corwin, 1981; Popper and Hoxter, 1984). Cochlear expansion in these animals is also accompanied by increases in the absolute number of hair cells on the sensory surface. Miller (1966, 1985) examined adults of 10 lizard families as well as a group of animals at different ages from a single species (the scincid lizard Leiolopisma assatum), and concluded that neither papilla length nor hair cell population increased with body size. In birds and mammals, hair cell numbers on the basilar papilla or
20 40 60 80 100 120
Oedura marmorata
Juveniles, N=5
Adults, N=5
−5 0 5 10
A
B
0.1 0.3 0.6 1.0 3.0 6.0 10.0 20.0
CAP threshold (dB re 20
µ
Pa)
Difference (dB)
Frequency (kHz)
Fig. 8. (A) Compound action potential (CAP) audiogram for sound stimulation to the intact tympanic membrane in juvenile and adult O.
marmorata. Values are means ± 1 S.E.M. (N=5). (B) Difference
[image:11.609.59.288.71.399.2]organ of Corti remain constant after terminal mitosis of the sensory epithelium (Engstrom et al. 1966; Tilney et al. 1988). It is also possible that changes in the biophysics of the hair cell and its synaptic junctions occur with age. Increased CAP sensitivity in older animals might result if hair bundle deflections led to greater membrane depolarization and enhanced neurotransmitter release. However, such alterations in hair cell function with aging are unknown. Potential changes in the cochlea with aging should be a target of future investigations.
The second possible mechanism is age-related changes in middle-ear sound conduction. The present study has shown that such changes in conduction contribute to age-related alterations in CAP thresholds in geckos.
Middle-ear function and CAP thresholds
At a detailed level of analysis, the relationships among anatomical, velocity or transmission loss changes in the middle ear and improvements in CAP thresholds are complex. For example, the transmission losses shown in Fig. 10 suggest that the efficiency of middle-ear sound transmission is better in the adult than in the juvenile. Moreover, the efficiency of sound conduction is clearly much better in the adult O. marmorata than in the adult E. macularius. The improvement with age can
be explained partially, in both species, by the pressure advantage caused by the larger area ratio in the adult compared with that of the juvenile (see Table 1). This may also account for the improved adult CAP responses (Figs 7, 8). However, some of our data are inconsistent with this explanation. The area ratio in E. macularius showed a bigger increase than did that of O. marmorata (Table 1), which resulted in a larger improvement (between juveniles and adults) in CAP thresholds in E. macularius (13 dB) than in O. marmorata (7 dB) (see Figs 7B, 8B). On the basis of the improvement in area ratio and CAP threshold in the adults, we expected E. macularius to exhibit the greater transmission loss of the two species after removal of the middle-ear system. However, O. marmorata unexpectedly had the larger transmission loss in CAP thresholds under these conditions (Fig. 10B). The reason for this is unknown.
The shape of the velocity transfer function (measured at the columella location) also differed between juveniles and adults (Figs 3, 4). However, the shape of the CAP audiograms in both age groups (Figs 7, 8) was not predicted well by the tympanic membrane response. For example, the peak response of the adult E. macularius velocity function was approximately 2.2 kHz while the most sensitive CAP threshold was at 0.7 kHz. In addition, the changes with age in the shape of the tympanic
20 40 60 80 100
120 Eublepharis macularius Juveniles
Eublepharis macularius Adults
0.4 4.0
0.1 1.0 10.0 20
40 60 80 100
120 Oedura marmorata
Adults
0.4 4.0
0.1 1.0 10.0 Oedura marmorata
Juveniles
A B
C D
CAP threshold (dB re 20
µ
Pa)
[image:12.609.240.564.70.431.2]Frequency (kHz) Fig. 9. Compound action potential (CAP)
499
Lizard middle ear
membrane transfer functions (the juvenile functions were more broadly tuned while the adult functions had a sharp peak) were not reflected in a change in shape of the CAP threshold curve. The low-frequency tympanic membrane response had a greater peak-to-peak velocity in the adults than in the juveniles. Conversely, the high-frequency velocity response was greater in the juveniles. In contrast, the adult CAP functions, in both species, showed greater sensitivity at all test frequencies and particularly at those below 3.0 kHz. Thus, morphological and functional changes in the middle ear poorly predicted changes in CAP threshold.
Does middle-ear anatomy predict middle-ear function? There are several possible explanations for the discrepancies observed between the morphology and physiology of the conductive system and the electrophysiological responses of the cochlea. These are discussed below.
Middle-ear anatomy
The morphological variables used in the present study are not exclusive, and there are other middle-ear components that could affect middle-ear function (Relkin, 1988; Saunders et al.
1998). We were unable to measure middle-ear cavity volume, but it was clear that the volume of this cavity increased with increasing body size. Growth in the volume of the middle-cavity would decrease the stiffness of air in this space and thus improve (e.g. increase the velocity of an iso-stimulus function) the low-frequency responses of the middle ear (Relkin, 1988). This mechanism might account for the better low-frequency velocity functions found in the adults relative to the juveniles (Figs 3, 4). Additionally, growth in the tympanic membrane, extracolumella (at least in E. macularius), columella and footplate, together with ossification of the columella, would increase the mass of the conductive apparatus. Increased mass would degrade the high-frequency response of the middle-ear system (Relkin, 1988; Saunders et al. 1998). The reduced sensitivity of the adult high-frequency velocity function relative to that of the juveniles of both species (Figs 3, 4) could arise from this process.
The sharpening of the velocity transfer function in the adults of both species suggested a change in the damping and frictional forces of the middle ear (Relkin, 1988). Alterations in the damping factor could result from ossification of the columella, stiffness changes in the annular ligament or alterations to the input resistance of the cochlea. None of these was quantified in the present study.
Even a complete structural analysis of the middle ear would still allow only an approximation of middle-ear function. It was recognized in the early 1960s that a static analysis of the middle ear in terms of pressure amplifiers represents an incomplete description of the system because motion is not taken into account (Zwislocki, 1962, 1963; Møller, 1963, 1965; Mundi, 1965). Motion and pressure amplification are related to each other through the concept of impedance, and the impedant properties of the conductive apparatus impose frequency-dependent boundaries on the process of sound transmission (Relkin, 1988; Saunders et al. 1998). Thus, simple estimates of sound transmission based on area ratios, lever ratios or tympanic membrane pressure amplifier characteristics will not predict completely the nature of the signals reaching the cochlea. At a qualitative level, however, the improvement presently found in the area ratio of the adults suggests more efficient sound conduction. Similar allometric changes in body size and middle-ear structure have been found in the alligator lizard (Gerrhonotous multicarinatus) (Rosowski et al. 1988). The expansion of middle-ear structures in this species was also accompanied by improvements in sound conduction.
Tympanic membrane and footplate velocity
It is possible that the responses recorded from the tympanic membrane do not predict accurately the velocity response of the columella footplate. We noted that ossification of the columella varied between juveniles and adults. This observation, together with changes in the length of the extracolumella and bony columella with increasing body size, could result in differences between the responses of the tympanic membrane and the footplate. Manley (1972b)
−60 −50 −40 −30 −20 −10 0 10
Juveniles Adults Eublepharis macularius
−60 −50 −40 −30 −20 −10 0 10
Oedura marmorata
Adults Juveniles A
B
0.1 0.4 1.0 4.0 10.0 20.0
Transmission loss (dB)
[image:13.609.56.291.70.385.2]Frequency (kHz)
demonstrated that the extracolumella anchorage moved as a single lever arm during low-frequency stimulation, but appeared to bend during stimulation at high frequencies. This bending occurred in the inferior process and greatly reduced the lever action of the anchorage, resulting in less vibratory energy reaching the footplate. The dimensions of the anchorage changed considerably between juveniles and adults in the present study, and the frequency at which the inferior process begins to flex may also depend on body size.
The degree of ossification of the bony columella may also be important. Incomplete ossification could result in a bending action of the columella shaft in the juvenile that is absent in the adult. Saunders (1985) suggested that there may be a rocking motion between the junction of the extracolumella and the columella in the bird middle ear. This rocking motion arises from the angle formed between the shaft of the columella and the structures on the tympanic membrane that form the anchorage (Saunders et al. 1998). Changes in the length of the extracolumella (in E. macularius) and bony columella with age (see Table 1) could alter the frequency of this rocking motion and change the response of the footplate relative to that of the tympanic membrane.
The above suggestions are speculative at this stage, but each could contribute to differences in the transfer function measured at the tympanic membrane and columella footplate. Frequency-dependent differences in the movements of the membrane and the footplate have been reported (Manley, 1972c) in the small Australian gecko Gehyra variegata and in the gecko Phyllurus milli (Saunders and Johnstone, 1972). We were unable to measure directly the footplate response in the present study. Velocity measurements using a laser interferometer require that the target be in a ‘line-of-sight’ relationship to the laser beam. It is possible to focus the beam on the footplate, but the integrity of the tympanic membrane must be compromised and this, of course, will change the response of the middle-ear system.
Werner and Wever (1972) suggested that there was little mechanical lever advantage in the ossicular system of Gekko gecko or E. macularius, and that the impedance-matching capacity of the middle ear was achieved primarily by the hydraulic action of the area ratio. The present study shows that the anatomical organization of the extracolumella anchorage defines a second-order lever (Manley, 1990) whose mechanical advantage is quite large (see Table 1). The velocity functions measured at the inferior tip and columella locations on the drum membrane also revealed the presence of a mechanical lever in both the adult and juvenile. The absence of a lever ratio in the previous study (Werner and Wever, 1972) might be due to the differences discussed above between the membrane and footplate responses, since their estimates of the lever ratio were taken from responses measured in the cochlea.
There is another lever in the middle-ear system, originally described by Helmholtz (1868) and considered further by other authors (Wever and Lawrence, 1954; Tonndorf and Khanna, 1970). This lever is associated with the curved shape of the
tympanic membrane. The observation of large displacements on the anterior surface of the membrane associated with smaller displacements of the membrane at the tip of the inferior process (see Fig. 6A) (Manley, 1990) indicates the action of this lever. However, complex motion vectors due to the curved-membrane effect could result in differences in the velocity functions of the tympanic membrane and the columella footplate.
The middle-ear response and CAP thresholds
It is important to consider the relationship between the shape of the CAP threshold curve and that of the tympanic membrane velocity transfer function. Manley (1990, see Fig. 10.5) compared the shape of the audiogram formed by connecting the characteristic frequencies at the tips of the cochlear nerve tuning curves with the isopotential audiogram of the cochlear microphonic response in Gekko gecko. The shape of these two threshold functions differed from each other considerably. Interestingly, the CAP threshold curves reported here have a shape that is remarkably similar to the cochlear microphonic functions in the Tokay gecko (Gekko gecko). In addition, the shape of the threshold curve formed from the tuning curve characteristic frequencies had a broadly tuned mid-frequency range similar to the broadly tuned tympanic membrane velocity curve reported here in the juveniles (Figs 3, 4). It may be that the tympanic membrane velocity function, like the threshold curve for tuning curve characteristic frequency, is a better predictor of the behavioral threshold curve than are the CAP responses. The mismatch in the shapes of the velocity transfer function and the CAP threshold curve may be due either to the recording geometry of the gecko cochlea, which favors low-frequency responses, or to the loss of neuronal synchronization from 0.6 to 1.0 kHz. The loss of well-synchronized discharges in the eighth nerve would severely reduce CAP amplitude at high frequencies.
Conclusions
In conclusion, changes in body size were associated with improvements in peripheral auditory function in two gecko species. Improvements in middle-ear function may account for the observed enhancement in CAP responses. The quantitative relationships between the morphological and physiological data are more difficult to evaluate owing to the mechanical complexity of the middle-ear apparatus and limitations of our measuring systems.
At present it is not known whether the observations presented here translate to enhanced hearing in adults or whether changes in the auditory periphery compensate for aging in the auditory central nervous system to maintain hearing capacity at a constant level throughout life. Future behavioral threshold data should address these questions.
501
Lizard middle ear
Amy Lieberman, and the generous supply of experimental animals provided by Ron Tremper. Y.L.W. gratefully acknowledges the hospitality and advice of Ken Aplin and the Western Australian Museum.
References
ANGILLETTA, M. J. ANDWERNER, Y. L. (1998). Body temperatures of Australian geckos: A test of the dual preference hypothesis. Copeia (in press).
BIGELOW, D. C., SWANSON, P. B. ANDSAUNDERS, J. C. (1996). The
effect of tympanic membrane perforation size on umbo velocity in the rat. Laryngoscope 106, 71–76.
CAMPBELL, H. W. (1969). The effects of temperature on the auditory sensitivity of lizards. Physiol. Zool. 42, 183–210.
COGGER, H. G. (1957). Investigations in the gekkonid genus Oedura Gray. Proc. Linn. Soc. NSW 82, 167–179.
COHEN, Y. E., BACON, C. K. ANDSAUNDERS, J. C. (1992a). Middle-ear development. III. Morphometric changes in the conducting apparatus of the Mongolian gerbil. Hearing Res. 62, 187–193. COHEN, Y. E., DOAN, D. E., RUBIN, D. M. ANDSAUNDERS, J. C. (1993).
Middle ear development. V. Development of umbo sensitivity in gerbil. Am. J. Otolaryngol. 14, 191–198.
COHEN, Y. E., HERNANDEZ, H. N. AND SAUNDERS, J. C. (1992b).
Middle-ear development. II. Structural development of the chick middle ear. J. Morph. 212, 257–267.
COHEN, Y. E., RUBIN, D. M. ANDSAUNDERS, J. C. (1992c). Middle-ear development. I. Extra-stapedius response in the neonatal chick.
Hearing Res. 58, 1–8.
CORWIN, J. T. (1981). Postembryonic production and aging in inner hair cells in sharks. J. comp. Neurol. 201, 541–553.
DOAN, D. E., COHEN, Y. E. ANDSAUNDERS, J. C. (1994). Middle-ear development. IV. Umbo motion in neonatal mice. J. comp. Physiol. 174, 103–110.
DOAN, D. E., IGIC, P. G. AND SAUNDERS, J. C. (1995). Middle ear
development. VII. The maturation of umbo velocity in the rat. J.
acoust. Soc. Am. 99, 1566–1572.
ENGSTROM, H., ADES, H. W. ANDANDERSSON, A. (1966). Structural
Pattern of the Organ of Corti. Stockholm: Almqvist and Wiksell.
172pp.
FRANKENBERG, E. ANDWERNER, Y. L. (1992). Vocal communication in the Reptilia – facts and questions. Acta zool., Lillona (Tucoman) 41, 45–62.
HELMHOLTZ, H. L. F. (1868). Die Mechanik der Gehoerknochelchen
und des Trommelfels. Pflügers Arch. 1, 1–60.
LI, C. W. AND LEWIS, E. R. (1974). Morphogenesis of auditory receptor epithelia in the bullfrog. Scann. Electron Microsc. 3, 792–797.
MANLEY, G. A. (1972a). Frequency response of the ear of the Tokay
gecko. J. exp. Zool. 181, 159–168.
MANLEY, G. A. (1972b). The middle ear of the Tokay gecko. J. comp. Physiol. 81, 239–250.
MANLEY, G. A. (1972c). Frequency response of the middle ear of
geckos. J. comp. Physiol. 81, 251–258.
MANLEY, G. A. (1990). Peripheral Hearing Mechanisms in Reptiles
and Birds. New York: Springer-Verlag. 288pp.
MCFADDEN, E. A. ANDSAUNDERS, J. C. (1989). Recovery of auditory function following intense sound exposure in the neonatal chick.
Hearing Res. 41, 205–216.
MILLER, M. R. (1966). The cochlear duct of lizards. Proc. Calif. Acad. Sci. 33, 255–239.
MILLER, M. R. (1985). Quantitative studies of auditory hair cells and nerves in lizards. J. comp. Neurol. 232, 1–24.
MOFFAT, A. M. J. ANDCAPRANICA, R. R. (1978). Middle ear sensitivity in anurans and reptiles measured by light scattering spectroscopy.
J. comp. Physiol. 127, 97–107.
MØLLER, A. R. (1963). Transfer function of the middle ear. J. acoust.
Soc. Am. 35, 1526–1534.
MØLLER, A. R. (1965). Experimental study of the acoustic impedance of the middle ear and its transmission properties. Acta otolaryngol. 60, 129–149.
MUNDI, J. R. (1963). The impedance of the ear – a variable quantity.
In Middle Ear Function Seminar (ed. J. L. Fletcher), pp. 63–85. Wright Patterson A. F. B., OH: US Army Medical Research Laboratory Report, Department 576.
POPPER, A. N. AND HOXTER, B. (1984). Growth of the fish ear. I.
Quantitative analysis of hair cell and ganglion cell proliferation.
Hearing Res. 15, 133–142.
RELKIN, E. M. (1988). Introduction to the analysis of the middle ear. In Physiology of the Ear (ed. A. F. Jahn and J. Santos-Sacchi), pp. 103–124. New York: Raven Press.
REBILLARD, G. ANDRUBEL, E. W. (1981). Electrophysiological study of the maturation of auditory responses from the inner ear of the chick. Brain Res. 229, 15–23.
ROSOWSKI, J. J., KETTEN, D. R. ANDPEAKE, W. T. (1988). Allometric
correlations of middle-ear structure and function in one species – the alligator lizard. Abs. Ass. Res. Otolaryngol. 12, 55.
RUBEL, E. W. (1984). Ontogeny of auditory system function. A. Rev.
Physiol. 46, 213–229.
RUBEL, E. W., BORN, D. E., DEITCH, J. S. ANDDURHAM, D. (1984).
Recent advances toward understanding auditory system development. In Hearing Science (ed. C. I. Berlin), pp. 109–157. San Diego, CA: College Hill Press.
SAUNDERS, J. C. (1985). Auditory structure and function in the bird
middle ear: An evaluation by SEM and capacitive probe. Hearing
Res. 18, 253–268.
SAUNDERS, J. C., DOLGIN, K. G. AND LOWRY, L. D. (1980). The maturation of frequency selectivity in C57BL/6J mice studied with auditory evoked response tuning curves. Brain Res. 187, 69–79.
SAUNDERS, J. C., DUNCAN, R. K., DOAN, D. E. ANDWERNER, Y. L.
(1998). The middle ear of reptiles and birds. In Comparative
Hearing: Non Mammals (ed. R. J. Dooling, A. N. Popper and R.
R. Fay). New York: Springer-Verlag (in press).
SAUNDERS, J. C. AND JOHNSTONE, B. M. (1972). A comparative
analysis of middle-ear function in non-mammalian vertebrates.
Acta otolaryngol. 73, 353–361.
SEDGWICK, C. J. (1986). Chemical immobilization of wildlife. Semin.
vet. Med. Surg. (Small Animals) 1, 215–233.
TILNEY, L. G., TILNEY, M. S. AND COTANCHE, D. A. (1988). Actin
filaments, stereocilia and hair cells of the bird cochlea. V. How the staircase pattern of stereociliary lengths is generated. J. Cell Biol. 106, 355–365.
TONNDORF, J. AND KHANNA, S. M. (1970). The role of tympanic
membrane in middle ear transmission. Annls Otol. Rhinol.
Laryngol. 79, 743–754.
VON BEKESY, G. (1960). Experiments in Hearing. New York: McGraw-Hill. 102pp.
WERNER, Y. L. (1972). Temperature effects on inner-ear sensitivity in
six species of iguanid lizards. J. Herpetol. 6, 147–177.
WERNER, Y. L. (1976). Optimal temperature for inner-ear
WERNER, Y. L. (1983). Temperature effects on cochlear function in reptiles: A personal review incorporating new data. In Hearing
and Other Senses: Presentations in Honor of E. G. Wever (ed. R.
R. Fay and G. Gourevitch), pp. 149–147. Groton, CN: Amphora Press.
WERNER, Y. L. (1989). Experimental implications of the
habitat-dependent thermal regimes of ectothermic animals. Eur. J. Physiol. 413, Suppl. 1, R36.
WERNER, Y. L. ANDWEVER, E. G. (1972). The function of the middle ear in lizards: Gekko gecko and Eublepharis macularius (Gekkonidea). J. exp. Zool. 179, 1–16.
WEVER, E. G. (1978). The Reptile Ear. Princeton, NJ: Princeton University Press. 1023pp.
WEVER, E. G. ANDLAWRENCE, M. (1954). Physiological Acoustics. Princeton, NJ: Princeton University Press. 454pp.
WEVER, E. G. ANDWERNER, Y. L. (1970). The function of the middle ear in lizards: Crotaphytus collaris (Iguanidae). J. exp. Zool. 175, 327–342.
ZWISLOCKI, J. (1962). Analysis of middle-ear function. Part I: Input
impedance. J. acoust. Soc. Am. 34, 1514–1523.
ZWISLOCKI, J. (1963). Analysis of the middle-ear function. Part II.