J. exp. Biol. 130, 235-238 (1987) 2 3 5 Printed in Great Britain © The Company of Biologists Limited 1987
MAXIMUM LIFT PRODUCTION DURING TAKEOFF IN
FLYING ANIMALS
BY JAMES H. MARDEN
Department of Zoology, University of Vermont, Burlington, VT 05405, USA
Accepted 13 March 1987
SUMMARY
Maximum lift production during takeoff in still air was determined for a wide variety of insects and a small sample of birds and bats, and was compared with variation in morphology, taxonomy and wingbeat type. Maximum lift per unit flight muscle mass was remarkably similar between taxonomic groups (54-63 N kg"1), except for animals using clap-and-fling wingbeats, where muscle mass-specific lift increased by about 25 % (72—86 N kg"1). Muscle mass-specific lift was independent of body mass, wing loading, disk loading and aspect ratio. Birds and bats yielded results indistinguishable from insects using conventional wingbeats. Interspecific differences in short-duration powered flight and takeoff ability are shown to be caused primarily by differences in flight muscle ratio, which ranges from 0-115 to 0-560 among species studied to date. These results contradict theoretical predictions that maximum mass-specific power output and lift production should decrease with increasing body mass and wing disk loading.
INTRODUCTION
Flying animals display a tremendous diversity of body form and aerial ability. How does variation in morphology affect flight ability? To address this question, it is necessary to define some measure of flight ability. One important component of flight ability is the amount of power and lift an animal can generate by beating its wings. During takeoff in still air, an animal must rely solely on the beating of its wings to create all of the air movement necessary to generate a lift force sufficient to overcome its body weight. Thus, maximum still-air lift production can be quantified by determining the maximum load with which an animal can take off. Maximum load-lifting capacity has not previously been measured and used to make comparisons of lift production ability among a variety of animals.
Numerous theories make predictions about the relationship between morphology, lift production, power output and takeoff ability. One group of theories considers variation in wing size and shape. Savile (1957) used an argument based on general aerodynamic principles to assert that low wing loading, slotting (distal separation of primary feathers) and high aspect ratio should enhance lift production and takeoff ability. Various authors (Pennycuick, 1968, 1969; Epting & Casey, 1973; Rayner,
1979; Ellington, 1984) have proposed that the mass-specific power requirement for hovering is proportional to the square root of wing disk loading, such that animals with relatively longer wings require less induced power to counteract their weight. From this theory it follows that maximum lift production capacity should be inversely proportional to the square root of wing disk loading, since the model predicts that animals with longer wings should produce more lift per unit power output.
Pennycuick (1969, 1972) proposed that maximum power output scales pro-portionally as body mass to the two-thirds power. This model is based on the scaling of wingbeat frequency to body mass, and predicts declining maximum mass-specific power output and lift production with increasing body mass. Pennycuick supported this model with observations of takeoff difficulties of certain large birds.
Hartman (1961) observed that takeoff ability of a wide variety of birds appeared to be correlated with the percentage of body mass composed of flight muscle. Hartman claimed that birds with the highest flight muscle ratios (flight muscle mass/total body mass) had powerful, steeply angled takeoffs, whereas birds with the lowest flight muscle ratios had difficulty becoming airborne.
Weis-Fogh (1973) and Ellington (1984) have proposed that certain animals derive enhanced lift from unsteady aerodynamic effects caused by 'clapping' their opposite wings together and then 'flinging' or 'peeling' them apart. Whether this motion, termed the clap-and-fling wingbeat, causes enhancement in maximum lift pro-duction independent of muscle mass variation has not yet been established.
Experiments presented here utilize a wide variety of insects, and a small sample of birds and bats, to test these hypotheses and to show how maximum still-air lift production and power output of flying animals are related to morphology, taxonomy and wingbeat type.
MATERIALS AND METHODS
Lift production in flying animals 237
Some heavily loaded animals, that could not otherwise take off, became airborne for short distances (<2 body lengths) by jumping, in which case they quickly returned to the ground and it was obvious that they could not take off with that amount of weight. Most of the animals tested could not jump at all (dragonfiies, damselflies, beetles, bats), or only weakly (remaining insect groups, see Table 5). Some birds ordinarily employ a powerful jump during takeoff (see for example Heppner & Anderson, 1985), but in these experiments the tightly wrapped lead weights and tape around their thighs restricted leg movement to such an extent that they could not even walk properly, much less jump. Flights were considered acceptable only when the animal moved forwards and upwards at a constant or increasing angle for a distance sufficient to demonstrate that they were generating the necessary power by wingbeats alone. How long a flight could be sustained was not of interest because sustaining flight is a function of supply and regulation (of oxygen, ATP, body temperature, etc.) rather than maximum power output. However, most animals could fly around indefinitely even when carrying loads that they could barely lift from a standing start.
Most of the animals attempted to escape by flying towards a window. For these animals, maximum takeoff angle for each weight was roughly measured by moving them closer and closer to the window until they could no longer take off steeply enough to reach the window's lower edge. At low takeoff angles (<25°) they could not reach the window at all, although they still clearly attempted to. The height at which they struck or swerved to avoid the wall beneath the window was used to determine their takeoff angle. Measurements were rejected when the angle of a flight changed after takeoff or if the animal spiralled upwards.
Animals were grouped according to wingbeat type based on whether their opposite wings came into broad, clearly visible contact with each other. Butterflies, saturniid and noctuid moths (Lepidoptera), and damselflies (Odonata: Zygoptera) used complete clap-and-fling wingbeats, in which their opposite pairs of wings clapped together, from base to tip, at the dorsal apex of each wingbeat cycle. Other animals tested, hereafter collectively referred to as conventional wingbeat fliers, showed no visible or audible contact between opposite wings, although limited contact (at the wingtips only) may have occurred.
The entire pectoral musculature, ventral, dorsal and along the wing bones, was dissected from birds (as in Hartman, 1961) and bats. For weighing insect flight muscle, the following procedure was used. After cutting off the head, abdomen, legs and wings, thoraces were sectioned sagitally into two halves. Any visible oesophageal contents or non-muscular tissues were removed, and both halves were weighed. After 24h soaking in 0-35 moll"1 NaOH, all muscle was rinsed away with a jet of water. The exoskeleton was dried at room temperature for about 1 h, then weighed. Subtraction of exoskeleton mass from original thorax mass yielded my estimate of flight muscle mass. This method was preferable to dissection because it completely removed all of the flight muscle, and it was quicker and more replicable.
Measured flight muscle masses of birds and bats were slight underestimates, owing to small amounts of muscle left on bone surfaces, and drying and blotting during dissection. Measurements of insect flight muscle mass were slight overestimates, owing to unavoidable chemical removal of a small amount of leg muscle and non-muscular tissue from the thorax. To remedy this situation and to make muscle mass estimates of all animals directly comparable, small correction factors were applied. Bird and bat flight muscle masses were multiplied by 1-01, and insect muscle masses were multiplied by 0-97. These values were fixed prior to flight experiments and represent my best approximation for removal of systematic error.
Attachment of weights to flying animals creates a potential methodological problem because weights that do not act at the centre of mass impart a torque that may adversely affect flight performance. For two reasons, dragonflies were selected to test for this problem. First, the elongate abdomen of dragonflies presented the greatest opportunity to vary weight attachment position. Second, the usual horizontal flight posture of dragonflies should make them particularly sensitive to adverse effects of abdominal weights. Half of the dragonflies flown at 500 m elevation had weights attached to their anterior abdomen (segments 1—2), just posterior to their centre of mass (assumed to be between the meso- and metathoracic wing bases). The other half had weights attached to their extreme posterior abdomen (segments 9—10), five to six times farther from their centre of mass. Maximum lift production was compared between these two treatments.
Statistical analyses were performed by using BMDP software on the DEC-2060 computer at the University of Vermont. All analyses utilized data from individual animals rather than species means because there was considerable morphological variation within species (see Appendix).
RESULTS
Animals tested
Lift production in flying animals 239
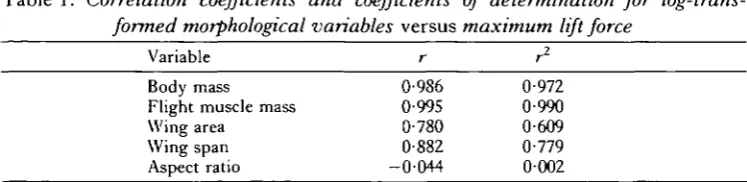
Table 1. Correlation coefficients and coefficients of determination for
log-trans-formed morphological variables versus maximum lift force
Variable r r2
Body mass Flight muscle mass Wing area
Wing span Aspect ratio
0-986 0-995 0-780 0-882 -0-044
[image:5.451.38.412.80.171.2]0-972 0-990 0-609 0-779 0002
Table 2. Correlation coefficients and coefficients of determination for
log-trans-formed mass-specific morphological variables (and aspect ratio) versus maximum body mass-specific lift force
Variable
Flight muscle ratio Wing loading Disk loading Aspect ratio
Pooled
r
0-782 -0-693 -0-728 -0-370
data r2 0-612 0-480 0-530 0-137
Conventional wingbeat
r r2
0-919 0-845 -0-717 0-514 -0-697 0-486 -0-479 0-229
Clap -and-fling wingbeat r
0-728 0-098 -0-303 0-479
r1
0-530 0-010 0-092 0-229
Effects of morphological variation
Four of the five morphological variables (all log-transformed) each explained >60% of the observed variation in maximum lift force (Table 1). However, intercorrelation of these independent variables prevents determination of the cause and effect relationships underlying the results. That is, the question remains whether variation in wing span, for instance, caused 78 % of the variation in maximum lift, or if that correlation only occurred because wing span was highly correlated with other morphological variables.
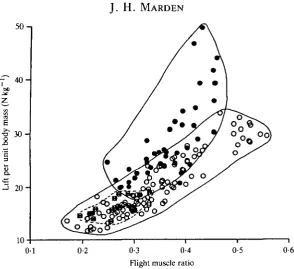
This problem was resolved by comparing maximum mass-specific lift force with mass-specific morphological variables, since factoring out body mass largely removed intercorrelation of the independent variables. Flight muscle ratio (flight muscle mass/unladen body mass) was the best single determinant of body mass-specific lift (Table 2), explaining 61 % of the observed variation, or 85 % and 53 % of variation when the data were grouped according to wingbeat type (Table 2; Fig. 1).
50-i
• f
40-00
CT3 E •a" 3 0
-'c
3
8.
2 20 H
10
0-1 0-2 0-3 0-4
Flight muscle ratio
0-5 0-6
Fig. 1. Plot of flight muscle ratio versus maximum body mass-specific lift force for each animal tested. Solid circles represent clap-and-fling wingbeat fliers, and open circles represent conventional wingbeat fliers. Open circles containing asterisks represent birds and bats; this set of points is enclosed by a dashed line.
failed to occur within either of the two types of animals with clap-and-fling wingbeats (partial z-2 = 0-11 and 0-01 for Lepidoptera and Odonata, respectively), and thus arose only because of differences in lift production between these two taxa, which happened to differ greatly in wing shape.
[image:6.451.80.375.50.319.2]Multiple regression of flight muscle ratio, body mass, wing loading and aspect ratio versus body mass-specific lift (Table 4) resulted in little improvement in explained variation over that achieved by flight muscle ratio alone. Without flight muscle ratio, the best multiple regression explained only about 40 % of the observed variation (Table 4).
Table 3. Partial correlation coefficients and coefficients of determination for
log-transformed mass-specific morphological variables (and aspect ratio) versus maximum body mass-specific lift force, after effect of flight muscle ratio has been
removed
Variable
Conventional wingbeat Clap-and-fling wingbeat
r r1
Wing loading Disk loading Aspect ratio
-0-358 -0-251 -0-370
0-128 0063 0137
0-125 -0-271 0-481
Lift production in flying animals
241
120 -i
100
-3
1
8.
60-40
- 0 - 5 0-5 1
log wing loading (Nm~
[image:7.451.76.366.67.323.2]1-5
Fig. 2. Maximum muscle mass-specific lift versus wing loading for each animals tested. Symbols are as in Fig. 1.
1201 0 0
-
80-3
8. 60
40
- 1 -0-5 0 0-5
log wing disk loading (N m~2)
1-5
[image:7.451.72.362.371.614.2]120-1
I
DC
80-
60-40
0-2 0-4 0-6 0-8
log aspect ratio
[image:8.451.79.376.47.313.2]1-2
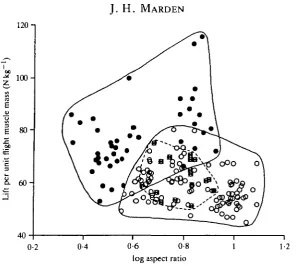
Fig. 4. Maximum muscle mass-specific lift versus wing aspect ratio for each animal tested. Symbols are as in Fig. 1.
Table 4. Coefficients of determination for the multiple regression of all morphological
variables, with and without flight muscle ratio, versus body mass-specific lift
Model
Pooled data r2
Conventional wingbeat
r2
Clap-and-fling wingbeat
r2
All morphological variables
All morphological variables except flight muscle ratio
Flight muscle ratio alone
0-689
0-419
0-612
0-876
0-398
0-845
0-678
0-478
0-530
Also shown are the results using flight muscle ratio alone. Disk loading was omitted here because it is highly correlated with wing loading. Substitution of disk loading for wing loading in the multiple regressions results in a slight decrease in r2 values.
Effects of body mass
[image:8.451.42.415.403.494.2]1
0
1
2
3
« 4 -A
Zi/f production in fly
i
y
w^ animals
A
AM
AA
A *
A X ^ @
alP
r
A Birds
X Bats
D Insects
i i
243
- 5 - 4 - 3 - i
- H
-2-j
- 2 A
- 4 '
1 2
1 Damselflies
2 Butterflies and moths 3 Flies, bugs and mantids 4 Dragonflies
5 Bees and wasps 6 Beetles 7 Sphinx moths 8 Bats 9 Birds
- 5 - 4 - 3 - 2
log flight muscle mass (kg)
[image:9.451.52.383.68.608.2]Table 5. Log—log regressions of flight muscle mass versus maximum lift force among
each taxonomic group
Group
Clap-and-fling wingbeat Damselflies
Butterflies and moths
Conventional wingbeat Flies, bugs and mantids Dragonflies
Bees and wasps Beetles Sphinx moths Bats
Birds
Slope
0-91 (006) 1-00 (0-02)
0-95 (009) 1-03 (0-02) 1-01 (0-02) 1-02 (0-03) 0-97 (0-05) 0-93 (0-04) 0-98 (0-07)
Intercept
•48 •84
•58 •89 •76 •80 •69 •61 •76
r2
0-94 0-99
0-88 0-99 0-99 0-99 0-95 0-99 0-99
N
15 28
16 29 33 5 21 7 10
Mean lift force (N kg"1)
86-2 (3-58) 72-2 (1-83)
59-3 (1-72) 59-9 (0-94) 54-9 (0-92) 53-9 (1-20) 63-2 (1-93) 62-3 (2-42) 62-3 (2-40)
Flies, bugs and mantids are grouped together because each had a small sample size and narrow range of flight muscle mass.
Standard errors are shown in parentheses. A' is the number of individual animals in each group.
Effects of taxonomic position and wingbeat type
Muscle mass-specific lift showed little variation between taxa (Table 5), ranging from 53-9 to 63-2 N kg"1 among conventional wingbeat groups, but increased significantly (P<0-001), by about 25% (72-2-86-2 N kg"1), among taxa using complete clap-and-fling wingbeats.
Vertebrates considered separately
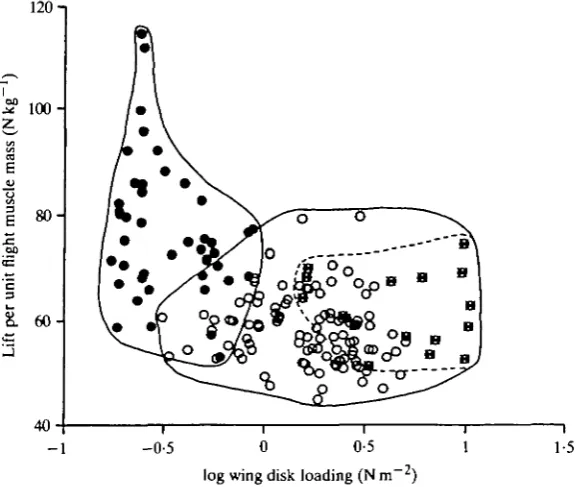
Birds and bats showed results indistinguishable from conventional wingbeat insects. Body mass-specific lift was positively related to flight muscle ratio (Fig. 1, r2 = 0-45, P<0-003), whereas wing loading, disk loading and aspect ratio had no effect on muscle mass-specific lift (Figs 2-4, ^ = 0-03, 0-02, 0-006, respectively, P > 0-4 9 ) . Average muscle mass-specific lift of vertebrates (62-3 N kg"1) fell within the range of values measured for conventional wingbeat insects (Table 5).
Marginal flight muscle ratios
Lift production in flying animals 245
Table 6. Mean marginal flight muscle ratios, and range of unladen flight muscle
ratios (i.e. prior to attachment of weights) for each taxonomic group
Group
Clap-and-fling wingbeat Damselflies
Butterflies and moths
Conventional wingbeat Flies, bugs and mantids Dragonflies
Bees and wasps Beetles Sphinx moths Bats
Birds
Mean marginal flight muscle ratio
0116 0-138
0168 0165 0-179 0183 0158 0159 0-159
Range unladen flight muscle ratio
0-291-0-473 0-249-0-430
0-191-0-396 0-351-0-560 0-209-0-401 0-216-0-248 0-170-0-436 0-224-0-311 0-195-0-331
Effect of altitude
Dragonflies tested at 500 m above sea level achieved significantly less muscle mass-specific lift than dragonflies tested at 20-40m above sea level (55-5 vs 59-9Nkg"1, S.D. =7-9, 5-0; iV=26, 29, respectively; Kruskal-Wallis test, P<0-05). This 7% reduction in muscle mass-specific lift closely corresponds to the 5 % reduction in air density between these two altitudes.
Effect of position of weights
Dragonflies with weights attached to their anterior abdomens did not differ in muscle mass-specific lift from those with posteriorly attached weights (55-4 vs 55-6 N kg"1, S.D. = 9-5, 6-5; vV = 12, 14, respectively; P > 0-5). Thus, there were no observable differences in lift production brought about by weight attachment position, either within these dragonflies, or among different taxa, where muscle mass-specific lift was nearly constant even though weights were attached in a variety of positions depending on the difficulties presented by the anatomy of each species.
Takeoff angles
90
75
<§ 60 U «
"S 4 5
-<
301 5
-Clap-and-fling wingbeat
a aa ,
005
I
015
90 -i
7 5
6 0
4 5
3 0
1 5
-
o-Conventional wingbeat
g§
u p o iac/[ D i
A 1
/ /
I * D X
DO D
Q
D
I
0-25 0-35 005 Flight muscle ratio
0-15 0-25 0-35
Fig. 6. Takeoff angles as a function of flight muscle ratio. Curves are based on linear regressions of transformed variables (see text). Open squares represent insects, triangles represent birds, and crosses represent bats.
instantly changed and they shot upwards at angles similar to those they achieved prior to weight loading.
Animals with clap-and-fling wingbeats achieved low-angle takeoffs with flight muscle ratios as low as (M0, and first achieved vertical takeoffs with ratios of about 0-25. The relationship among conventional wingbeat fliers was similar in slope, but shifted to the right. Low-angle takeoffs were possible at muscle ratios as low as 0-15, and vertical takeoffs were first possible at ratios of about 0-26.
DISCUSSION
Lift, power and flight muscle
Takeoff ability was found to depend on flight muscle ratio. Conventional wingbeat fliers with up to 56 % of their unladen body mass composed of flight muscle were capable of vertical takeoffs, and were able to lift up to three times their mass (Fig. 1). Those with less than 20 % flight muscle could take off only at shallow angles (Fig. 6) and could lift very little additional weight (Fig. 1). All conventional wingbeat fliers showed marginal flight ability when weight attachment reduced their flight muscle ratios to 0-16—0-18 (Table 6). This near-constancy of marginal flight muscle ratios occurred because maximum muscle mass-specific lift was nearly constant among all animals with conventional wingbeats (Table 5) and was independent of body mass, wing characteristics and taxonomic position.
Lift production in flying animals 247
velocity and sine of the angle of flight above horizontal (e.g. Johnson, 1980). Thus, to take off in still air, an animal must achieve an induced power output proportional to its weight, speed and angle of takeoff. Since any animal has a finite amount of induced power it can produce, experimental increases in an animal's weight load should cause progressive decreases in the angle and speed of takeoff, until finally the animal's maximum induced power can only counteract its weight, with no excess power to propel it through the air. As such, results obtained from weight-loading experiments not only measure the maximum lift force developed, but can also serve as an index of the maximum still-air induced power output, provided that takeoff angles and flight velocities approached zero as weight loads were increased. Fig. 6 shows that takeoff angles did indeed approach zero as weight loads were increased (i.e. at low flight muscle ratios). Forward velocity of some animals was never completely reduced to zero (they buzzed along the floor when they could no longer get airborne), which introduces a small amount of error into the results. Even so, the measured maximum lift forces should be an accurate enough index to evaluate general predictions about the scaling of maximum induced power output. Penny-cuick's model was not supported, as maximum weight loads scaled as the 1-0 power of muscle mass (Table 5; Fig. 5), rather than the two-thirds power of body mass. The prediction that mass-specific maximum lift and induced power output should scale inversely as the square root of wing disk loading was also rejected (Fig. 3).
Animals of extreme mass and wing loading
These experiments utilized a wide variety of animals between 0-02 and 270 g body mass. Could it be possible that among larger flying animals, with which Pennycuick was largely concerned, the relationships between mass, morphology and lift production are different from those derived here? This question can be examined by using the concept of marginal flight muscle ratios. If muscle mass-specific lift and mass-specific induced power output decrease in larger animals, then they should show higher marginal flight muscle ratios than those found here (0-16-0-18, Table 6). Pennycuick has described the Kori bustard, one of the heaviest extant flying animals (12 kg), as having marginal flight ability. Kori bustards need a taxiing run to take off, and make only short, laboured flights once airborne (Pennycuick, 1969). A Kori bustard that Pennycuick dissected had a flight muscle ratio of 0-164, which would enable only marginal takeoff ability, if that, in any of the birds, bats or conventional wingbeat insects that I studied. Thus, Kori bustards must produce a muscle mass-specific lift similar to that of the smaller animals tested here, or else they could not become airborne at all with a flight muscle ratio of 0-164.
Marginal flight muscle ratios can also be used to determine if muscle mass-specific lift decreases at extreme wing loadings. Wing loading varied from 0-4 to 53-8 N m~ among the animals tested here, whereas wing loading reaches 245 N m~2 in some flying animals (Greenewalt, 1975; Livezey & Humphrey, 1985). Livezey & Humphrey (1985) made detailed studies of the flight ability and anatomy of steamer-ducks (Humphrey & Livezey, 1982), and found that one species, Tachyeres
whereas three other Tachyeres species (mean wing loading = 260-487 N m~2) are flightless. They concluded that the flightless Tachyeres species exceed the maximum wing loading for which flight is feasible. Livezey & Humphrey measured the mass of the pectoral muscles (pectoralis and supracoracoideus), but not total flight muscle mass (which includes a small amount of muscle from the scapula and wing bones), so flight muscle ratios cannot be directly obtained from their data. However, using data for a coot [Fulica americana, the bird in Hartman's (1961) study closest to steamer-ducks in wing and body form], I have calculated the mass of wing muscle that each of the four steamer-duck species should have. If the coot's wing area (562cm ) is expanded to the 1000—1300 cm of steamer-ducks, then its wing muscle mass (22- 5 g) should increase to 54— 79 g, based on two-thirds scaling of area and mass. I added these estimates to the measured pectoralis and supracoracoideus masses, then divided by body mass, to yield estimates of flight muscle ratios for Livezey & Humphrey's steamer-ducks. T. patachonicus should have a flight muscle ratio of approximately 0-201, whereas the three flightless species should have flight muscle ratios of 0-153—0-173. A comparison of these ratios with my experimentally determined marginal flight muscle ratios for animals with less extreme wing loadings (Table 6), shows that the flightless species of steamer-ducks have muscle ratios that would make flight impossible, or very nearly so, for any conventional wingbeat animal, regardless of its wing loading. That most T. patachonicus can take off and fly with a flight muscle ratio of 0-2 suggests that they generate about 50 N kg~' of muscle mass-specific lift, a value well within the range measured in my experiments (Figs 2-4).
The distribution of flight muscle ratios
The distribution of flight muscle ratios is poorly understood. Greenewalt (1962, 1975) reviewed the scaling of mass of the two large pectoral muscles in birds, but did not consider total flight muscle mass, flight muscle ratio, or interspecific variation in flight muscle ratio. Legal & Reichel (data given in Miillenhoff, 1885) and Hartman (1961) are the only studies to date that measured total flight muscle mass and flight muscle ratio; combined, they measured 425 bird species, but did not analyse their data statistically. Fig. 7 shows the distribution of flight muscle ratios among the birds sampled in those two studies. The marginal flight muscle ratios that I determined experimentally (Table 6, 0-16 for birds in particular) are an excellent predictor of the lower limit of flight muscle ratios seen in birds (Fig. 7). This agreement is a powerful corroboration of these experimental results.
Lift production in flying animals
249
4 0 - i
30-
20-E Z
10-m
0-1 0-2 0-3 0-4 Flight muscle ratio
[image:15.451.104.361.51.358.2]0-5
Fig. 7. Frequency distribution of flight muscle ratio among the 425 bird species for which total flight muscle mass has been measured (references given in text) (x = 0-254, S.D. = 0-053, range = 0-115-0-439).
Unfortunately, there are no comparable data for flight muscle ratios of either bats or insects. Hartman (1963) measured only the ventral pectoral musculature, not total flight musculature of bats. All previously published values of flight muscle ratios in insects (reviewed in Greenewalt, 1962, 1975) are considerably lower than those of similar insect species I measured here, and are certainly erroneous due to incomplete dissection and/or desiccation during dissection. Bats in particular would be interesting to study in regard to flight muscle ratios because females carry their infants in flight, making weight loading especially important. Some bats are said to be unable to take off from the ground (e.g. Vaughan, 1978), and may have unusually low flight muscle ratios. Presumably, such bats always take off by dropping into the air, and thus avoid the more demanding situation of taking off from the ground in still air.
Wingbeat types
Table 7. Bird species from Hartman (1961) and Legal & Reichel (data in
Mullen-hoff, 1885) that had flight muscle ratios less than 0-16
Species Flight muscle ratio
Podicpes dominicus 0143
Least grebe
Podilymbus podiceps 0 115
Pie-billed grebe
Ixobrychus exilis 0139
Least bittern
Aramides cajanea 0159
Gray-necked wood rail
Laterallus albigularis 0120
White-throated rail
Porphyrula marttnica 0137
Purple gallinule
Fulica americana 0-135
American coot
Piaya cay ana 0136
Squirrel cuckoo
Todirostrum cinereum 0157
Common tody-flycatcher
Thryothonis modestus 0-157
Plain wren
Larus ridibundus 0133
Black-headed gull
A strictly dichotomous grouping of wingbeat types may be somewhat artificial in that air flow patterns around the wings vary between different clap-and-fling fliers, and conventional wingbeat fliers may also create beneficial unsteady aerodynamic effects between opposite wings (Ellington, 1984). However, variation in wingbeat patterns among the animals I tested appeared to be more discrete than continuous, that is they either had extensive contact between opposite wings, or they had very little contact. The designation of two wingbeat groups in this study simply reflects that fact and explores its consequences. The validity of this dichotomous grouping is best demonstrated by comparing muscle mass-specific lift between damselflies and dragonflies, and between sphinx moths and other Lepidoptera (Table 5). Each of these comparisons is between groups with similar build and taxonomy, but different wingbeat types, and shows a consistent effect of wing contact in enhancing lift when other variables are held fairly constant.
Lift production in flying animals 251
is unclear, but it is possible that pigeons do generally achieve enhanced lift and that my small sample of one pigeon failed to detect it.
Another group of animals with an ambiguous wingbeat pattern was the hesperiid butterflies (skippers), whose opposite forewings appeared to come into contact from about midway along their length to their tip, rather than from base to tip as did wings of other clap-and-fling insects. The two hesperiids tested here achieved 68-8 and 68-0 N kg"1 of lift, values about halfway between the mean for butterflies (72 N kg"1) and the mean for conventional wingbeat fliers (59Nkg~'). This result, although based on a very small sample, indicates that the extent of wing contact may determine how much lift enhancement occurs. Ellington (1984) predicted that partial clap-and-fling wingbeats should yield partial lift enhancement.
Implications about flight mechanics
It is tempting, but risky, to try to ascertain what the results presented here indicate about finer details of the mechanics of animal flight in still air. Near-constancy of maximum still-air muscle mass-specific lift and induced power output may indicate that the animals had equal muscle mass-specific power output (as has frequently been assumed, e.g. Weis-Fogh & Alexander, 1977; 250Wkg"1), of which a constant fraction was required for inertial and profile power. However, and perhaps more likely, these power components may have varied among animals, but in such a way that increases in muscular power output were offset by increased inertial or profile power requirements, so that mass-specific induced power output remained fairly constant.
The prediction that maximum mass-specific induced power output should scale inversely as the square root of wing disk loading (see earlier references) was based on the assumption that longer wings accelerate a given mass of air through the wing disk at a lower velocity than shorter wings, creating an energetic saving. This model holds true for propellers and helicopters (e.g. Johnson, 1980), for which the model was originally derived. However, in applying the model to animal flight, adequate consideration has not been given to the fact that animal wings use oscillatory rather than circular motion. Because of this difference, animals experience large inertial costs of accelerating and decelerating their wings (e.g. Casey, 1981), especially during hovering and takeoff when wingbeat amplitude is maximal. Thus, even though shorter wings necessitate a greater induced velocity to achieve a given mass flow of air, they may be less expensive to beat. My observation that muscle mass-specific lift was independent of wing and disk loading may indicate that the cost/benefit relationship between inertial power and induced power may be nearly constant over a broad range of wing sizes.
obtainable lift and aerodynamic power production per unit muscle mass. This convergence in performance has not necessitated convergence in morphology; the tremendous morphological diversity of flying animals represents a great variety of ways in which different animals have achieved the best solution to the common problem of producing lift in still air, while maintaining specializations for their other modes of flight.
It is curious that all animals do not use clap-and-fling wingbeats, which enhance still-air lift production by about 25 %. The reason for this may be that animals with clap-and-fling wingbeats are at a relative disadvantage in some aspect of flight performance not measured in this study. For example, clap-and-fling fliers may achieve lower maximum forward speed due to excessive drag on their large flat wings.
Limitations to these findings
Results and conclusions from these experiments cannot be generalized to all flight situations. In forward flight, drag on the wings becomes an important consideration, and wings of different sizes and shapes experience different drag forces. In forward flight, wingbeat amplitude decreases and the inertial cost of beating the wings may become relatively unimportant, making longer wings advantageous for lift, pro-duction and induced power output.
Power requirements for horizontal flight are a U-shaped function of forward speed (Pennycuick, 1968; Tucker, 1968; Carpenter, 1985), so steady forward flight can be accomplished at a fraction of the animal's maximum power output capability. Presumably, animals with high flight muscle ratios recruit only a fraction of their muscle fibres during steady forward flight. Thus, a high flight muscle ratio is of no advantage during flight at the minimum power or maximum range speed, and in fact can be considered a disadvantage, for it should be more beneficial for animals to transport non-muscular loads (such as eggs, 'fuel', water, etc.) from one place to another, rather than excess, mostly unused muscle. High flight muscle ratios should occur in animals that frequently need maximum power output for lifting loads, capturing prey, avoiding predators or competing aerially for territories and mates.
Lift production in flying animals
253APPENDIX
Morphology and lift data for each animal tested
Taxon
Flight Wing Wing Body muscle area span mass (g) mass (g) (cm2) (cm)
Maximum lift force (NxlO2)
Morphology and lift data for each animal tested Taxon Pieris rapae Pieris rapae Phoebis argante Phoebis argante Nymphahdae Heliconius cydno Heliconius erato Heliconius erato Parides sesostris Papilionidae Papilio sp. Hesperiidae
Unidentified sp. 1 Unidentified sp. 2 Lycaenidae Unidentified sp. Noctuidae Ascalapha odorata Ascalapha odorata Saturniidae Rothschildia tebeau Rothschildia tebeau Tilaea tamerlan Sphingidae Xylophones tersa Xylophones tersa Xylophones tersa Xylophones sp. 1 Xylophones sp. 2 Xylophones sp. 2 Xylophones sp. 2 Manduca sp. Pachylia ficus Pachylia ficus Enyo sp. Agnus cingulatus
Unidentified sp. 1 Unidentified sp. 2 Unidentified sp. 2 Unidentified sp. 2 Unidentified sp. 3 Unidentified sp. 3 Unidentified sp. 3 Unidentified sp. 4 Unidentified sp. 5
Odonata Anisoptera
Sympetrum sp. 1 Sympetrum sp. 1 Svmpetrum sp. 1
Body mass (g) 0-037 0-042 0184 0-202 0-154 0-053 0-105 0-314 0149 0-115 0-184 0-200 1-32 1-72 0-930 1-26 1-31 0-403 0-410 0-711 0-905 0-470 0-529 0-552 1-87 1-93 4-57 1-17 1-69 0-829 1-16 2-23 3-18 1-40 1-47 2-04 0-921 0-573 0-074 0-123 0-092 Flight muscle mass (g) 0-015 0016 0-077 0-075 0048 0014 0-026 0-096 0-059 0-049 0065 0-078 0-428 0-586 0-270 0-342 0-380 0-143 0146 0-162 0-294 0-144 0-182 0-199 0-628 0-637 0-976 0-294 0-416 0-271 0-505 0-753 1-010 0-512 0-439 0-347 0-332 0-157 0030 0-069 0035 Wing area (cm2)
9 9 25 22 20 9 15 26 21 7 8 15 50 64 78 86 87 8 8 9 15 8 9 10 27 21 37 8 18 16 16 27 31 12 15 15 12 12 7 6 6 Wing span (cm) 5 5 8 7 9 6 8 9 7 5 5 7 14 16 16 17 18 7 8 8 9 7 7 8 12 11 15 7 10 10 9 12 14 9 10 9 8 8 6 5 5 Maximum lift force (NX102)
0-10 010 0-58 0-62 0-28 011 0-26 0-71 0-51 0-33 0-45 0-41 3-32 4-50 1-86 2-50 2-73 0-84 0-87 1-29 1-89 0-86 1-22 0-95 3-26 4-17 6-80 1-80 2-82 1-98 2-54 4-56 6-23 2-92 2-34 2-77 2-21 114
Lift production in flying animals
255
Morphology and lift data for each animal tested
Taxon Body mass (g) 0121 0-125 0-080 0111 0-913 0-955 0-945 0-980 1-083 0-612 0-600 0-605 0-605 0-357 0-422 0-513 0-463 0-556 0-407 0-364 0-473 0-386 0-399 0-536 0-431 0-320 0-233 0149 0-217 0-037 0-035 0-024 0-022 0-030 0039 0-046 0-035 0-019 0-042 0-055 0-036 Flight muscle mass (g) 0048 0062 0033 0-045 0-397 0-400 0-416 0-420 0-411 0-243 0-253 0-212 0-245 0-180 0-223 0-281 0-238 0198 0-202 0-192 0-240 0-197 0199 0-282 0-228 0150 0076 0-045 0-063 0-017 0-016 0-011 0-010 0-013 0-018 0-015 0016 0-008 0-018 0-020 0015 Wing area (cm2)
6 7 7 7 22 23 23 23 23 20 19 19 19 15 19 16 16 12 15 15 16 16 14 15 15 17 24 13 18 3 3 2 2 2 3 3 2 2 3 3 3 Wing span (cm) 5 5 6 5 10 10 10 10 10 9 9 9 9 8 9 9 9 7 8 8 9 8 8 9 8 9 12 10 12 4 4 4 4 4 5 4 4 4 4 5 4 Maximum lift force (NX102)
0-28 0-37 0 1 8 0-28 2-45 2-44 2-61 2-54 2-61 1-58 1-61 1-44 1-68 0-99 1-20 1-53 1-35 1-11 1-29 1 1 6 1-55 1-18 1-05 1-53 1-35 1-07 0-57 0-32 0-51 0-15 0-11 0-09 0-09 0-15 0-17 0 1 3 0 1 3 0-07 0-17 0-15 0-17
Sympetnim sp. 1 Sympetrum sp. 1 Sympetnim sp. 1 Sympetrum sp. 1 Anax junius Anax junius Anax junius Anax junius Anax junius Aeshna canadensis Aeshna canadensis Aeshna canadensis Aeshna canadensis Aeshna sp. Libellula pulchella Libellula pulchella Libellula pulchella Libellula pulchella Libellula pulchella Libellula pulchella Libellula pulchella Libellula pulchella Libellula pulchella Libellula pulchella Libellula pulchella Libellula sp. Zygoptera Megaloptera sp. Mecislogaster sp. 1 Mecistogaster sp. 1 Argia chelata Argia chelata Argia chelata Argia chelata Argia chelata Argia chelata Argia chelata Argia chelata Argia chelata Argia chelata Argia chelata Argia chelata Hymenoptera Sphecidae
Pepsis sp. 1 Pepsis sp. 1
Morphology and lift data for each animal tested Taxon Apidae Bombus affinis Bombus affinis Bombus affinis Bombus affinis Bombus affinis Bombus affinis Bombus affinis Bombus affinis Bombus affinis Bombus affinis Bombus fervidus Bombus fervidus Bombus fervidus Bombus fervidus Bombus fervidus Bombus fervidus Bombus fervidus Bombus fervidus Bombus terricola Xylocopa veripuncta Xylocopa veripuncta Xylocopa veripuncta Xylocopa veripuncta Xylocopa veripuncta Xylocopa veripuncta Xylocopa veripuncta Xylocopa veripuncta Xylocopa veripuncta Xylocopa veripuncta Xylocopa sp. 1 Xyloiopa sp. 1
Coleoptera Scarabaeidae
Dichotomius carolinus
Curculionidae Unidentified sp. 1 Unidentified sp. 1 Unidentified sp. 1 Unidentified sp. 2
Hemiptera Pentatomidae
Unidentified sp. Lygaeidae
Unidentified sp. 1 Unidentified sp. 1 Unidentified sp. 1
Body mass (g) 0-150 0-098 0-141 0-151 0-091 0-172 0-100 0-141 0-078 0-074 0-182 0-164 0-169 0-209 0-173 0-151 0-144 0-129 0-142 0-517 0-574 0-578 0-793 0-362 0-428 0-704 0-480 0-854 0-435 1-26 1-41 2-11 0-259 0-297 0-575 0-880 0-442 0171 0-225 0-205 Flight muscle mass (g) 0-045 0032 0-043 0-042 0031 0036 0033 0-034 0-025 0-022 0-060 0-047 0-052 0-058 0-053 0-045 0046 0-046 0-040 0-170 0-230 0-162 0-234 0-137 0-172 0-222 0-141 0-243 0-163 0-380 0-363 0-455 0 056 0074 0-127 0-206 0-084 0-051 0-062 0-055 W,ng area (cm2)
0-8 0-6 0-7 0-7 0-6 0-7 0-7 0-6 0-6 0-5 0-9 0-8 0-8 0-9 0-9 0-8 0-9 0-9 0-7 2-4 2-7 2-3 2-6 1-9 2-1 2-5 1-8 2-7 2-4 3-7 3-8 8 0 1-6 1-6 2-4 4-3 2-9 1-8 2-2 1-9 Wing span (cm) 3 3 3 3 3 3 3 3 2 2 3 3 3 3 3 3 3 3 3 5 5 5 5 4 5 5 4 5 5 6 6 8 4 4 5 6 4 3 4 4 Maximum lift force (NX102)
Lift production in flying animals
257
Morphology and lift data for each animal tested
Taxon
Body mass (g)
Flight muscle mass (g)
Wing area (cm2)
Wing span (cm)
Maximum lift force (NX102) Unidentified sp. 1
Unidentified sp. 1 Unidentified sp. 1 Unidentified sp. 2
Diptera Asilidae
Unidentified sp. 1 Unidentified sp. 1 Unidentified sp. 1 Unidentified sp. 1 Unidentified sp. 1 Syrphidae
Unidentified sp.
Orthoptera Mantidae
Tenodera aridifolia Tenodera aridifolia
0-208 0-192 0-195 0138
0-173 0179 0-200 0-208 0-276
0050 0-052 0-052 0029
0-065 0068 0-073 0-082 0-109
2-0 1-7 1-9 1-4
1 0 1-5 1-3 1-5 1-8
4 3 4 3
4 4 4 4 4
0-35 0-27 0-30 0 1 9
0-44 0-46 0-38 0-47 0-64
0-117
0-305 0-387
0-038
0-064 0-0%
0-5
13 14
0-18
0-36 0-47
The units of measure have been changed from the SI units used in the text in order to minimize zeros. These values have been rounded off and do not yield statistical values given in the text.
I thank my wife Paula Marden for extensive assistance, and B. Heinrich, J. Schall and J. Herbers for frequent advice. D. Roubik acted as my host in Panama, and assisted in collecting many of the insects used in the experiments. I thank the above, U. Norberg, C. Pennycuick, S. Stevenson and J. Rayner for many helpful comments on the manuscript. This project was supported by NSF grant DEB-8116662 to B. Heinrich, a University of Vermont Institutional Grant, and a Graduate Student Fellowship from the Smithsonian Institution. The Smithsonian Tropical Research Institute provided logistical support, and RENARE, Republic of Panama, granted permission to collect the Panamanian animals used herein.
REFERENCES
CARPENTER, R. E. (1985). Flight physiology of flying foxes, Pteropus poliocephalus. J. exp. Biol.
114, 619-647.
CASEY, T. M. (1981). A comparison of mechanical and energetic estimates of flight cost for hovering sphinx moths. J. exp. Biol. 91, 117-129.
ELLINGTON, C. P. (1984). The aerodynamics of hovering insect flight. Phil. Trans. R. Soc. Ser. B
305, 1-181.
Epting, R. J. & Casey, T. M. (1973). Power output and wing disc loading in hovering hummingbirds. Am. Nat. 107, 761-765.
GREENEWALT, C. H. (1962). Dimensional relationships for flying animals. Smhhson. misc. Collns
144, 1-46.
HARTMAN, F. A. (1961). Locomotor mechanisms of birds. Smilhson. misc. Colitis 143, 1—91. HARTMAN, F. A. (1963). Some flight mechanisms in bats. OhioJ. Sci. 63, 59-65.
HEPPNER, F. H. & ANDERSON, J. G. T. (1985). Leg thrust important in flight take-off in the pigeon. J . exp. Biol. 114, 285-288.
HUMPHREY, P. S. & LIVEZEY, B. C. (1982). Flightlessness in flying steamer-ducks. Auk 99, 368-372.
JOHNSON, W. (1980). Helicopter Theory. Princeton: Princeton University Press.
LIVEZEY, B. C. & HUMPHREY, P. S. (1985). Flightlessness in steamer-ducks (Anatidae:
Tachyeres): Its morphological bases and probable evolution. Evolution 40, 540—558.
MOLLENHOFF, K. (1885). Die Grosse der Flugflachen. Pflugers Arch.ges. Physiol. 35, 407-453. PENNYCUICK, C. J. (1968). A wind-tunnel study of gliding flight in the pigeon Columba livia.
J. exp. Biol. 49, 509-526.
PENNYCUICK, C. J. (1969). The mechanics of bird migration. Ibis 111, 525-556. PENNYCUICK, C. J. (1972). Animal Flight. London: Arnold Press.
RAYNER, J. M. V. (1979). A new approach to animal flight mechanics. J. exp. Biol. 80, 17-54. SAVILE, D. B. O. (1957)TAdaptive evolution in the avian wing. Evolution 11, 212-224.
TUCKER, V. A. (1968). Respiratory exchange and evaporative water loss in the flying budgerigar. J. exp. Biol. 48, 67-87.
VAUGHAN, T . A. (1978). Mammology. Philadelphia: Saunders College Publishing.
WEIS-FOGH, T . (1973). Quick estimates of flight fitness in hovering animals, including novel mechanisms of lift production. J. exp. Biol. 59, 169-230.