Fatigue leads to failure after repeated application of stresses, which may be much lower than the ultimate tensile stress. The phenomenon is well known in metals and in man-made polymers (Hearle, 1967; Rabinowitz and Beardmore, 1974; Takemori, 1984). It has been demonstrated in a carbon fibre composite (Poursartip et al. 1986) and in bone (Carter and
Caler, 1983). This paper will show that it also occurs in tendon. Materials may also fail after prolonged application of a constant stress that is lower than the ultimate stress. This is known as creep rupture. Failure in creep and fatigue both result from cumulative damage. For most materials, they seem to be clearly distinct from each other; a test in which the applied stress fluctuates sinusoidally around a mean of zero is generally considered to involve fatigue without creep. The distinction is more difficult with pliant materials such as tendons, which cannot easily be subjected to negative stresses. A dynamic tensile test subjects the tendon to a positive mean stress, so that any fatigue test is in effect superimposed on a creep test.
In the accompanying paper (Wang and Ker, 1995), we showed that tendon is liable to creep failure. Here we show that it is also liable to fatigue, distinguishing fatigue from creep using tests at different frequencies. Ideally, if fatigue alone occurred, cyclic tests over any given stress range should lead to failure after the same number of cycles, at all frequencies. If creep alone occurred, the same tests should lead to failure after the same time, at all frequencies.
Carter and Caler (1983) have shown that creep failure and fatigue failure are distinct phenomena for bone. Here we show the same for tendon.
Many tendons are subject to frequently repeated stresses. For example, leg tendons are stressed in every stride, the
tendons of jaw muscles are stressed in every cycle of chewing and the tendons of a typist’s fingers are stressed in every keystroke. The stresses involved in repetitive activities are generally much larger than the prolonged stresses required, for example, to maintain posture. This point is illustrated by the human Achilles tendon, which transmits peak forces of about seven times the body weight during running (Ker et al. 1987) but only about the half body weight while standing (calculated by taking moments about the ankle joint, assuming that a force equal to half the body weight acts on the sole of each foot at the position of the centre of pressure indicated in Fig. 11.1 of Basmajian and De Luca, 1985). The occurrence of relatively large repetitive loads on tendons under natural conditions suggests that tendon fatigue, if it occurs, may be an important phenomenon. We will return to this possibility in the Discussion.
Materials and methods
The experiments were performed on tail tendons from two wallabies (Macropus rufogriseus (Desmarest)), weighing 13 kg and 25 kg, which arrived in our laboratory on the day following death. The carcasses were stored at 220 ˚C and the tendons were subsequently dissected out and stored, at the same temperature, in plastic bags. No significant difference in properties was found between tendons from the two animals. The cross-sectional areas of the tendons were calculated by weighing a measured length and assuming a density of 1120 kg m23 (Ker, 1981). The tests were performed at room
temperature, in an Instron 8031 dynamic testing machine, with the tendon completely immersed in liquid paraffin, as
847
The Journal of Experimental Biology 198, 847–852 (1995)Printed in Great Britain © The Company of Biologists Limited 1995
Wallaby tail tendons fail after repeated application of stresses much lower than would be needed to break them in a single pull. We show that this is a fatigue phenomenon, distinct from the creep rupture that occurs after prolonged application of a constant stress. The two phenomena are
distinguished by experiments in which tensile stress is cycled at different frequencies, ranging from 1 to 50 Hz.
Key words: fatigue, fatigue rupture, creep rupture, wallaby, Macropus rufogriseus.
Summary
FATIGUE RUPTURE OF WALLABY TAIL TENDONS
XIAO TONG WANG*, ROBERT F. KER ANDR. MCNEILL ALEXANDER†
Department of Pure and Applied Biology, The University, Leeds LS2 9JT, UK
Accepted 31 October 1994
*Present address: West Virginia University, Orthopedic Research Laboratory, Robert C. Byrd Health Science Center South, Morgantown, WV 26506-9196, USA.
†To whom reprint requests should be addressed.
848
described in detail in Wang et al. (1991). The paraffin was saturated with water buffered to pH 7, to maintain the water content of the tendon.
In preliminary experiments, the tendon usually failed at one or other of the clamps, presumably due to stress concentrations. This problem was largely overcome by the following procedure. Before being placed in the apparatus, each tendon was wrapped in paper tissues soaked in liquid paraffin, leaving 20 mm exposed at each end. It was then left for several hours to allow the exposed ends to dry. The dry ends were then fastened in the clamps and the experiment performed. When this precaution was taken, failure usually occurred well away from the clamps.
The dynamic testing machine was used in load control, to impose on the tendon a sinusoidal pattern of force. A chart recorder was used to obtain plots of actuator movement against time. The outputs representing load and actuator displacement were also stored in a two-channel digital recorder and used to produce plots of force against displacement.
Tensile stress–strain curves for tendon show a ‘toe’ at low stresses, which seems to be due to straightening of crimped fibres (Diamant et al. 1972). To ensure that the tests were stretching the fibres and not merely straightening the crimp, the stress range was adjusted in all tests so that the minimum stress on each cycle was 11.5 MPa. This is towards the end of the toe region (see Fig. 2 in Wang and Ker, 1995).
Tests were performed over various stress ranges, at frequencies of 1.1, 2.1, 5.3, 10 and 50 Hz. The length of the tendon samples tested at 1.1, 5.3 and 10 Hz was about 120 mm. At 50 Hz, shorter tendons (40 mm) were used because the amplitude that the Instron machine can achieve is limited at high frequencies. To control for possible effects of specimen length, 40 mm specimens were also used in the tests at 2.1 Hz. The length of specimens may affect their mechanical properties (Wang and Ker, 1995), so we do not attempt to compare the results between different specimen lengths in this paper.
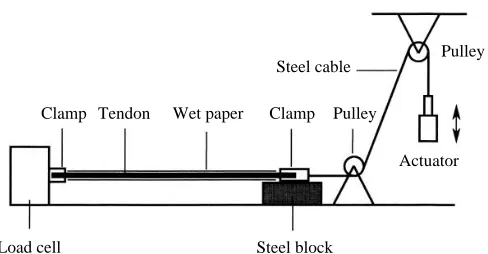
Most tests were performed as described above, using the testing machine in the conventional way (see Wang and Ker, 1995). However, the arrangement shown in Fig. 1 was used for some of the longest tests. At the lowest stresses, the tests lasted for up to 16 h, and it proved necessary to use this modified procedure because the dried ends of the tendons became moist during very long tests and slipped in the clamps. In this new arrangement (Fig. 1), the dried ends of the tendon were clamped as already described, but the tendon was horizontal and the load cell was mounted on the testing table instead of in its usual position on the machine. The tendon was wrapped in paper tissues soaked in liquid paraffin, enclosed in an outer layer of plastic film. The weight of the tendon and wrappings was very small compared even with the minimum loads imposed in the tests.
Results
Plots of actuator displacement against time (Fig. 2) show
that mean extension increased slowly for most of the duration of each test, but much faster just before rupture.
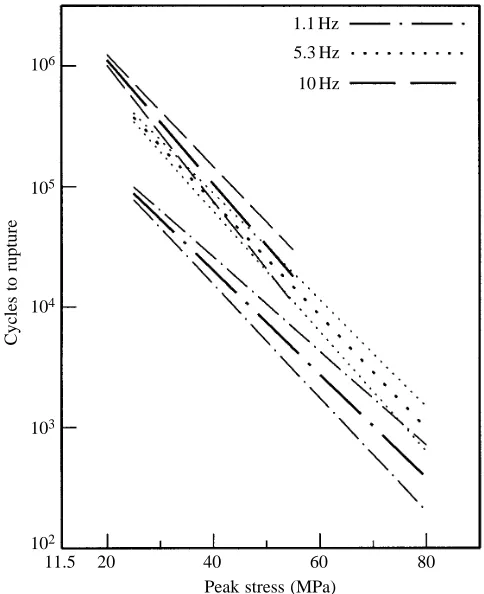
Wang and Ker (1995) showed that creep lifetimes decrease exponentially with stress. A plot of log(lifetime) against stress gives a straight line at stresses from 20 to 80 MPa. Similar semi-logarithmic plots are presented here for fatigue lifetime. Fig. 3 is for the specimens approximately 120 mm in length and shows results for the three frequencies used. The continuous line labelled ‘creep’ in Fig. 3 shows the expected lifetime with an oscillatory stress, if creep were the only contributor to damage. The derivation of this line from the creep theory of Wang and Ker (1995) is described in the Appendix.
If the ‘peak stress’ were to be reduced towards the minimum stress (11.5 MPa in every test), oscillation would be lost and the plots for different frequencies would converge on a single point, which is the lifetime for creep under a constant applied stress of 11.5 MPa. In the Appendix, creep lifetimes for the 25 kg wallaby are calculated (see Fig. 9). Extrapolation of the
X. T. W
ANG, R. F. K
ER ANDR. M
CN. A
LEXANDER10
5
0
Strain (%)
0 20 000 40 000
[image:2.612.316.560.68.195.2]Number of cycles
Fig. 1. Modification of the apparatus described in Fig. 1 of Wang and Ker (1995) used for some of the longest tests. The tendon was horizontal and the load cell was mounted on the testing table instead of its in usual position on the Instron machine.
Clamp Tendon Wet paper Clamp Pulley
Steel block
Actuator Pulley
Load cell
[image:2.612.313.557.267.432.2]Steel cable
849
Fatigue of tendons
regression line to a stress of 11.5 MPa gives a lifetime of 3.033105s. The regression lines drawn in Fig. 3 use this value
as a fixed point. An uncertainty arises in this procedure, because the actual lifetime in creep at low stresses such as 11.5 MPa is longer than is indicated by extrapolation of the exponential (Wang and Ker, 1995). We therefore cannot be certain that the extrapolations to zero-amplitude oscillation must exactly coincide at different frequencies.
The slopes (±95 % confidence limits) for the three regression lines are: at 1.1 Hz, 20.0430±0.0040 MPa21; at 5.3 Hz,
20.0470±0.0027 MPa21; and at 10 Hz, 20.0513±
0.0059 MPa21. The confidence limits for the results at a
frequency of 5.3 Hz clearly overlap with those on either side. However, the results at frequencies of 1.1 and 10 Hz are almost distinct from each other and the regression lines are all clearly distinct from the creep line.
In Fig. 4, the same data are displayed in terms of the number of cycles prior to rupture. Fig. 4 is derived from Fig. 3 by adding to each log(lifetime) the relevant log(frequency). The ‘creep’ curve is, of course, no longer applicable. The 95 %
106
Time to rupture (s)
11.5 20 40 60 Peak stress (MPa) 105
104
103
102
80
B
A Creep
1.1 Hz 5.3 Hz
10 Hz
11.5 20 40 60 Peak stress (MPa)
80 Creep
[image:3.612.70.545.73.339.2]1.1 Hz 5.3 Hz 10 Hz
Fig. 3. In fatigue tests, rupture occurs after shorter times than would be predicted from creep alone. The continuous lines show rupture times predicted from the results of creep tests, as explained in the Appendix. (A) The points show results of fatigue tests at frequencies of 1.1 Hz (N=6), 5.3 Hz (N=17) and 10 Hz (N=11). Where more than two results are available at the same frequency and peak stress, means and error bars, with 95 % confidence limits, are shown rather than the individual points. The broken lines are the respective linear regressions, on this semi-logarithmic plot, calculated on the assumption that the lines go through a common point when the amplitude of oscillation is zero. (B) As A, but including the 95 % confidence limits for the regression lines. The points have been omitted for clarity. Specimen length 120 mm; minimum stress 11.5 MPa; room temperature.
106
Cycles to rupture
11.5 20 40 60 Peak stress (MPa) 105
104
103
102
80 1.1 Hz
5.3 Hz
10 Hz
[image:3.612.321.563.446.743.2]850
confidence limits overlap at frequencies of 5.3 Hz and 10 Hz, but these are both distinct from the results at 1.1 Hz.
[image:4.612.42.294.67.300.2]Figs 5 and 6 correspond to Figs 3 and 4, respectively, but show the results using the shorter (40 mm instead of 120 mm) specimens. The regression lines in Fig. 5 have not been forced to go through a fixed lifetime value at peak stress 11.5 MPa, because we do not have the relevant creep data for 40 mm samples, which would be needed to determine the fixed point. The 95 % confidence limits for the linear regressions, over the range of stress from 20 to 80 MPa, do not overlap in either Fig. 5 or Fig. 6.
Figs 3 and 5 show that tendon failure in our experiments was not simply a result of creep: failure occurred after shorter times in oscillatory tests than would be predicted from the results of creep tests and after shorter times at high frequencies than at low ones. Also, Figs 4 and 6 show that failure was not simply the result of fatigue: it occurred after fewer cycles at low frequencies than at high ones. Creep failure and fatigue failure of tendon are distinct phenomena.
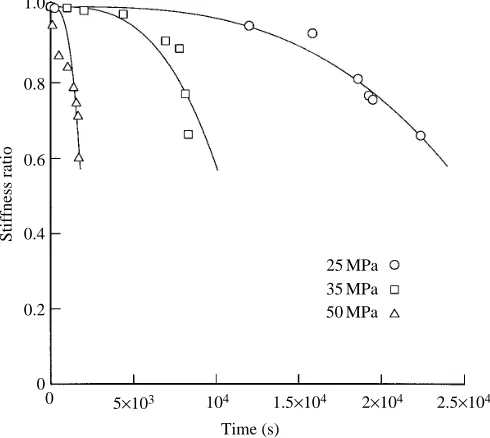
Plots of force against displacement for selected cycles of fatigue tests showed a gradual decrease in stiffness throughout each test (Fig. 7). These changes continued at accelerated rates, immediately prior to rupture. This falling stiffness is a symptom of the accumulation of damage (Beaumont, 1989; Wang and Ker, 1995).
Specimens examined by eye after high-frequency (50 Hz) tests showed pull-out over a much shorter length from the two sides of the break than did specimens tested at lower frequencies. This suggests that the damage in higher-frequency fatigue is more likely to be locally concentrated.
Discussion
Since wallaby tail tendons are typical of mammalian tendons generally in Young’s modulus and energy dissipation (Bennett
X. T. W
ANG, R. F. K
ER ANDR. M
CN. A
LEXANDER105
Time to rupture (s)
11.5 20 40 60 Peak stress (MPa) 104
103
102
101
80 2.1 Hz
[image:4.612.308.560.71.296.2]50 Hz
Fig. 5. The results of fatigue tests at frequencies of 2.1 Hz (N=17) and 50 Hz (N=62) with specimens of length 40 mm. Other details as in Fig. 3. The broken lines are the respective linear regressions and their 95 % confidence limits on this semi-logarithmic plot. Minimum stress 11.5 MPa; room temperature.
106
Cycles to rupture
11.5 20 40 60 Peak stress (MPa) 105
104
103
102
80 2.1 Hz
50 Hz
Fig. 6. The data shown in Fig. 5 plotted here in terms of the number of cycles of oscillation prior to rupture; calculation details as in Fig. 4.
1.0
Stiffness ratio
0 5×10³
Time (s) 0.8
0.6
0.4
0.2
25 MPa 35 MPa 50 MPa
0
104 1.5×10⁴ 2×10⁴ 2.5×10⁴
Fig. 7. The rate of fall of stiffness accelerates during each fatigue test. The ordinate, ‘stiffness ratio’, is the fraction of the initial stiffness remaining at a given time. Each curve shows stiffness ratios measured from force–displacement plots for selected cycles of one test. The tests were for peak stresses of 25, 35 and 50 MPa, respectively, as indicated. The lines, which are intended only to give a general indication of the trends, are of the form sr=1+at3, where sr is the
[image:4.612.313.558.346.565.2]851
Fatigue of tendons
et al. 1986; Wang and Ker, 1995), it seems reasonable to
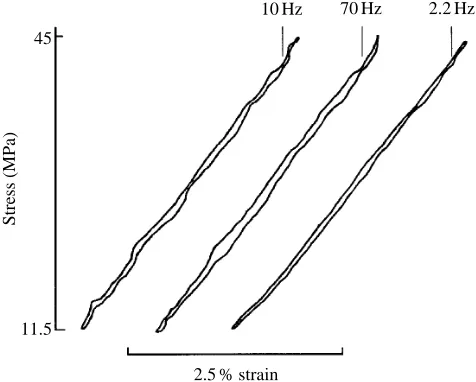
suppose that their fatigue failure properties are also typical. Their Young’s moduli and energy dissipations are almost independent of frequency over the range 2.2–70 Hz (Fig. 8), which gives us confidence in the conclusions we have drawn from comparisons between the results of fatigue tests at different frequencies.
We should consider whether the phenomenon described in this paper is likely to have biological significance. Consider first the wallaby tail tendons used in our experiments. The tail swings up and down in each hopping stride, at a frequency of the order of 3 Hz (Alexander and Vernon, 1975). We do not know what stresses this imposes on the tendons, but measurements of the physiological cross-sectional areas of the tail muscles show that stresses of about 14 MPa would occur in the tendons if the muscles were to contract isometrically (Wang and Ker, 1995). The stresses occurring in hopping may be smaller than this (if the muscles are not fully activated) or up to almost twice this (if the muscle fibres are fully activated while being stretched; Woledge et al. 1985). Extrapolation of the data in Fig. 3 suggests that stresses of around 14 MPa, applied at a frequency of 3 Hz, should cause failure after times of the order of 23105s (56 h).
Lower stresses would give longer fatigue life. Fatigue damage is presumably repaired in living tendons, but not during our experiments. We do not know the rate of repair, but cannot exclude the possibility that tail tendons suffer appreciable fatigue damage.
Most tendons experience stresses of 10–20 MPa when their muscles contract isometrically (Ker et al. 1988). In this respect, wallaby tail tendons are typical of tendons in general. However, some leg tendons, which function in running as energy-saving springs, experience much higher stresses. For example, the human Achilles tendon suffers a peak stress of
about 50 MPa in each running stride (calculated from data in Ker et al. 1987). Fig. 3 suggests that, at a typical stride frequency of 1.4 Hz (Cavanagh and Kram, 1990), this should cause failure after running for times of the order of only 1 h. Achilles tendons survive much longer runs than that, and it seems possible that such highly stressed tendons are more resistant to fatigue than wallaby tail tendons. We are investigating the question.
Appendix: creep lifetimes with sinusoidal stress Creep inevitably accompanies fatigue. The continuous lines in Fig. 3 show our estimate of the lifetime which would be obtained under sinusoidal loading if creep were the only contributor to damage. This appendix explains how this line was derived using the creep damage theory of Wang and Ker (1995). Equation 12 of that paper is:
D˙ = 2A9beB9s0/(12D), (1)
in which s0 is the applied stress and D˙ is the damage
parameter D differentiated with respect to time. Prior to damage, D=0 and at rupture D=(12s0/sf), where sf is the
yield stress. Wang and Ker (1995) give measured values of the parameters A9, b and B9 for the tail tendons of a particular wallaby. However, different values are to be expected for other wallabies, corresponding to the observed variations in creep lifetimes (Wang and Ker, 1995). For our present phenomenological assessment of creep lifetimes, the two parameters 2A9b and B9 are best considered as arbitrary, to be chosen by fitting.
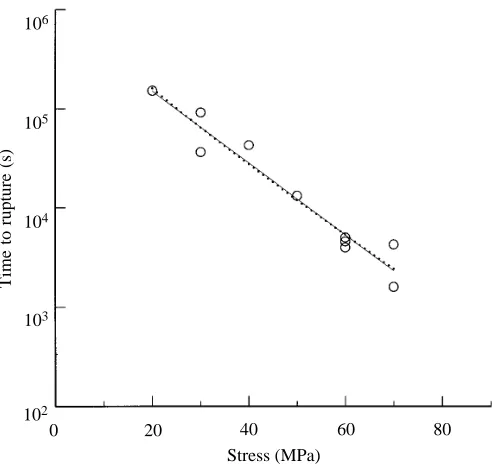
Fig. 9 shows lifetimes, on a logarithmic scale, plotted against stress, for tendons from the tail of the 25 kg wallaby in this study. The continuous line is the least-squares linear regression for these experimental points and the dotted line is the theoretical curve obtained by integrating equation 1, with 2A9b=5.6131027 and B9=0.06759 MPa21. s
f was taken as
144 MPa as in Wang and Ker (1995), but the exact value is not critical over the range of stresses used. The theoretical line is not quite straight but, over the range of stresses used, the curvature on this semi-logarithmic plot is slight enough for fitting to be straightforward. Since 2A9b does not affect the
slope, B9is adjusted first to make the slopes match. The line is then positioned by changing 2A9b.
In the experiments described in the present paper, the applied stress oscillates sinusoidally with time, t, the minimum stress being 11.5 MPa. In equation 1, s0 is replaced by
[11.5+sa(1+sin2pft)], where sa is the amplitude of the
oscillation (MPa) and f is the frequency (Hz). The peak stress, speak, is (2sa+11.5) MPa. We used the Runge–Kutta method to
integrate this version of equation 1 step-by-step starting from the initial conditions D=0 when t=0 and continuing until
D=(12speak/sf). The number of time steps required to follow
each oscillation properly is very large. Fortunately, a much smaller number of steps (say 1000) is adequate, because the damage due to creep depends only on the accumulated time in each stress range. The range of stresses can be adequately
45
Stress (MPa)
2.5 % strain 11.5
[image:5.612.54.292.502.693.2]10 Hz 70 Hz 2.2 Hz
852
sampled even with a step period much longer than the period of oscillation. To obtain the creep line plotted in Fig. 3, for
f=5.3 Hz, we used about 4000 steps at each of 120 values of
peak stress. To confirm that this procedure is valid, we checked the lifetime at sa=18.5 MPa with a step period of 0.006 s,
giving 31 steps for each oscillation. Over 23106steps were
required and gave the same result, to four significant figures, as 4000 steps. A similar argument indicates that creep lifetime is independent of frequency, as long as the period of oscillation is much less than the lifetime. Therefore, the one creep line in Fig. 3 covers all frequencies.
We thank Professor John Currey, Dr Peter Zioupos, Dr Andrew Sedman and two anonymous referees for helpful suggestions. We are most grateful to the veterinary staff of the
Zoological Society of London at Whipsnade Park for supplying the specimens.
References
ALEXANDER, R. MCN. ANDVERNON, A. (1975). The mechanics of hopping by kangaroos (Macropodidae). J. Zool., Lond. 177, 265–303.
BASMAJIAN, J. V. ANDDELUCA, C. J. (1985). Muscles Alive. Fifth edn.
Baltimore: Williams and Wilkins.
BEAUMONT, P. W. R. (1989). The failure of fibre composites: an
overview. J. Strain Analysis 24, 189–205.
BENNETT, M. B., KER, R. F., DIMERY, N. J. ANDALEXANDER, R. MCN.
(1986). Mechanical properties of various mammalian tendons. J. Zool., Lond. 209, 537–548.
CARTER, D. R. ANDCALER, W. E. (1983). Cycle-dependent and time-dependent bone fracture with repeated loading. J. Biomech. Eng.
105, 166–170.
CAVANAGH, P. R. ANDKRAM, R. (1990). Stride length in distance
running. In Biomechanics of Distance Running (ed. P. R. Cavanagh), pp. 35–63. Champaign, IL: Human Kinetics Books. DIAMANT, J., KELLER, A., BAER, E., LITT, M. ANDARRIDGE, R. G. C.
(1972). Collagen: ultrastructure and its relation to mechanical properties as a function of ageing. Proc. R. Soc. B 180, 293–315. HEARLE, J. W. S. (1967). Fatigue in fibres and plastics (A review). J.
Mater. Sci. 2, 474–488.
KER, R. F. (1981). Dynamic tensile properties of the plantaris tendon
of sheep (Ovis aries). J. exp. Biol. 93, 283–302.
KER, R. F., ALEXANDER, R. MCN. ANDBENNETT, M. B. (1988). Why
are mammalian tendons so thick? J. Zool., Lond. 216, 309–324. KER, R. F., BENNETT, M. B., BIBBY, S. R., KESTER, R. C. AND
ALEXANDER, R. MCN. (1987). The spring in the arch of the human foot. Nature 325, 147–149.
POURSARTIP, A., ASHBY, M. F. AND BEAUMONT, P. W. R. (1986). Damage accumulation during fatigue of composites. Scripta metallurgica 16, 601–606.
RABINOWITZ, S. ANDBEARDMORE, P. (1974). Cyclic deformation and
fracture of polymers. J. Mater. Sci. 9, 81–99.
TAKEMORI, M. T. (1984). Polymer fatigue. A. Rev. Mater. Sci. 14,
171–204.
WANG, X. T., DERUIJTER, M. R., ALEXANDER, R. MCN. ANDKER, R.
F. (1991). The effect of temperature on the tensile stiffness of mammalian tail tendons. J. Zool., Lond. 223, 491–497.
WANG, X. T. ANDKER, R. F. (1995). The creep rupture of wallaby tail tendons. J. exp. Biol. 188, 831–845.
WOLEDGE, R. C., CURTIN, N. A. ANDHOMSHER, E. (1985). Energetic Aspects of Muscle Contraction. London: Academic Press.
X. T. W
ANG, R. F. K
ER ANDR. M
CN. A
LEXANDER106
Time to rupture (s)
0 20 40 60
Stress (MPa) 105
104
103
102
[image:6.612.45.293.70.303.2]80