Correlation of Single Photon Emission CT with MR Image Data Using
Fiduciary Markers
Bradley J. Erickson 1 and Clifford R. Jack, Jr.1
PURPOSE: To describe our approach to mapping the functional information provided by single
photon emission computed tomography (SPECT) onto the anatomic template provided by MR, and to determine both the number of markers required to achieve accuracy and the impact of voxel shape on accuracy. METHODS: Point-to-point iterative minimization using externally fixed fiducial markers was involved and computer simulations were performed. Two types of validation studies were performed using a phantom of known dimensions. First, the spatial distortion that may be present in MR was investigated for spin-echo and gradient-recalled echo images. Next, the accuracy with which the SPECT image could be transformed to match the MR template was analyzed. The method is also demonstrated in four cases of patients with epilepsy. RESULTS: Computer simulations indicated that for voxel dimensions we expected to use, eight fiduciary markers would consistently produce acceptable accuracy. Simulations also showed that more isotropic voxels would be more accurate if voxel volume is held constant. The spatial accuracy of both spin-echo and gradient-recalled echo images of a phantom was accurate to within 3 mm. When the SPECT image of the same phantom was correlated with the MR image using this technique, internal marker errors were never greater than 3 mm, and the mean error was 2.2 mm. CONCLUSIONS: Images from different modalities can be accurately correlated using multiple fiduciary markers. SPECT and MR images of the given dimensions can be correlated to within 3 mm. The technique aids in clarification of the nature of SPECT perfusion abnormalities and in their anatomic localization.
Index terms: Single photon emission computed tomography (SPECT); Images, processing; M ag-netic resonance, image display
AJNR 14:713-720, May/Jun 1993
Multiple imaging modalities exist that use dif
-ferent physical phenomena to provide diagnostic
information. Computed tomography (CT) and
magnetic resonance (MR) imaging provide
de-tailed anatomic information as well as information
about the state of tissue hydration, which can
often indicate the presence of pathology and
possibly the nature of the disease
.
The addition
of contrast agents often improves this delineation
.
Because of their poor spatial resolution
,
other
modalities such as single photon emission
com-puted tomography (SPECT)
,
positron emission
tomography (PET)
,
and biomagnetism emphasize
functional information more than anatomic detail.
Received February 19, 1992; revision requested May 28; revision received and accepted July 10.
Dr Jack is supported in part by NIH Grant R55NS28374-0A 1.
1 Department of Radiology, Mayo Clinic, 200 First Street SW,
Roch-ester, MN 55905. Address reprint requests to C. R. Jack, MD.
AJNR 14:713-720, May/June 1993 0195-6108/93/1403-0713
© American Society of Neuroradiology
713
As a result, regional abnormali
t
ies that often
cannot be localized precisely with resp
e
ct to
in-dividual patient cortical topograph
y
would benefit
from integration with anatomical
e
xaminations
.
In this paper
,
we will inv
e
stigat
e
a method to map
the functional informa
t
ion provided b
y
SPECT
onto the anatomic template provid
e
d b
y
MR
.
Th
e
spatial registrat
i
on or correlation of SPECT image
data with MR was perform
e
d and te
s
t
e
d using
software written b
y
one of us (B
.
J
.
E.
).
The
phys-ical accuracy of the method will b
e
d
e
mon
s
trat
e
d
and e
x
ample cases shown
.
Mate
rials and Meth
ods
The Correlation Algorithm
714 ERICKSON
each data set. Above each image is a slider bar that identifies the current section number and may be used to
select the current image. Alternatively, the user may select a point on one image using a computer pointing device (in this case a mouse); the other two images are then updated so that they intersect the selected position. Lines indicating the planes of intersection are drawn on the images. The corresponding marker in the other volume is then identified. When a marker is identified in each data set, the user clicks on the "accept" button. This process is repeated for each marker. Typically, a few minutes are required to locate the fiduciaries accurately.
The second step is to use these corresponding reference locations to compute the transformation that will match the coordinate system of one data set with the other. There
are nine variables that specify the transformation: X, Y,
and Z translation; X, Y, and Z rotation; and X, Y, and Z scale factors (equation A). (Note that the center of rotation will be fixed at the origin of the volume.) The algorithm
uses known voxel dimensions for scale factors; the posi-tions of the markers are used to calculate the other
trans-formation values. An error function calculates the sum of the distances between the positions of points in one set and the transformed positions of the others. The error function (equation B) is minimized using a modified Brent
-Powell (1, 2) method. To assure that the global minimum
is reached, several iterations with different initial possible
(seed) values are automatically performed. In this way, a
local minimum found by an unlucky choice of seed values
does not lead to a suboptimal solution.
P'
=
R*
((P*
S) - C)+ T
where
P is the input point vector (X, Y, Z) P' is the transformed point vector R is the 3X3 transformation matrix S is the scale matrix
(A)
C is the translation matrix for center of rotation, and T is the translation matrix
N
Err =
L
1=
1 [P1(i) - P2'(i)f (B) whereP1 (i) is the position of the ith marker on MR
P2' (i) is the transformed position of the ith marker on SPECT, and
N is the number of markers
The final step is to use this transformation matrix to reformat geometrically one data set to match the other. In
this case, the SPECT data is transformed to match the MR
anatomic template. Trilinear interpolation is used to mini
-mize interpolation error.
S
imul
a
ti
o
n
S
tudi
es
The simulation studies were performed not with an
actual phantom, but with an idealized spherical body. To
determine the minimum number of markers required to
AJNR: 14, May/June 1993
provide acceptably accurate correlated data sets, simula-tions were performed using the above algorithm on a
synthetic data set consisting of 14 arbitrarily chosen
loca-tions distributed about the periphery of a spherical volume
18 em in diameter. (This number was arbitrarily chosen based on the maximum reasonable number of markers the authors felt could be attached to a subject's scalp, with 6 on the midline and 4 on each hemisphere.) These synthetic reference marker positions were rotated and transformed a known amount to create a second set (which mimics the
SPECT study). Both sets were then converted to voxel positions based on specified voxel dimensions. Simulations were run using from three to 14 points as reference fidu-cials, with the error calculated as the difference in location
of the markers in the data sets for all 14 points. Repeated
simulations ( 1 0) were run for each number of points; the points used were randomly selected from the 14 and, therefore, were not necessarily optimally distributed.
Phantom
Validation and
Clinical
Studies
The MR data sets were acquired at 1.5 T on a GE Signa (GE Medical Systems, Milwaukee, WI) system. The lack of significant chemical shift of vaseline at 1.5 T using the default clinical bandwidth of
±
16 kHz was confirmed pre-liminarily. In phantom studies, axial and sagittal gradient-recalled echo (GRE) volumetric (3-D Fourier transform) acquisitions (voxel size was 0.938 mm X 0.938 mm X 1.5 mm) as well as contiguous section sagittal spin-echo (SE) sequences (voxel size was 0.938 mm X 0.938 mm X 3 mm) were used. In clinical cases, only the axial GRE acquisitions were performed. The SPECT data sets were acquired with a three-headed Trionix crystal system (Tri-onix Research Laboratory, Twinsburg, OH) andrecon-structed using the standard reconstruction parameters with
cubic voxels measuring 3.56 mm on each side. Data was transferred to a dedicated workstation (RS/6000, IBM
Cor-poration, White Plains, NY) where image correlation was performed.
Each marker consisted of a strand of tissue paper that was soaked with Tc-99m and placed in a 3- to 4-mm section of plastic intravenous tubing. This was placed in a
#5 gelatin capsule (6 mm X 4 mm) containing vaseline,
which provides signal on T1-weighted MR images. These
fiducial capsules, visible on both MR and SPECT, were attached to the phantom (or in clinical cases, to the
pa-tient's scalp) for the duration of both imaging studies. The
phantom used for verification of accuracy was designed for validation testing in stereotactic neurosurgery. It con-sisted of a Plexiglas base from which six rods of varying
length projected vertically, and a surrounding Plexiglas cylinder bolted to the base. The radius of the cylinder was 7 em and the height was 18 em. The fiducial capsules were fixed at the tip of the six internal rods (which ranged in
height from 3 em to 14 em) within the phantom as well as
AJNR: 14, May/June 1993
3.5
E 2.5
E ::- 2 e
w
1.50.5
A
2.5
- 2
E E
::- 1.5 e
w
10.5
B
c
f
I
10 11 12 13 14 Number of markers used for correlation
10 11 12 13 14
Number of markers used for correlation
10 11 12 13 14 Number of markers used for correlation
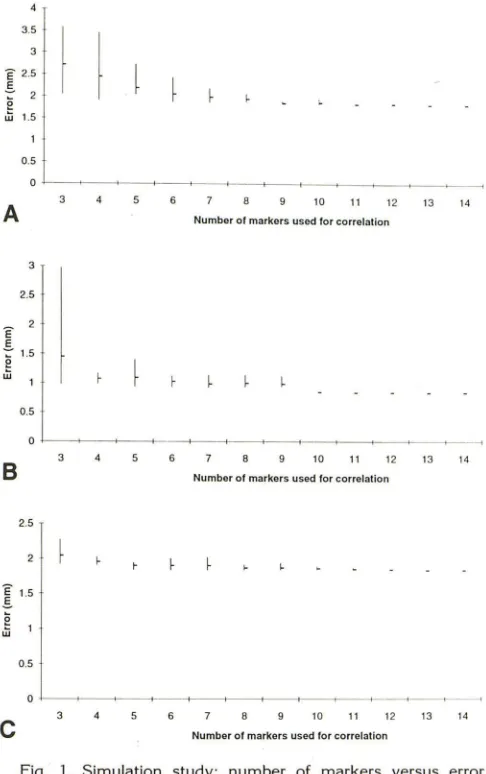
Fig. 1. Simulation study; number of markers versus error (mm).
A, MR voxel size: .938 X .938 X 1.5 and SPECT voxel size: 3.56 X 3.56 X 3.56; B, MR = .938 X .938 X 1.5 and SPECT =
2.0 X 2.0 X 2.0; C, MR = .938 X .938 X-1.0 and SPECT
='
3.56 X 3.56 X 3.56.used for correlation); the srx internal points of the phantom represent target points (ie, discrete sites of patient anatomy
to be correlated which thus were not used in computing
the correlated images).
Transformation of images was based on location of the reference points; the accuracy of the transformation was calculated using the location of the target points in the
transformed images. The precise X, Y, and Z coordinate
position of each internal and external marker on the
phan-tom had been measured to an accuracy of 0.1 mm. These were compared with the X, Y, and Z coordinates of both
internal and external points that were measured from the images acquired for these experiments. When identifying the position of the fiduciaries on MR scans, the signal void created by the Tc-99m-labeled intravenous tubing could be identified within the vaseline-filled capsules and this was
used to select the position of the fiducial marker; the point of greatest intensity was selected on SPECT scans. To tax
CORRELATION OF SPECT-MR DATA 715
the correlation program, the phantom was placed in the SPECT scanner rotated approximately 90° relative to its position when imaged by MR.
Two types of validation experiments were performed
using the phantom. First, for each of the three MR ac qui-sitions (axial and sagittal GRE and sagittal SE) the positions of the eight external reference markers on the phantom were used to transform the image to the coordinate system
used for physically measuring the phantom. This step was
necessary because the phantom was not rigidly fixed rel a-tive to the scanner. The second part of the validation study
tested the accuracy with which the location of the six
internal target markers on the SPECT image of the
phan-tom could be transformed using the eight external markers as fiducial reference points. The distance between the
positions of the six internal target markers on the MR and the transformed SPECT was computed.
Clinical cases were accrued by identifying patients
undergoing evaluation of epilepsy. In these cases, eight
reference markers were fixed to the patient's scalp prior to SPECT imaging and removed upon completion of the MR examination. Ictal SPECT studies in both patients were obtained by injecting the isotope (Tc-99m HMPAO) during
the somatic ictal behavior; interictal SPECT studies were obtained by injecting the same agent when no seizure activity was occurring.
Results
Simulation Studies
The number
of
markers
used for correlation
versus average error for various
voxel sizes is
shown in Figure
1
.
Figure
1
A depicts
this
rela-tionship using both the MR
and SPECT
vox
e
l
dimensions that we use
for clinical
imaging.
Pre-vious
investigators (3)
hav
e
postulated that the
error
is on the order of
the
lower
resolution image,
but
we
have
found
the relationship
to
be more
complex.
Figures
1B
and 1C
demonstrate that
decreasing
either
the
SPECT
voxel
size or
the MR
voxel
size
will
decrease the
average
error. The
graphs also indicate that
with smaller voxels
,
fewer
points
would
be
required to achieve the
lower
error reliably.
To assess the
effect of voxel shape on
accu-racy
,
simulations
were performed in which the
volume of
the voxel was held
constant (16
.
25
mm
3for
both
the MR
and
SPECT voxels)
,
but
the geometry was altered. A graph of errors for
different voxel
geometries is given
in
Figure 2. It
is apparent
that
isotropic voxels produce more
precise
correlations when voxel volume is held
[image:3.612.54.297.76.463.2]716
2.5
-E 2
E -:: 1.5
e w
0.5
ERICKSON
1x1x1625 3 95x3 95x 1.05 2 5x2 Sx2 5 Voxcl dimensions (X x Y x Z)
Fig. 2. Simulation study; shape of voxel versus error. Both MR
and SPECT voxel volume is held constant (16.25 mm3) as shape
was varied from long and thin to cubic. Dimensions shown are X
X Y X Z.
Phantom Studies
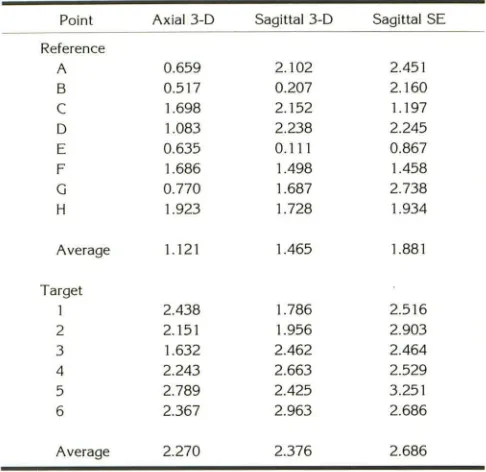
Table 1 shows the residuals for the eight
ex-ternal reference markers for each of the three MR
studies. The positions of the six internal target
markers in the three studies was determined, and
the distance from the known measured positions
was computed
.
This
error
did not
exceed
3 mm
for the GRE
sequence,
and averaged less than 3
mm for the SE sequence. Based on this data, we
feel safe in
concluding
that the MR template
obtained can accurately represent object
geom-etry, particularly with the 3-D GRE sequence.
The second part of the phantom study
ad-dressed the accuracy with which the SPECT
images could be transformed onto the MR
ana-tomic template. The eight external reference
points (mimicking markers glued to the patient's
scalp) were used to transform the SPECT image
of the phantom to match the axial GRE image of
the phantom. The six internal target points then
mimic intracranial anatomic structures and
indi-cate the measured error. Table 2
gives the
resid-uals (ie, the distance between the external
refer-ence
markers used for
computing
the
transfor-mation)
as
well as the actual errors (distance in
millimeters) for
each
internal target marker. The
average
error
for the six internal points in the
SPECT data was 2
.
245 mm
;
no error was greater
than
3 mm.
Clinical
Studies
Correlative
imaging studies
of
four
epilepsy
patients are illustrated
.
In the first two
,
the SPECT
studies were done interictally
;
in
the
second
two,
ictal SPECT studies were obtained. The SPECT
studies were
performed first
and followed
imme-diately by the MR. In
the
two interictal cases,
the
correlated
images
served
to clarify the nature of
perfusion abnormalities on the SPECT studies.
In
AJNR: 14, May/ June 1993
TABLE I: Spatial accuracy of MR
Point Axial 3-D Sagittal 3-D Sagittal SE
Reference
A 0.659 2.102 2.451
B 0.517 0.207 2.160
c
1.698 2.152 1.197D 1.083 2.238 2.245
E 0.635 0.111 0.867
F 1.686 1.498 1.458
G 0.770 1.687 2.738
H 1.923 1.728 1.934
Average 1.121 1.465 1.881
Target
1 2.438 1.786 2.516
2 2.151 1.956 2.903
3 1.632 2.462 2.464
4 2.243 2.663 2.529
5 2.789 2.425 3.251
6 2.367 2.963 2.686
Average 2.270 2.376 2.686
Note.-Reference points A-H were on the surface of the phantom and
were used for performing the correlation. The number shown is the error
at each point as given in equation B, and represents the maximum
accuracy expected. Target points 1-6 were within the cylinder; the value
shown is the distance from the known position of the point in the phantom
to the imaged position.
TABLE 2: Accuracy of correlation of SPECT with MR
A
B
c
D E F
G
H
Reference Point
Average residual: 1.913 mm
1 2
3 4
5 6
Target Point
Average error: 2.245 mm
Residual (mm)
1.256 2.759 2.850 2.756 2.767 2.857 0.000 2.059
Error (mm)
2.515 2.189 2.399 1.724 1.651 2.989
Note.-Residuals and errors of correlated SPECT data set versus axial
3-D MR data set in millimeters. Points A-H were external reference points used to correlate the SPECT to the MR, and are calculated according to
equation B. Points 1-6 were internal target points-the error is the distance between the known position and that calculated from the
[image:4.612.58.293.74.193.2] [image:4.612.315.558.93.329.2] [image:4.612.316.560.446.675.2]AJNR: 14, May/June 1993
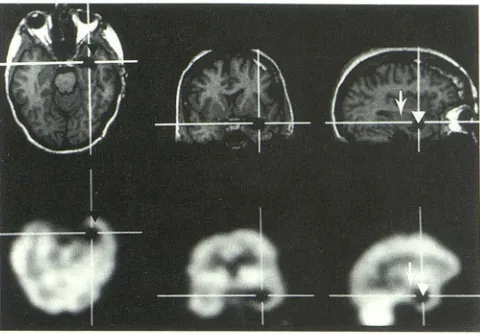
Fig. 3. An interictal scan in which a temporal lobe tumor
causes temporal lobe seizure activity. The precise nature of the
photopenic area on the SPECT study is ambiguous, but becomes
clear after correlation. Tumor (arrow), trapped temporal horn
(white arrowhead), uninvolved temporal cortex (black arrow-head).
both cases, the SPECT studies might have been
interpreted incorrectly without the insight
pro-vided by the correlated images. The patient in
Figure 3 had intractable epilepsy caused by a
known left temporal lobe glioma that had been
biopsied. The photopenic area in the left temporal
tip was originally (before correlation) interpreted
as a biopsy defect. After correlation, it became
apparent that it was the temporal horn, which
had been trapped by the growing medial temporal
lobe glioma
.
The correlated images demonstrate
precisely the level of isotope activity associated
with the three different tissue types in the medial
temporal lobe: uninvolved cortex was highest
;
tumor was intermediate
;
cerebrospinal fluid in
temporal horn was lowest.
In the second case, a left medial frontal
pho-topenic area was originally interpreted to
repre-sent the substrate of this patient's left
frontotem-poral epileptogenic activity, which had been
iden-tified on scalp electroencephalogram (EEG).
Following correlation, however
,
this area was
shown to represent merely volume averaging of
a prominent sulcus. A second photopenic area in
the inferior anterior
frontotemporal
area was
orig-inally thought to represent volume averaging
of
the horizontal portion of the
sylvian
fissure
.
After
correlation, however
,
this area is
shown
to be
i
n
the anterior portion of the
superior
temporal
gy-rus and is a more likely candidate for the
epilep-togenic zone (Fig
.
4).
The two ictal scans
shown here
demonstrate
the marked and
localized increased cerebral
per-fusion in the
region
of the
seizure focus known
CORRELATION OF SPECT-MR DATA 717
to
occur during
and
immediat
e
ly
after
i
cta
l
activ-ity. The
first case (Fig.
5) is
a
previously normal
9-year-old
girl who
develope
d
intractable
partial
motor
seizures
(focal
motor status)
i
nvolving the
left
arm and
leg
following a viral
illness
.
Although
not biopsy proved
,
the clinical, EEG, and
MR
evidence strongly suggested Rasmussen
ence
ph-alitis (4). The right
frontal
cortex
is
at
rophi
c
(particularly
inferiorly) with the exception of a
small edematous gyrus
in the region
of the
pr
e-Fig. 4. lnterictal scan of a patient with a left frontotemporal
lobe scalp EEG focus. Arrows demonstrate an area of
hypoper-fusion on the SPECT scan which was originally interpreted as
volume averaging of the horizontal portion of the sylvian fissure.
After correlation, however, this area is localized to the anterior
part of the superior temporal gyrus.
Fig. 5. An ictal scan in a patient with presumed Rasmussen
encephalitis. The MR demonstrates a prominent gyrus (upper
arrow) which corresponds with the area of increased perfusion on
SPECT (lower arrow). From the correlated images, we postulate that the patient's condition at the time of imaging studies (focal motor status epilepticus) was a result of ongoing cortical inflam-mation involving the premotor cortex and adjacent motor strip.
[image:5.612.56.296.77.244.2] [image:5.612.314.557.215.385.2] [image:5.612.314.557.467.636.2]718 ERICKSON
motor cortex.
On
ictal SPECT
,
the atrophic areas
are hypoperfused and the
ede
matous
area is
hyperperfused.
This
latter
area was felt
to
repres
e
nt
an area of active
inflammation and
perfectly matched the
so
matic
expression
of the
patient
's
seizures.
Figure 6A is an ictal scan of a
50-year-old man
who
cou
ld
voluntarily induce focal
motor
seizures
of the
l
eft
leg
. T
h
e
ictal
SPECT scan
demon-strates increased
perfusion
associated
with
sei-zure activity. Because surgical resection
of the
epileptogenic focus was
a
consideration, it
was
cruc
ial
to identify
its
ex
act location. Figure 68
A
B
Fig. 6. A, Ictal scan in a patient with recurrent seizures. Note no structural abnormality is present on MR. There is focal in
-creased perfusion on the SPECT scan when the imaging agent
was injected during a voluntarily induced seizure. One of the
fiducial reference markers can be seen on both the axial and
sagittal MR and SPECT images.
B, Same data set as A but using volume-rendering to show
3-D relationship between seizure focus (arrow) and cortical topog-raphy. The site of the hot spot (the leg portion of the homunculus
on the precentral gyrus) perfectly matches the seizure type-focal motor leg. Visualization of this relationship between functional
anatomic location and local perfusion abnormality is only possible with integrated images.
AJNR: 14, May/June 1993
shows
a volume rendering of the correlated
SPECT
combined with the MR. The seizure focus
is
seen
to lie on
the
precentral gyrus.
Discussion
Despite a growing
interest
in image correlation
and published reports of clinical application
,
there
is little quantitative experimental documentation
in the imaging literature addressing the accuracy
with which image correlation can be performed.
This paper attempts to address that void.
Meth-ods for performing point-to-point image
correla-tion and surface matching have been described
for correlation of anatomic imaging studies (CT
and MR) and PET
.
The point-to-point method of
Arun et al
(5)
uses
four
reference fiducial points
to
compute
the rotation and translation factors.
Simulations described here suggest that at least
eight reference
points are necessary with the
voxel dimensions used clinically. Point-to-point
matching has also been done using traditional
neurosurgical
stereotactic
methods (6) which
in-volve surgically mounting a head frame.
Con-versely
,
the technique we describe is noninvasive
and
,
therefore
,
is widely applicable for diagnostic
imaging.
A second approach involves retrospectively
matching th
e
skin surface defined by two
differ-ent imaging studies. This approach has some
definite advantages
(7)
over point-to-point
meth-ods, but it also has some weaknesses
.
No
docu-mentation
of the accuracy of localization of the
"
skin
"
localized by MR versus the
"skin"
localized
by SPECT
,
PET
,
or CT has been shown
.
Fur-thermore
,
automated surface tracking is probably
i
mpractical
for
SPECT because of the poor
vis-ualization of skin
.
In a recent report on
SPECT-MR surface fitting
,
it was necessary to trace the
brain
surface
manually on successive 2-D
sec-tions
,
and
the apparent accuracy was evaluated
in a
qualitative
fashion (8)
.
A third technique (9)
involves
the determination of the
interhemi-spheric
plane and subsequent interactive
,
user-determined
matching of successive sagittal
sec-tions
.
Error quantification (which
averaged 3
.
8
mm)
was
based on the
standard
deviation of
the
transformation
parameters
for
adjacent
sections.
Formal studies
validating the accuracy
of fit
by
using
phantoms of known
dimensions have not
been published to our knowledge.
The technique we
describe
is
generally
appli-cable,
does
not rely
on the
assumption that
all
[image:6.615.55.296.244.605.2]AJNR: 14, May/June 1993
and does not require a subjective task like tracing
or matching a surface. One weakness of this
approach is that the markers must be placed
prior to imaging: the correlative imaging studies
must therefore be planned prospectively. A
cor-ollary problem is that it is more difficult to
com-pare studies in time. However, standardization of
landmarks may guide the positions of reference
fiduciaries, and relatively permanent marks may
be made on the skin (as in radiation treatment)
to identify marker positions in follow-up studies.
The simulations demonstrate the intuitive
con-cept that improving the resolution of either data
set results in a better fit. In the process of
con-ducting this study, we considered the more
chal-lenging question of the optimal geometry of
vox-els, because it can be manipulated by modalities
like MR. In the case of MR, it is possible to obtain
anisotropic voxels; in fact,
for
SE techniques,
it
is nearly obligatory. We have demonstrated that
more isotropic voxels provide increased accuracy
when the volume of the voxel is held constant.
The possibility that spatial distortion may be
present in MR images has not been addressed in
previous reports of image correlation; rather,
the
absolute accuracy of MR has been taken as a
given. A recent investigation (W. Pavlicek,
per-sonal communication,
1991)
indicates that
even
with state-of-the
-
art equipment, significant
geo-metric distortion might be present at the
periph-ery of the field of view with GRE acquisitions,
and with narrow bandwidth SE
acquisitions-hence the need to address the issue of how
accurately the MR anatomic template reproduces
object geometry.
We evaluated MR accuracy
in
these
experi-ments for SE and GRE acquisition sequences.
We also evaluated the possible effect that
the
plane of acquisition might have on the spatial
accuracy of MR, since nonuniform performance
of the different gradient coils has been a problem
in the past. While SE sequences
are
less
subject
to spatial distortion that
is caused by static
r:nag-netic
field
inhomogeneity,
they
have relatively
poorer resolution
in the
section-select
direct~onthan
volume acquisitions. This poorer
resolution
results in
the greater
error for
SE
seen in
Table
1.
The spatial accuracy of 3-D GRE
sequences
has not,
to our
knowledge,
been
documented
with respect to
a phantom
of known physical
dimensions
.
Susceptibility
artifacts were of
par-ticular
concern because of
the location of the
reference fiducials
on
the surface (periphery) of
the
object of interest
(spatial warping would be
CORRELATION OF SPECT -MR DATA 719
most
pronounced at
the periphery of the field of
view)
.
However, with
the (default)
bandwidth
used,
spatial registration errors are not significant
regardless of the technique (SE or GRE)
or plane
of image
acquisition
.
No
significant
difference in
error was apparent between the axial and sagittal
sequences.
We are not
aware that anyone
has
fully
ad-dressed
the question of determining the
bounda-ries
of abnormal perfusion on SPECT scans. The
method used here (Fig. 68) finds the
boundary of
abnormal perfusion by determining the maximum
gradient within a user-defined region of interest
.
This method was chosen because it was objective
and seems reasonable. However
,
more work
is
needed in this area
to document that
the borders
determined in
this fashion correlate with
borders
of pathologically involved tissue
.
Finally, this is the first report to our knowledge
describing the correlation and 3-D display of ictal
SPECT and MR
studies
.
The limited in vitro
half-life of Tc-99m HMPAO
restricts
the clinical
ap-plicability of
ictal SPECT at this
time in North
America. However
,
anticipated future availability
of longer lived compounds should enable routine
ictal SPECT imaging. We feel that correlated ictal
SPECT
-MR
studies will
have
a major impact on
the
management
of patients with medically
in-tractable epilepsy.
Conclusions
A
novel method for correlating MR and SPECT
images has been
described and the accuracy of
this
method has been
shown
.
The
investigation
included
the effect such variables
as
voxel size
and shape have on accuracy
.
Clinical examples
in which accurate correlation of SPECT images
with MR proved useful were presented
.
The ability
to view functional information such as that
pro-vided by
SPECT with anatomic information
pro-vided
by
3-D MR significantly improves the
di-agnostic
value
of either alone
.
However
,
it ap
-pears reasonable that an accurate method of
correlation
,
such a
s
that described here
,
i
s
re
-quired.
Acknowledgments
We thank Steve Goerss for providing the phantom, and
Frank W. Sharbrough, MD, and Robert V. Groover, MD,
720
ERICKSONReferences
1. Powell MJD. An efficient method for finding the minimum of a
function without calculating derivatives. Comput J 1964;7:155
2. Brent RP. Algorithms for minimization without derivatives. Englewood
Cliffs, NJ: Prentice-Hall, 1973:67-83
3. Levin DN, Pelizzari CA, Chen GTY, et al. Retrospective geometric
correlation of MR, CT and PET images. Radiology
1988;169:817-823
4. Aguilar MJ, Rasmussen T. Role of encephalitis in pathogenesis of
epilepsy. Arch Neurol1960;2:663-676
5. Arun KS, Huang TS, Blostein SD. Least squares fitting of two 3D
point sets. IEEE t-PAMI 1987;9:698-700
AJNR: 14, May/June
1993
6. Kearfott KJ, Rottenberg DA, Knowles RJR. A new headholder for
PET, CT, and NMR imaging. J Comput Assist Tomogr 1984;8:12
17-1220
7. Chen GTY, Pelizzari CA. Image correlation techniques in radiation
therapy treatment planning. Comput fried Imaging Graphics
1989; 13:235-240
8. Holman BL, Zimmerman RE, Johnson KA, et al. Computer-assisted
superimposition of magnetic resonance and high-resolution
techne-tium-99m-HMPAO and Thallium-201 SPECT images of the brain. J
Nuc fried 1991;32:1478-1484
9. Kapouleas I, Alavi A, Alves WM, Gur RE, Weiss DW. Registration of
three-dimensional MR and PET images of the human brain without