Analysis of the echolocation calls of bats within the time and frequency domains has become commonplace with improvements in transducer design and portable field apparatus (Pye, 1992; Jones, 1993). Measurement of the intensity of echolocation calls has, however, remained a difficult challenge, partly because of the transient nature of the calls (Pye, 1980). The intensity of bat echolocation calls has implications for energetics (Speakman et al. 1989; Speakman and Racey, 1991), foraging ecology (Neuweiler, 1983), ranging (Fenton, 1980) and for the interactions between bats and tympanate moths (Surlykke, 1988). Previous studies of call intensity, such as those by Griffin (1958) and Novick (1958), were limited by the technology available at the time, but did provide information on the relative call intensities between species of bats. The most accessible method for measuring the intensity of short-duration pulsed sounds is that of peak pressure, which quantifies the maximum pressure reached during the pulse, even if it is maintained for a fraction of the duration of the pulse. This method provides only limited information on the acoustic power of the call because the average intensity over the duration of the pulse depends on the mean value of the square of the instantaneous pressure with time. Therefore, the total energy of the pulse depends on the time integral of the square of the function defining the pressure waveform. The peak level recorded will depend on the time resolution of the recording device and on the harmonic and phase relationships of the frequency components within the call (Dusenbury, 1992). Calls with similar frequency sweeps
and durations may differ widely in peak pressure–energy relationships depending on the shape of the pressure– amplitude envelope. This issue is of particular importance in the interaction between the echolocation calls of bats and the ears of moths, which appear to be energy detectors (Adams, 1971; Surlykke et al. 1988). Studies of dolphin sonar have avoided some of these problems by computing the energy flux density, E, of the signal (Au and Snyder, 1980; Au et al. 1985) and by compensating for the density of the transmission medium, which makes it possible to compare directly the source level of cetacean and chiropteran sonar systems (Au, 1993).
Most previous studies of bat echolocation call intensity have concentrated on stationary bats held a known distance from a microphone (Griffin, 1958; Novick, 1958; Schnitzler, 1968; Shimozawa et al. 1974). While this standardises the distance of the bat from the microphone, it does not allow for the fact that echolocation and flight appear to be energetically coupled (Speakman et al. 1989; Speakman and Racey, 1991) and that flying bats appear to produce stronger calls than stationary ones (Griffin, 1958; Mohres and Neuweiler, 1966). A few studies (Griffin et al. 1963; Mohres and Neuweiler, 1966; von Joermann and Schmidt, 1981; Surlykke et al. 1993; Miller and Treat, 1993) have measured echolocation call intensity during flight, and they provide the best information about the functional significance of call intensity.
The temporal and frequency variables of the echolocation calls of flying bats are limited in resolution by a number of
475
The Journal of Experimental Biology198, 475–489 (1995)
Printed in Great Britain © The Company of Biologists Limited 1995
Echolocation call intensity was measured in the laboratory for five species of British insectivorous bats in free flight and in the hand. All species showed similar call intensities of between 80 and 90 dB peSPL (peak equivalent SPL) at 1 m during flight except Plecotus auritus, whose call
intensity was between 68 and 77 dB peSPL at 1 m. Calls from stationary bats were about 13 dB less intense than calls during flight. A method is proposed to measure the root mean square (rms) amplitude of echolocation calls and, hence, to calculate the energy flux density of the call.
The constant-frequency calls of Rhinolophus hipposideros have energy flux densities approximately ten times higher than those of bats using frequency-modulated calls as a result of their longer durations and lower crest factors. It is argued that the low-intensity calls of P. auritus allow it to approach tympanate moths more closely before triggering their escape response.
Key words: bat, echolocation, energetics, sensory ecology, foraging.
Introduction
Summary
ECHOLOCATION CALL STRUCTURE AND INTENSITY IN FIVE SPECIES OF
INSECTIVOROUS BATS
DEAN A. WATERS ANDGARETH JONES
School of Biological Sciences, University of Bristol, Woodland Road, Bristol BS8 1UG, UK
476
factors. Solid dielectric capacitance microphones often show a non-linear frequency response and unpredictable reactions to differing conditions of temperature, humidity and the tension applied to the membrane (Kuhl et al. 1954; Fenton, 1988). The directionality of the call as emitted by the bat with respect to its angle to the microphone will influence the sound spectrum recorded. Frequency-dependent ‘nulls’ in the acceptance angle of the microphone contribute to this problem, but it is largely caused by the geometry of the source influencing the emission pattern of the sound from the bat. The geometry results in greater directionality at higher frequencies (Hartley and Suthers, 1987, 1989; Shimozawa et al. 1974) and an altered sound spectrum as the bat’s angle with the microphone’s surface deviates from normal. Finally, the attenuation of ultrasound by the atmosphere is more pronounced at higher frequencies (Griffin, 1971), resulting in a predicted alteration of sound spectrum with increasing distance from the bat (Pye, 1992). All these factors interact to make it difficult to define the ‘true’ structure of the echolocation call (Pye, 1993). The most important implication of these limitations is that the higher-frequency components of calls may go unrecorded, and these frequencies limit the spatial resolution of the call (Møhl, 1988).
This study provides absolute peak sound pressure measurements of the echolocation calls of five species of bats during flight in the laboratory and whilst stationary. Calculations are made of the energy flux density of the calls based on the rms (root mean square) measurements of a subsample of calls. The call structures are described from recordings made in a frequency-linear manner. The findings are discussed with reference to the foraging ecology of the species investigated.
Materials and methods Animals and husbandry
All bats were obtained under licence from English Nature, either from hibernation sites within Avon, UK, or by hand-netting at summer day-roosts. Two individuals each of Pipistrellus pipistrellus (Schreber), Myotis brandtii (Eversmann), M. nattereri (Kuhl) and Plecotus auritus (Linnaeus) were obtained. One Rhinolophus hipposideros (Bechstein) was obtained from the wild. We also studied another R. hipposideros which was being rehabilitated after being found injured. This individual was not used for the flight experiments. Bats were maintained either in 20 cm325 cm330 cm boxes and exercised daily, or were allowed to fly freely in a 3 m33 m32 m room with hessian roosting sites attached to the walls. Bats were maintained under a 14 h:10 h light:dark regime at 20 ˚C and had free access to fresh drinking water. Mealworms (larvae of the beetle Tenebrio molitor) were available ad libitum as food. Rhinolophus hipposideros was provided with Drosophila for food.
General experimental methods
All experiments were performed in a 4 m34 m32.6 m room
lined with 1 cm thick sound-attenuating foam. Environmental conditions were maintained at 12 ˚C and 85 % relative humidity, similar to those experienced by bats in the field in the summer. Bats were released from the hand at a height of 1.4 m and flew 3 m towards a frequency-linear recording system. A multiflash stereophotogrammetry system was positioned 3 m to the side and was used to record the position of the bat along its flightpath. The timing of the flashes, and hence the position of the bat, could be correlated with each echolocation call to establish the three-dimensional distance of the bat from the microphone when the call was emitted. Recording system
The recording system consisted of a Brüel and Kjær 6.35 mm microphone, type 4135 (without protective grid), attached to a type 2204 sound pressure meter. A 2 cm diameter plastic ring was placed around the microphone to prevent collision of the bat with the delicate microphone membrane. The addition of this ring did not noticeably affect either the directionality or the frequency response of the system. The signal from the meter was passed through a custom-made high-pass filter to attenuate signals below 4 kHz and recorded onto one channel of a Racal Store 4DS instrumentation recorder at 76 cm s21. Overall system response from 4 to 120 kHz was ±3 dB. A second microphone (PSM-3, QMC Instruments) was positioned close to the flashgun array to record the faint ultrasound pulses produced when the flashguns fired. This was recorded onto a second channel of the instrumentation recorder and allowed each image of the flying bat to be correlated with the corresponding echolocation call.
Multiflash stereophotogrammetry
The multiflash stereophotogrammetry apparatus consisted of two motor-driven Nikon SLR cameras (FE and FM2 models) equipped with 55 mm lenses mounted in parallel 250 mm apart on a machined plate. Eight Sunpak 622 flashguns with a Guide number of 50 (ISO 100/meters) were connected to a sequential relay box and could be fired in volleys of eight at frequencies of 20 or 30 Hz. The flashguns were placed on the floor under the flightpath of the bat and were triggered by the cameras’ shutters. In order to prevent sound from the cameras and flash system altering the bat’s echolocation call structure, the flashguns were placed in a sound-proofed glass aquarium tank, and the cameras and motordrives were covered in sound-attenuating foam. Flash power was switched to 1/32 of full power, producing an approximate pulse duration of 1024s. Exposures were typically f8 at 0.5 s on Ilford XP2 400 ASA film. The cameras were triggered simultaneously via an electrical switch, and the 0.5 s shutter speed allowed eight images to be recorded on each frame. Films were developed and enlarged to A4. A representative photograph from a stereo pair of an individual of P. auritus in free flight towards the microphone is given in Fig. 1.
Reconstruction of the flight paths
Photographic data were digitised on a BBC Master Series
microcomputer through a Summagraphics One digitising tablet. Data were transferred to an IBM computer and recalculated in three dimensions following methods given by Wolf (1983). The accuracy of this technique and the algorithms used are discussed in detail by Spedding et al. (1984) and Rayner and Aldridge (1985), and some applications of this technique are given in Jones and Rayner (1988, 1989a, 1991) and Rayner et al. (1989).
Analysis
Sequences where the bat was flying in an apparently straight line towards the microphone were printed as projected onto the x,y and y,z planes. The 23 dB angular acceptance of the microphone (up to 100 kHz) was 60 ˚, and images were only accepted if the incident angle of the bat’s trajectory was less than this. An angle of 30 ˚ was chosen for the 23 dB limit of the echolocation call of the bat because of its directionality, based on Schnitzler and Grinnell (1977), Shimozawa et al. (1974) and Hartley and Suthers (1987, 1989). Again, sequences were not used if the microphone was outside this angular range. Echolocation calls and the timing sequences from the flashguns were analysed simultaneously on the two channels of a Kay DSP Sonagraph model 5500. Since each pulse from the flashgun corresponded to an image of the bat, the timing of an echolocation call could be correlated with an image or with a fixed point between images. The distance of the bat at the time of the echolocation call could then be calculated using simple three-dimensional geometry. The time taken for the call to reach the microphone caused a small error in calculating the position of the bat at the time of the call. This was estimated to be less than 30 mm at 2 m from the microphone, the error reducing as the bat approached the microphone. The peak amplitude of the call was measured on the Sonagraph as the logarithmic amplitude of the envelope of the call averaged every 0.1 ms. This averaging constant was chosen since further expansion of the time-base produced no additional increase in the peak amplitude. The recorded amplitude was compared with calibrating signals of constant-frequency sine waves of known sound pressure levels. The difference (in dB) between the measured signal and the calibrating signal was then used to calculate the rms sound pressure level of a constant-frequency sine wave of equivalent peak-to-peak amplitude, providing the measure of dB peSPL (Stapells et al. 1982; Møhl, 1988). All other call analysis was performed on the Sonagraph by using a waveform display for call duration, a 512-point FFT transform sonagram with Hamming window for visual inspection of the signal and a
1024-point FFT power spectrum with Hamming window for peak frequency and frequency range measurement (frequency resolution 928 Hz, real-time signal).
Stationary bats
After conducting the flight measurments, the bats were rested for between 2 h and 1 day. A ruler was taped to the sound pressure meter, which was placed in the centre of the sound-proofed room at a height of 1.5 m. Bats were held loosely in the hand at a distance of 10 cm from the microphone. Bats tended to produce very low-amplitude calls while being held, but just prior to take-off increased their call amplitude. It was assumed the bat did this to orientate over a greater range prior to flight. Only these higher-intensity calls were recorded onto the instrumentation recorder. Call intensity was analysed as above.
Calculation of energy flux density Theory
The measurement of peak pressure of the echolocation calls provides little information on the power content of the call and, hence, little information on the metabolic costs necessary to produce it. The energy flux density, E, is a measure of the energy content of a sound pulse at 1 m from the source, assuming that the source is isotropic. There appears to be some ambiguity in the definition of E in terms of the units involved. Møhl (1988) uses the units of Pa2s, but Au (1993) interchanges these with J m22when E is compensated for the density and velocity of sound in the medium. In general, E can be calculated as:
E = ∫T0P2(t)dt (in Pa2s) (1) or:
E = 1/rc∫T0P2(t)dt (in J m22) , (2) where E is energy flux density, P(t) is the time-varying sound pressure, T is the duration of the signal (s), ris the density of the medium (kg m23) and c is the velocity of sound in the medium (m s21).
[image:3.858.198.572.106.192.2]Evaluation of the integral in the above equations presents some difficulty, since the function defining the pressure waveform is unknown. In practice, it could be evaluated from a digitised time series of the waveform, as in Troest and Møhl (1986) and Hartley et al. (1989), graphically from a print of the waveform (which is time consuming), or a measure of E could be produced from the measurement of the root mean square (rms) pressure of a signal. While a direct measurement using a digital time series is likely to be the most accurate, Fig. 1. Left-hand stereo photograph
478
software for this type of analysis may need to be specifically written and is only now becoming commercially available. For this reason, measurement of the rms pressure of the signal was chosen because of the availability of conventional analogue meters.
The rms pressure of a finite duration signal can be evaluated as:
Prms = √1/T∫T0P2(t)dt , (3) where Prmsis root mean square pressure (N m22).
From equations 1 and 3, it can be shown that:
E = Prms2T (in Pa2s) (4) and:
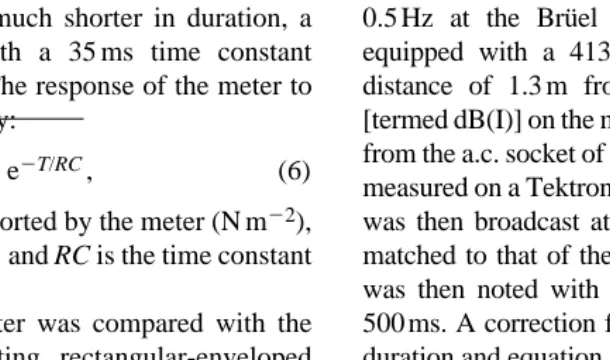
E = 1/rcPrms2T (in J m22) . (5) Conventional sound pressure meters measure the rms of sound sources using long time constants (a few hundred milliseconds) and produce accurate rms measures of sound levels which vary little over time. When the duration of sound pulses is less than the duration of the time constant, the meter produces a readout which is less than the actual rms pressure of the sound pulse. Since this function is well defined when the duration of the pulse is accurately known, a compensation factor can be calculated and added to the meter reading to produce the rms pressure of the pulse. Prestwich et al. (1989) used this technique to calculate the rms pressure of calls of hylid frogs by using a meter with a time constant of 125 ms. Since bat echolocation calls are much shorter in duration, a Brüel and Kjær 2204 meter with a 35 ms time constant (=‘impulse response’) was used. The response of the meter to a short duration pulse is defined by:
Pm = Prms√1 2e2T/RC, (6) where Pmis measured pressure reported by the meter (N m22), Prmsis actual rms pressure (N m22) and RC is the time constant of the meter (s).
The actual response of the meter was compared with the predicted response by broadcasting rectangular-enveloped 50 kHz sine-wave pulses at various durations at the meter equipped with a Brüel and Kjær 4135 6.35 mm microphone
(grid off). The results of the actual meter response and the predicted response (Fig. 2) differ by less than ±0.5 dB, and our measurements were highly repeatable, differing by ±0.1 dB at most.
Procedure
Sequences of calls from the bats in free flight were examined on a Kay DSP 5500 Sonagraph. We selected three calls with a good signal-to-noise ratio and high maximum frequency for each bat, produced when the bat was facing the microphone. The sequence of tape containing the calls was replayed in real time and digitally sampled at a rate of 400 kHz using an Ultra Sound Advice S-350 digital memory recorder. Sampled sequences were downloaded in analogue form at 103time expansion into the Sonagraph. The call of interest was edited out and digitally compiled with 11 s of silence either side of it. The call sequence was then downloaded onto a Sony DAT recorder TCD-D3. To replay the signal, the analogue DAT recording was sampled into the Ultra Sound Advice S-350 at a sampling rate of 40 kHz and recompressed back to real time. The signal was amplified and broadcast through an Ultra Sound Advice amplifier and loudspeaker. Examination of the broadcast call revealed no major changes in frequency or temporal structure from the original call, although low-frequency tape noise had increased and some high frequencies had been attenuated by the atmosphere (Fig. 3). The broadcast call was replayed at a rate of 0.5 Hz at the Brüel and Kjær 2204 sound pressure meter equipped with a 4135 6.35 mm microphone (grid off) at a distance of 1.3 m from the speaker. The impulse response [termed dB(I)] on the meter was noted. The peak-to-peak voltage from the a.c. socket of the meter and the duration of the call were measured on a Tektronix 5113 oscilloscope. A 50 kHz sine wave was then broadcast at the meter and the peak-to-peak voltage matched to that of the call. The dB SPL reading of this signal was then noted with the integration time of the meter set to 500 ms. A correction factor for the call was calculated from its duration and equation 6 and added to the dB(I) value to produce the rms value of the call. The peak pressure reading (dB SPL+3.01) minus the corrected dB(I) value yields the dB
D. A. W
ATERS ANDG. J
ONES5
0
−5
−10
−15
−20
Sound pressure reading (dB)
1 3 10 30 100 300 1000
[image:4.858.256.561.594.774.2]Sound pulse duration (ms) Fig. 2. Predicted (solid line) and actual (dashed line)
equivalent crest factor of the call, necessary for the calculation of the energy flux density from the free-flight call intensity data.
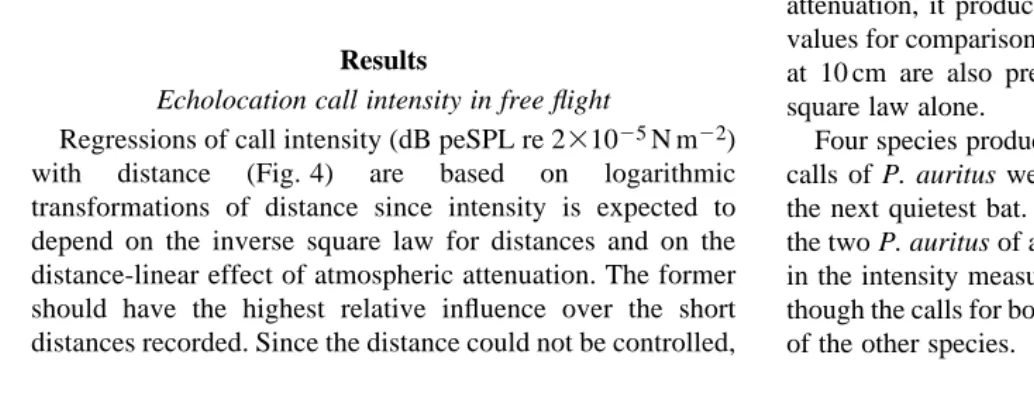
Results
Echolocation call intensity in free flight
Regressions of call intensity (dB peSPL re 231025N m22) with distance (Fig. 4) are based on logarithmic transformations of distance since intensity is expected to depend on the inverse square law for distances and on the distance-linear effect of atmospheric attenuation. The former should have the highest relative influence over the short distances recorded. Since the distance could not be controlled,
least-squares regression is an inappropriate model (Sokal and Rohlf, 1981), and we used reduced major axis regressions to provide the least bias since the variances of the measurement errors could not be estimated (Rayner, 1985). Assuming the inverse square law for the intensity–distance relationship (and hence the inverse distance law for the pressure–distance relationship), a regression should result in the predicted 6.02 dB drop with doubled distance. The calls of two individuals did not show a significant relationship between call intensity and distance from the microphone, one P. auritus and the only flying R. hipposideros (Fig. 1; Table 1). The calls of all of the other bats showed a significant relationship, and the slopes of the regression line were steeper than the 26 dB predicted from the inverse square law.
Regression of the intensity data (Table 1) gave intensities at a distance of 1 m. For individuals whose calls showed a significant relationship between intensity and distance from the microphone, the value at 1 m is taken from the regression. For the two exceptions, the values are estimated from the sound pressure levels emitted close to 1 m. The calculation of peak intensities is usually performed to provide a measure of the intensity at a default distance of 10 cm from the bat’s mouth (Pye, 1980) using the inverse square law. Because this calculation takes no account of the effect of excess atmospheric attenuation, it produces only a rough estimate so, to provide values for comparison with the literature, the calculated values at 10 cm are also presented (Table 1) assuming the inverse square law alone.
Four species produced calls of similar intensities, while the calls of P. auritus were less intense by ù7.1 dB than that of the next quietest bat. There was a large discrepancy between the two P. auritus of about 9 dB. There was almost no overlap in the intensity measurements between these two individuals, though the calls for both bats were of lower intensity than those of the other species.
48
36
24
12
Relative sound pressure level (dB)
0 33 66 99 132
[image:5.858.52.297.105.294.2]Frequency (kHz)
Fig. 3. Power spectrum of a recorded call of Myotis nattereri (lower trace), and the same call after sampling, editing, rebroadcasting and re-recording (upper trace). Traces are deliberately separated by 12 dB for clarity.
Table 1. Summary of call intensity data from bats in flight and while held in the hand
Flight: Flight: Stationary
intensity equivalent bats:
at 1 m E E dB peSPL dB peSPL Difference
Bat (dB peSPL) Slope r2 P (Pa2s) (J m−2) at 10 cm at 10 cm dB
P. pipistrellus 1 83.2 −8.7 0.64 <0.001 8.38×10⁻⁵ 2.01×10⁻⁷ 103.2 85±2.4 −18.2
P. pipistrellus 2 86.2 −14.3 0.51 <0.001 1.40×10⁻⁴ 3.39×10⁻⁷ 106.2 87±2.4 −19.2
M. brandtii 1 88.9 −9.6 0.75 <0.001 1.26×10⁻⁴ 4.73×10⁻⁷ 108.9 101±2.2 −7.9
M. brandtii 2 89.3 −11.3 0.36 <0.001 2.26×10⁻⁴ 5.45×10⁻⁷ 109.3 92±2.4 −17.3
M. nattereri 1 89.8 −9.5 0.38 <0.001 2.53×10⁻⁴ 6.08×10⁻⁷ 109.8 96±1.2 −13.8
M. nattereri 2 82.8 −11.3 0.44 <0.001 4.15×10⁻⁵ 3.29×10⁻⁷ 102.8 93±2.1 −9.8
P. auritus 1 68.6 −8.1 0.02 NS 1.11×10⁻⁶ 2.68×10⁻⁹ 88.6 73±1.5 −15.6
P. auritus 2 77.1 −11.6 0.28 <0.001 3.71×10⁻⁶ 1.18×10⁻⁸ 97.1 75±1.8 −22.1
R. hipposideros 1 NA NA NA NA NA NA NA 95±2.5 ΝΑ
R. hipposideros 2 85.4 −12.9 0.11 NS 2.62×10⁻³ 6.29×10⁻⁶ 105.4 100±4.3 −5.4
Slope is the decibel decrease with doubled distance from the microphone.
[image:5.858.53.570.558.767.2]480
D. A. W
ATERS ANDG. J
ONES94
90
86
82
78
74
0.5 0.7 1.1 1.3 1.5 1.7 1.9
P.p 1 94
90
86
82
78
74
0.7 0.9 1.3 1.5 1.7 1.9 P.p 2
94
90
86
82
78
74
0.5 0.7 0.9 1.1 1.3 1.5 1.7 1.9 M.b 2 94
90
86
82
78
74
0.5 0.7 0.9 1.1 1.3 1.5 1.7 1.9 M.b 1
94
90
86
82
78
74
0.9 1.1 1.3 1.5 1.7 1.9 M.n 1
94
90
86
82
78
74
0.5 0.7 0.9 1.1 1.3 1.5 1.7 1.9 M.n 2
78
74
70
66
62
0.5 0.7 0.9 1.1 1.3 1.5 1.7 1.9 P.a 2 78
74
70
66
62
0.5 0.7 0.9 1.1 1.3 1.5 1.7 1.9 P.a 1
94
90
86
82
78
74
0.5 0.7 0.9 1.1 1.3 1.5 1.7 1.9 R.h 1
Call intensity (dB peSPL)
Distance to microphone (m)
0.9 0.5
0.5 0.7
[image:6.858.170.563.107.780.2]1.1
Fig. 4. Sound pressure level of echolocation calls with distance from the microphone for bats in free flight. Levels are converted into dB peSPL using a reference level of 231025N m22. Note that for Plecotus auritus 1 and P.
auritus 2 the y-axis scale is
different. P.p 1, Pipistrellus
pipistrellus 1; P.p 2, P.
pipistrellus 2; M.b 1, Myotis brandtii 1; M.b 2, M. brandtii 2;
M.n 1, M. nattereri 1; M.n 2, M.
nattereri 2; P.a 1, P. auritus 1;
P.a 2, P. auritus 2; R.h 1,
Rhinolophus hipposideros 2.
Echolocation call intensity in the hand
The dB peSPL values of the echolocation calls of stationary bats measured at 10 cm from the microphone (Table 1) are lower than those calculated for 10 cm from the free-flying bats. Averaged across species, this difference is 13±5.5 dB, and the differences are statistically significant within species (P<0.05, Student’s t-test), with the exception of P. pipistrellus. The magnitude of these differences is generally small compared with across-species differences, however. The intraspecific differences in echolocation call intensity recorded in the hand are not consistent with those shown by the same individuals in free flight.
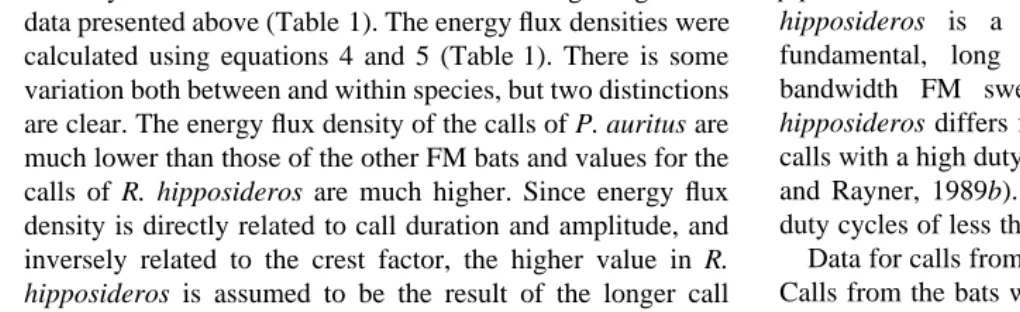
Energy flux density
[image:7.858.320.564.91.267.2]Crest factors for the three calls from each bat are plotted in Fig. 5. Since the experimental design is unbalanced (only one R. hipposideros was recorded in flight), the data cannot be analysed to test for inter- and intraspecific differences. The data suggest that the constant-frequency (CF) calls of R. hipposideros appear have a lower crest factor than the frequency-modulated (FM) calls of the other bats. A higher crest factor indicates a shorter percentage of time at peak amplitude, which is consistent with the shapes of the waveforms (Fig. 6). The mean crest factor for the subsample of calls from each bat was subtracted from the peak call intensity in dB at 1 m obtained from the free-flight regression data presented above (Table 1). The energy flux densities were calculated using equations 4 and 5 (Table 1). There is some variation both between and within species, but two distinctions are clear. The energy flux density of the calls of P. auritus are much lower than those of the other FM bats and values for the calls of R. hipposideros are much higher. Since energy flux density is directly related to call duration and amplitude, and inversely related to the crest factor, the higher value in R. hipposideros is assumed to be the result of the longer call duration and lower crest factor. The lower values in P. auritus are the result of low amplitude, short duration and high crest factor.
General call characteristics
The call characteristics of the free-flying bats are presented in Table 2, and sonograms and power spectra of representative calls are illustrated in Fig. 7. The calls of P. pipistrellus, M. brandtii, M. nattereri and P. auritus are typical FM calls starting at a high frequency and sweeping down to a low frequency. Second harmonics are well developed in P. pipistrellus, M. brandtii and P. auritus. The call of R. hipposideros is a typical CF call, with a suppressed fundamental, long CF portion and short-duration low-bandwidth FM sweeps at either end. The call of R. hipposideros differs from those of the other species in that it calls with a high duty cycle of 52.3 % (64 % in the wild; Jones and Rayner, 1989b). The other bats studied echolocate with duty cycles of less than 7 % (Table 2).
Data for calls from stationary bats are presented in Table 3. Calls from the bats when stationary differ in both timing and frequency from those emitted during flight, and there appears to be more variation within species. In general, calls emitted whilst bats are stationary were shorter in duration than those
2 ms 2 ms 2 ms 2 ms 10 ms
P.p M.b M.n P.a R.h
Fig. 6. Waveforms of representative calls for the five species of bats in flight (P.p, Pipitrellus pipistrellus, M.b, Myotis brandtii; M.n, M. nattereri; P.a, Plecopus auritus; R.h, Rhinolophus hipposideros).
12
10
8
6
4
2
0
Crest factor (dB)
P. pipistrellus M. brandtii M. nattereri P. auritus R. hipposideros 1 2 Individual
[image:7.858.57.567.589.745.2]482
emitted during flight. There were no consistent cross-species effects in alteration of frequency structure between free-flying and stationary bats with the exception that the call of M. nattereri lost all traces of the second harmonic whilst stationary.
Time variables
The durations of the free-flight laboratory-recorded calls we obtained from M. brandtii, M. nattereri and P. auritus do not appear to differ from search phase calls obtained in the field (Ahlén, 1981). The calls of P. pipistrellus, however, appear to
D. A. W
ATERS ANDG. J
ONES150
100
50
0 5 ms
150
100
50
0 5 ms
150
100
50
0
5 ms
150
100
50
0
5 ms
150
100
50
0
10 ms 0
−10
−20
−30 P.p
Relative intensity (dB)
Frequency (kHz)
0 40 80 120 160
Frequency (kHz) 0
−10
−20
−30 M.b
0
−10
−20
−30 M.n
0
−10
−20
−30 P.a
0
−10
−20
[image:8.858.238.562.102.687.2]−30 R.h
Fig. 7. Power spectra and sonagrams of representative calls for the five species of bats in free flight (P.p, Pipitrellus pipistrellus, M.b,
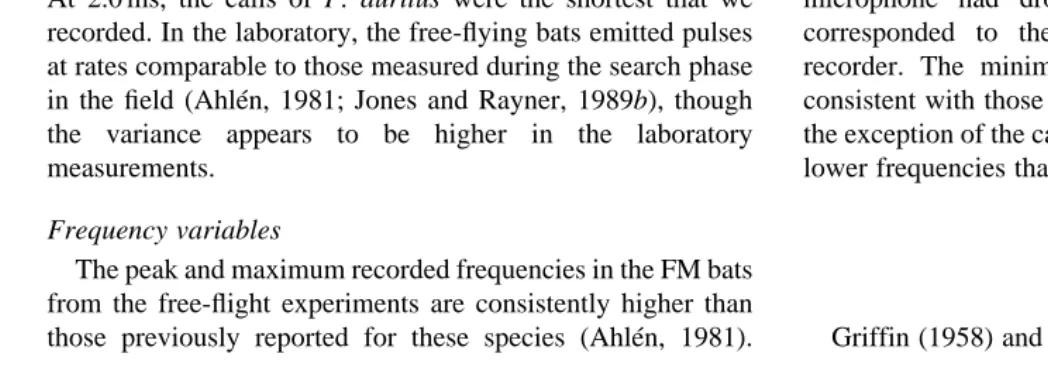
be shorter in duration than even the FM calls of this species at 4–6 ms when recorded in the wild. The mean durations of calls in R. hipposideros (approximately 19 ms) are also shorter than those recorded in the wild (50 ms; Jones and Rayner, 1989b). At 2.0 ms, the calls of P. auritus were the shortest that we recorded. In the laboratory, the free-flying bats emitted pulses at rates comparable to those measured during the search phase in the field (Ahlén, 1981; Jones and Rayner, 1989b), though the variance appears to be higher in the laboratory measurements.
Frequency variables
The peak and maximum recorded frequencies in the FM bats from the free-flight experiments are consistently higher than those previously reported for these species (Ahlén, 1981).
Significant frequency components of the fundamental component in M. nattereri and the second harmonic in P. pipistrellus, M. brandtii and P. auritus were still being recorded up to 150 kHz, where the sensitivity of the microphone had dropped by 5 dB. This frequency also corresponded to the linear limit of the instrumentation recorder. The minimum recorded frequencies were highly consistent with those reported previously (Ahlén, 1981), with the exception of the call of M. nattereri which appears to reach lower frequencies than reported in the literature.
Discussion Call intensity
[image:9.858.48.567.120.287.2]Griffin (1958) and Novick (1958) were the first to describe Table 2. Call characteristics of bats in free flight
Maximum Minimum Maximum Minimum Duty
Number Duration Peak F Peak F0 F0 F0 Peak F1 F1 F1 cycle
Bat of calls (ms) (kHz) (kHz) (kHz) (kHz) (kHz) (kHz) (kHz) (%)
P. pipistrellus 1 55 2.7±0.44 77±21 52±2 115±17 43±1 96±2 149±7 88±2 4.0
P. pipistrellus 2 123 2.9±0.46 66±20 56±5 118±4 43±2 103±4 153±7 88±3 4.3
M. brandtii 1 15 3.8±0.51 58±3 68±18 166±3 31±2 96±8 153±8 64±3 6.6
M. brandtii 2 92 2.9±0.36 58±9 58±9 120±4 29±2 95±3 157±8 66±2 4.5
M. nattereri 1 36 3.6±0.55 84±17 75±13 150±5 21±2 106±10 156±8 58±8 4.1
M. nattereri 2 31 3.7±0.63 55±10 63±16 155±3 20±2 104±13 151±13 43±10 6.7
P. auritus 1 79 2.0±0.36 54±10 50±38 57±3 29±3 63±2 91±7 51±2 4.0
P. auritus 2 92 2.0±0.30 59±7 43±1 61±4 25±3 64±2 92±6 49±2 2.9
R. hipposideros 2 32 19±4 109±0.4 NA NA NA 109±0.4 117±3 80±2 52.3
F, frequency; F0, fundamental frequency; F1, second harmonic.
NA, data not available.
Data are means ± standard deviations.
Table 3. Call characteristics of stationary bats
Maximum Minimum Maximum Minimum
Number Duration Peak F Peak F0 F0 F0 Peak F1 F1 F1
Bat of calls (ms) (kHz) (kHz) (kHz) (kHz) (kHz) (kHz) (kHz)
P. pipistrellus 1 10 1.7±0.19 91±10 78±8 115±6 48±4 118±7 158±4 100±7
P. pipistrellus 2 10 2.7±0.34 61±20 52±6 95±9 28±3 88±13 147±12 61±6
M. brandtii 1 10 3.3±0.43 81±17 57±11 120±3 30±1 101±5 155±8 66±3
M. brandtii 2 10 2.3±0.27 87±4 56±9 106±6 29±1 92±6 147±4 64±2
M. nattereri 1 10 1.5±0.16 120±2 120±2 157±2 24±3 NA NA NA
M. nattereri 2 10 2.1±0.24 82±29 82±29 147±8 19±2 NA NA NA
P. auritus 1 10 1.5±0.16 61±9 42±1 50±1 28±3 64±1.2 94±4 51±2
P. auritus 2 10 1.6±0.23 42±7 40±1 56±2 23±1 63±2.6 95±6 50±1
R. hipposideros 1 10 43±6 116±0.2 NA NA NA 116±0.2 131±6 88±1
R. hipposideros 2 10 20±5 110±0.3 NA NA NA 110±0.4 122±4 83±3
F, frequency; F0, fundamental frequency; F1, second harmonic.
NA, data not available.
[image:9.858.45.569.561.746.2]484
the intensity of the echolocation calls of bats. Griffin (1958) coined the phrase ‘whispering bats’ to describe the low-amplitude calls of carnivorous or frugivorous bats. Surlykke (1988) divided bats into three call intensity classes depending on the dB SPL measured at 10 cm; ‘low intensity’ <75 dB SPL, ‘intermediate intensity’ 75–90 dB SPL, and ‘high intensity’ >90 dB SPL. Qualitative descriptions of call intensity are widely published, and Novick (1977) presents a list of such accounts. In general, bats using high call intensities can be found in the genera Rhinolophus, Hipposideros, Taphozous, Saccopteryx, Rhynchonycteris, Pteronotus, Noctilio and Natalus and in most vespertilionids and molossids. Bats using low-intensity calls include species in the families Phyllostomidae, Nycteridae and Megadermatidae. Among the vespertillionids, some Myotis and most Plecotus produce calls in the intermediate intensity range.
The accuracy of early measurements by Griffin (1958) and Novick (1958) was limited by the technology available at the time, and most of their absolute values have been discounted (Pye, 1980). Novick (1977) has withdrawn his earlier maximum measurements of over 125 dB peSPL at 10 cm (Novick, 1958). More recent measurements have used a variety of techniques, including solid dielectric as well as air dielectric microphones, but the values suffer from improperly defined units (Møhl, 1988), making direct comparison difficult when methods are not fully detailed. Most studies also only estimate
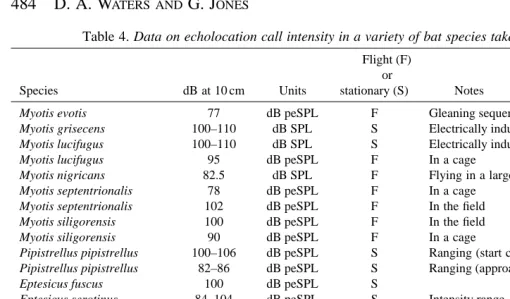
[image:10.858.48.558.120.419.2]distances of the bat from the microphone as opposed to using multiflash stereophotogrammetry (this study) or acoustic tomography (Surlykke et al. 1993; Miller and Treat, 1993) to establish distance accurately. A synopsis of recent call intensity measurements from the literature is presented in Table 4.
From our data, the five species investigated could be classified as high-intensity bats (sensu. Surlykke, 1988), with the possible exception of P. auritus. Many qualitative studies have classified the genus Plecotus as producing low-intensity echolocation calls, e.g. Ahlén (1981) and Anderson and Racey (1991) for Plecotus auritus and Griffin (1958) for Plecotus auritus and P. rafinesquii. For these two species, Griffin (1958) claimed call intensities of 79–85 dB peSPL at 10 cm. However, Simmons and O’Farrell (1977) claim ‘moderate’ call intensities in Idionycteris (=Plecotus) phyllotis of 2–5 N m22 at distances of less than 1 m in the laboratory for an FM call type, and 10 N m22at distances of over 7 m in open spaces for a CF call type. It may be that the latter signal was a social call used in communication, rather than an echolocation signal. Since the units are undefined (peak, peak-to-peak or rms), this could correspond to a number of dB peSPL values. Taking a conservative estimate, this corresponds to minimum values of 91–99 dB peSPL at less than 1 m for the FM call and 105 dB peSPL flying in the open at more than 7 m for the CF call. Even allowing for error arising from the use of solid dielectric
D. A. W
ATERS ANDG. J
ONESTable 4. Data on echolocation call intensity in a variety of bat species taken from the recent literature Flight (F)
or
Species dB at 10 cm Units stationary (S) Notes Source
Myotis evotis 77 dB peSPL F Gleaning sequence Faure et al. (1990)
Myotis grisecens 100–110 dB SPL S Electrically induced Shimozawa et al. (1974)
Myotis lucifugus 100–110 dB SPL S Electrically induced Shimozawa et al. (1974)
Myotis lucifugus 95 dB peSPL F In a cage Faure et al. (1993)
Myotis nigricans 82.5 dB SPL F Flying in a large cage Fullard (1987b)
Myotis septentrionalis 78 dB peSPL F In a cage Faure et al. (1993)
Myotis septentrionalis 102 dB peSPL F In the field Miller and Treat (1993)
Myotis siligorensis 100 dB peSPL F In the field Surlykke et al. (1993)
Myotis siligorensis 90 dB peSPL F In a cage Surlykke et al. (1993)
Pipistrellus pipistrellus 100–106 dB peSPL S Ranging (start calls) Surlykke and Miller (1985)
Pipistrellus pipistrellus 82–86 dB peSPL S Ranging (approach) Surlykke and Miller (1985)
Eptesicus fuscus 100 dB peSPL S Kick (1982)
Eptesicus serotinus 84–104 dB peSPL S Intensity range Troest and Møhl (1986)
Eptesicus serotinus 104 dB peSPL S Miller (1991)
Rhinolophus ferrumequinum 100–123 dB F Schnitzler (1968)
Rhinolophus ferrumequinum 97–109 dB S Schnitzler and Grinnell (1977)
Rhinolophus ferrumequinum 121 dB F Konstantinov et al. (1973)
Craseonycteris thonglongai 110–115 dB peSPL F In the wild Surlykke et al. (1993)
Craseonycteris thonglongai 90–95 dB peSPL F In a cage Surlykke et al. (1993)
Pteronotus parnelli 106 dB SPL F In a large cage Fullard (1987b)
Tonatia silvicola 96 dB SPL F In a large cage Fullard (1987b)
Megaderma lyra 80–85 dB SPL F Taking off Möhres and Neuweiler (1966)
Desmodus rotundus 110 dB SPL F In a flight tunnel von Joermann and Schmidt (1981)
microphones, these values cannot be classified as low intensity, and the latter measurement (105 dB) must be considered an error.
The energy flux data presented for the high-intensity FM bats are consistent with the only other measurements of this variable of 2.431027J m22for Eptesicus serotinus calculated by Au (1993) from data presented in Troest and Møhl (1986) and between 131025and 131028J m22also for E. serotinus using automatic gain control echolocating at a target (Hartley, 1992). The measurements correspond to the amount of energy passing through a 1 m2surface of a sphere of 1 m radius from the sound source. The calculations assume that the sound field is isotropic, i.e. that the bat is acting as a point source. Since this is not the case when the wavelength of the emitted sound is similar to or less than the diameter of the source, this measure cannot be used directly as a measure of the total radiated energy of the sound field. A directivity index can be used to compensate for an anisotropic sound field (Au, 1993), but in practice this proves mathematically too complicated for complex emission shapes such as a bat’s mouth or nostrils and/or frequency-modulated call structures. However, since the 26 dB intensity angle for most species appears to be between 30 ˚ and 60 ˚, and the angle subtending a 1 m2surface area of a sphere of radius 1 m is 65 ˚, the calculation for 1 m2 probably provides a reasonably accurate estimate of the acoustic energy contained within one call. Only limited work has been conducted on the energetics of echolocation in the Chiroptera. Speakman et al. (1989) state that the cost of producing a single echolocation call in a 6 g P. pipistrellus is 0.067 J. Since the mean calculated energy flux density is 2.731027J m22 for this species, it suggests a conversion efficiency of less than 0.0005 %. Even allowing for a greater directional spread, and hence a greater acoustic energy contained within a call, the conversion efficiency is still orders of magnitude below efficiencies stated for invertebrates, anurans and birds (Prestwich et al. 1989; Forrest, 1991; Bailey et al. 1993). Comparison with data for invertebrates and other vertebrates shows that the acoustic power output is comparable with the data calculated for echolocating bats. The interspecific range of average power outputs is 0.0013 mW for P. auritus to 0.331 mW for R. hipposideros, assuming one call per second. This is within the ranges stated for Orthoptera (Forrest, 1991; Bailey et al. 1993), hylid frogs (Prestwich et al. 1989) and passerine birds (Brackenbury, 1979). The reduced conversion efficiency appears to be due to the energetic costs of call production being higher in echolocating bats.
The failure of the results from two individuals to show a significant correlation between call intensity and distance from the microphone could reflect echo-levelling (Kobler et al. 1985; Neuweiler, 1990; Hartley, 1992) or calls being off-axis. The latter possibility is most likely, given the difficulty of ensuring that the bat flew a straight course without constraining it within a cage. The high-frequency calls of R. hipposideros at 113 kHz are likely to be much more directional and would give a greatly reduced sound pressure level if off-axis. Individuals of P. auritus were especially manoeuvrable by
virtue of their low wing loading and, because of this, they seldom flew directly towards the microphone. This may be the reason why the results for individual 1 failed to show a significant relationship, but cannot explain why the results for individual 2 did or why the data from these two individuals are so different.
The slope of call intensity against distance shown by the data is higher than the predicted 26.02 dB with doubled distance from the microphone, as predicted from the effects of excess atmospheric attenuation (Griffin, 1971; Lawrence and Simmons, 1982). Over the 2 m width of the stereo window, the sound intensity of a 100 kHz pulse would be reduced by 26 dB as a result of spherical spreading alone and by a further 6.3 dB as a result of excess atmospheric attenuation (Bazley, 1976). Since excess atmospheric attenuation is frequency-dependent, the overall reduction in the intensity of an FM call is difficult to predict with any accuracy. Excess attenuation would also be expected to alter the peak frequency and the highest frequency recorded, producing an altered sound spectrum with distance to the microphone. A reduction in apparent call duration in FM bats would also be expected, since the upper frequency in the FM sweep would be attenuated the most, reducing the call duration measured. Since we could establish no such clear relationships, it seem likely that an additional factor has caused the slopes to deviate from the predicted 26 dB per doubled distance. If the bats were using automatic gain control to echolocate at the microphone, the pressure level of incident sound would be held constant and the slope would be predicted to be zero (Hartley, 1992). Since the slope of the line is significantly different from zero in seven out of nine individuals, this is clearly not the case. It seems likely that the increased slopes are due to errors in assessing whether the bat was facing the microphone and the possible effects of an initially lower-intensity echolocation call caused by the bat taking off and then flying into the stereo-view window of the cameras.
Frequency data
486
1989), although some FM bats do show high pinna gain at frequencies above 100 kHz (Obrist et al. 1993). It remains to be seen whether these high-frequency components are important for target discrimination or are simply a physiological consequence of the mechanism of sound production.
Implications for foraging
P. auritus is a gleaning bat, taking prey from surfaces, and this is reflected by its wing morphology and flight characteristics (Norberg, 1976), its diet (Swift and Racey, 1983; Rydell, 1989) and its foraging behaviour (Anderson and Racey, 1991). Gleaning species typically use calls of short duration, high frequency and low intensity (Norberg and Rayner, 1987; Neuweiler, 1990) in accordance with the intensity, duration and frequency data for Plecotus auritus presented here. M. nattereri is also considered to be a gleaning species from its wing morphology (Norberg and Rayner, 1987) and from dietary analysis (Poulton, 1929; Shiel et al. 1990). However, this species does not exhibit the short call durations or low call intensities predicted for a gleaner. Faure et al. (1993) report that the gleaning species Myotis septentrionalis uses calls of 1 ms duration and 97 kHz peak frequency at an intensity of 78 dB peSPL at 10 cm during gleaning attacks. Faure et al. (1990) also report that another gleaning species, Myotis evotis, using calls of 0.7 ms and 77 dB peSPL at 10 cm during gleaning attacks. Many species are known to exhibit a degree of call plasticity; the call duration of M. evotis was significantly longer during search-phase calls than during gleaning sequences. It is well known that, during the transition from the search phase to the approach and terminal phase, the call duration is reduced, the repetition rate is increased and the amplitude is reduced (Griffin et al. 1960; Schnitzler et al. 1988; Kalko and Schnitzler, 1989). Data are available for the first two variables, but the reduction in amplitude remains unquantified. von Joermann and Schmidt (1981) reported that Desmodus rotundus reduced its call intensity by 25 dB during the transition from free-flight search-phase calls to the terminal buzz associated with reaching a landing site. Kobler et al. (1985) and Neuweiler (1990) propose that the intensity of the echo from a target is levelled to provide an amplitude optimally suited for auditory analysis. This is achieved by the bat reducing the amplitude of its call as the target is approached. Such an effect would be predicted to be especially marked in gleaning bats, since the echo intensity from the surfaces of vegetation would be especially intense. It is not inconceivable that gleaning bats may use relatively high-intensity calls during orientation or aerial hawking and adopt much lower-intensity calls during gleaning. This is supported by Miller and Treat (1993), who found that Myotis septentrionalis reduced its call intensity on approaching a prey item during a gleaning attack.
Dietary studies show that P. auritus feeds primarily on moths (Thompson, 1982; Swift and Racey, 1983; Rydell, 1989; Barataud, 1990). Members of the moth families Noctuidae, Notodontidae, Geometridae and Pyralidae are sensitive to
ultrasound and exhibit escape manoeuvres in response to echolocating bats (Roeder, 1967). Fullard (1987a) calculates that a reduction in echolocation call intensity from 100 dB SPL to 70 dB SPL at 10 cm from the bat’s mouth would result in a 90 % reduction in detection distance of the bat by the moth. Call duration has also been shown to reduce the potential acoustic apparency of the echolocation call (Faure et al. 1993; Waters, 1994). Since P. auritus uses calls which are quieter than those of other bats and shorter in duration, this may allow it to approach tympanate moths more closely before being detected. It has also been suggested that P. auritus occasionally catches insects by aerial hawking without using echolocation (Anderson and Racey, 1991).
Although strenuous efforts were made to mimic the relatively anechoic conditions encountered in the wild, the bats may have responded to flying in an enclosed space by reducing their call intensity. Studies such as those by Surlykke et al. (1993) have shown that flying in a confined space can reduce the bat’s emitted call intensity and thus one must concede that calls emitted in the wild may be more intense than those recorded in the experiments presented here. Data showing that stationary bats echolocate more at lower intensities than do flying ones support the suggestion that flight and echolocation are energetically coupled, and this has been suggested as a reason why echolocation systems have not arisen in many terrestrial animals (Speakman and Racey, 1991). This does not explain why some bats hunt from perches, since this would not reflect a significant energy saving as they continue to echolocate, although duty cycle and intensity are lower in perch-hunting bats (Schnitzler et al. 1985; Neuweiler et al. 1987; Jones and Rayner, 1989b). The CF bat Rhinolophus ferrumequinum has been shown to hunt from perches (Jones and Rayner, 1989b) and has a diet which contains a very high proportion of tympanate moths (Jones, 1990). It may be that perch-hunting, with a consequential loss of call intensity, reduces the range at which passing tympanate moths can detect the bat. The bat could then employ this reduced call intensity to gain a predation advantage. A bat using reduced call intensities in flight would need to fly more slowly and to be more manoeuvrable because the reduced ranging ability would increase the risk of collision.
In conclusion, the orientation call intensities reported here are consistent with those reported previously from the literature, and new data are presented on call intensity in free flight. The call intensities reported from the stationary bats are lower than those from the same bats in free flight; this may be due to the coupling of echolocation and the action of the flight muscles in reducing the cost of echolocation in flight. The gleaning species P. auritus uses orientation calls that are significantly less intense than those of the other species, which may allow it to approach tympanate moths more closely. A second gleaning species, M. nattereri, does not use the short-duration low-intensity calls predicted. This species may be able to alter its call structure and intensity dynamically depending on the foraging situation and it is predicted to use shorter, less-intense calls during gleaning.
D.A.W. was supported by a Science and Engineering Research Council studentship. G.J. was supported by a Royal Society University Research Fellowship. We thank Dr Jeremy Rayner for the use of his software and for discussions on acoustics and English Nature for providing the licences to undertake this work. Comments from Brock Fenton and an anonymous referee improved the manuscript.
References
ADAMS, W. B. (1971). Intensity characteristics of the noctuid acoustic receptor. J. gen. Physiol. 58, 562–579.
AHLÉN, I. (1981). Identification of Scandinavian Bats by their Sounds. Report no. 6, The Swedish University of Agricultural Sciences, Department of Wildlife Ecology. Uppsala, Sweden.
ANDERSON, M. E. AND RACEY, P. A. (1991). Feeding behaviour of
captive brown long eared bats, Plecotus auritus. Anim. Behav. 42, 489–493.
AU, W. W. L. (1993). The Sonar of Dolphins. New York: Springer Verlag.
AU, W. W. L., CARDER, D. A., PENNER, R. H. ANDSCONCE, B. L. (1985). Demonstration of adaptation in Beluga whale echolocation signals. J. acoust. Soc. Am. 77, 726–730.
AU, W. W. L. ANDSNYDER, K. J. (1980). Long-range target detection
in open waters by an echolocating Atlantic Bottlenose dolphin (Tursiops truncatus). J. acoust. Soc. Am. 68, 1077–1084.
BAILEY, W. J., WITHERS, P. C., ENDERSBY, M. ANDGAULL, K. (1993).
The energetic costs of calling in the bushcricket Requena verticalis (Orthoptera: Tettigonidae: Listroscellidnae) J. exp. Biol. 178, 21–37.
BARATAUD, M. (1990). Eléments sur le comportement alimentaire des
Oreillards brun et gris Plecotus auritus (Linnaeus, 1758) et
Plecotus austriacus (Fischer, 1829). Le Rhinolophe 7, 3–10.
BAZLEY, E. N. (1976). Sound Absorption in Air at Frequencies up to
100 kHz. National Physics Laboratory Acoustics Report no. AC 74.
BRACKENBURY, J. H. (1979). Power capabilities of the avian
sound-producing system. J. exp. Biol. 78, 163–166.
BROWN, P. E., GRINNELL, A. D. ANDHARRISON, J. B. (1978). The
development of hearing in the Pallid bat, Antrozous pallidus. J.
comp. Physiol. A 126, 169–182.
COLES, R. B., GUPPY, A., ANDERSON, M. E. ANDSCHLEGEL, P. (1989). Frequency sensitivity and directional hearing in the gleaning bat,
Plecotus auritus (Linnaeus 1758). J. comp. Physiol. A 165,
269–280.
DUSENBURY, D. B. (1992). Sensory Ecology. New York: W. H.
Freeman.
FAURE, P. A., FULLARD, J. H. ANDBARCLAY, R. M. R. (1990). The response of tympanate moths to the echolocation calls of a substrate gleaning bat Myotis evotis. J. comp. Physiol. A 166, 843–849. FAURE, P. A., FULLARD, J. H. AND DAWSON, J. W. (1993). The
gleaning attacks of the northern long-eared bat Myotis
sepentrionalis are relatively inaudible to moths. J. exp. Biol. 178,
173–189.
FENTON, M. B. (1980). Adaptiveness and ecology of echolocation in
terrestrial (aerial) systems. In Animal Sonar Systems (ed. R. G. Busnel and J. F. Fish), pp. 427–446. New York: Plenum.
FENTON, M. B. (1988). Detecting, recording and analyzing
vocalizations of bats. In Ecological and Behavioral Methods for the
Study of Bats (ed. T. H. Kunz), pp. 91–104. Washington DC:
Smithsonian Institution Press.
FORREST, T. G. (1991). Power output and efficiency of sound
production by crickets. Behav. Ecol. 2, 327–338.
FULLARD, J. H. (1987a). Sensory ecology and neuroethology of moths
and bats: interactions in a global perspective. In Recent Advances
in the Study of Bats (ed. M. B. Fenton, P. A. Racey and J. M. V.
Rayner), pp. 244–272. Cambridge: Cambridge University Press.
FULLARD, J. H. (1987b). The defensive function of auditory enhancers
in the neotropical moth Antaea lichyi (Lepidoptera: Notodontidae).
Can. J. Zool. 65, 2042–2046.
GRIFFIN, D. R. (1958). Listening in the Dark. Comstock: Yale
University Press.
GRIFFIN, D. R. (1971). The importance of atmospheric attenuation for
the echolocation of bats. Anim. Behav. 19, 55–61.
GRIFFIN, D. R., MCCUE, J. J. AND GRINNELL, A. D. (1963). The
resistance of bats to jamming. J. exp. Zool. 152, 229–250.
GRIFFIN, D. R., WEBSTER, F. A. AND MICHAEL, C. R. (1960). The
echolocation of flying insects by bats. Anim. Behav. 3, 3–4. GUPPY, A. ANDCOLES, R. G. (1988). Acoustical and neural aspects of
hearing in the Australian gleaning bats, Macroderma gigas and
Nyctophilius gouldi. J. comp. Physiol. A 162, 653–668.
HARTLEY, D. J. (1992). Stabilisation of percieved echo amplitudes in
echolocating bats. II. The acoustic behaviour of the big brown bat,
Eptesicus fuscus, when tracking moving targets. J. acoust. Soc. Am.
91, 1133–1149.
HARTLEY, D. J., CAMPBELL, K. A. ANDSUTHERS, R. A. (1989). The
acoustic behaviour of the fish catching bat, Noctilio leporinus, during prey capture. J. acoust. Soc. Am. 86, 8–27.
HARTLEY, D. J. AND SUTHERS, R. A. (1987). The sound emission
pattern and the acoustical role of the noseleaf in the echolocating bat Carollia perspicillata. J. acoust. Soc. Am. 82, 1892–1900.
HARTLEY, D. J. AND SUTHERS, R. A. (1989). The sound emission
pattern of the echolocating bat Eptesicus fuscus. J. acoust. Soc. Am.
85, 1348–1351.
JONES, G. (1990). Prey selection by the Greater Horseshoe bat: optimal foraging by echolocation? J. Anim. Ecol. 59, 587–602. JONES, G. (1993). Some techniques for the detection, recording and
analysis of echolocation calls from wild bats. In Proceedings of the
First European Bat Detector Workshop (ed. K. Kapteyn), pp.
25–35. Amsterdam: Netherlands Bat Research Foundation. JONES, G. ANDRAYNER, J. M. V. (1988). Flight performance, foraging
tactics and echolocation in free-living Daubenton’s bats Myotis
daubentoni (Chiroptera: Vespertillionidae). J. Zool., Lond. 215,
113–132.
JONES, G. AND RAYNER, J. M. V. (1989a). Optimal flight speed in pipistrelle bats, Pipistrellus pipistrellus. In European Bat Research
1987 (ed. V. Hanák, I. Horácˇek and J. Gaisler), pp. 247–253. Praha:
Charles University Press.
JONES, G. ANDRAYNER, J. M. V. (1989b). Foraging behaviour and echolocation of wild horseshoe bats Rhinolophus ferrumequinum and R. hipposideros (Chiroptera, Rhinolophidae). Behav. Ecol.
Sociobiol. 25, 183–191.
JONES, G. ANDRAYNER, J. M. V. (1991). Flight performance, foraging tactics and echolocation in the trawling insectivorous bat Myotis
adversus (Chiroptera: Vespertillionidae). J. Zool., Lond. 225,
393–412.
KALKO, E. K. V. ANDSCHNITZLER, H.-U. (1989). The echolocation and hunting behaviour of Daubenton’s bat Myotis daubentoni.
Behav. Ecol. Sociobiol. 24, 225–238.
KICK, S. A. (1982). Target detection by the echolocating bat,
Eptesicus fuscus. J. comp. Physiol. 145, 431–435.
488
(1985). Echo intensity compensation by the echolocating bat
Pteronotus parnelli. Hearing Res. 20, 99–108.
KONSTANTINOV, A. I., MOVTCHAN, V. N. ANDMAKAROV, A. K. (1973).
Influence of band limited noise on the efficiency of echolocation detection of targets by Rhinolophus ferrumequinum. Period. Biol.
75, 7–11.
KUHL, W., SCHODDER, G. R. ANDSCHRøDER, F. K. (1954). Condenser
transmitters and microphones with solid dielectric for airborne ultrasonics. Acustica 4, 519–532.
LAWRENCE, B. D. AND SIMMONS, J. A. (1982). Measurements of
atmospheric attenuation at ultrasonic frequencies and the significance for echolocation by bats. J. acoust. Soc. Am. 71, 585–590.
MILLER, L. A. (1991). Arctiid moth clicks can degrade the accuracy
of range difference discrimination in echolocating big brown bats,
Eptesicus serotinus. J. comp. Physiol. A 168, 571–579.
MILLER, L. A. AND TREAT, A. E. (1993). Field recordings of
echolocation and social signals from the gleaning bat Myotis
septentrionalis. Bioacoustics 5, 67–87.
MøHL, B. (1988). Target detection by echolocating bats. In Animal
Sonar, Processes and Performance, NATO ASI Series A, Life Sciences, vol. 156 (ed. P. E. Nachtigall and P. W. B Moore), pp.
435–450. New York: Plenum.
MÖHRES, F. P. AND NEUWEILER, G. (1966). Die
Ultraschallorientierung der Grossblatt-fledermäuse (Chiroptera-Megadermatidae). Z. vergl. Physiol. 53, 195–227.
NEUWEILER, G. (1983). Echolocation and adaptivity to ecological
constraints. In Neuroethology and Behavioural Physiology (ed. F. Huber and H. Markle), pp. 280–302. Berlin: Springer.
NEUWEILER, G. (1990). Auditory adaptations for prey capture in
echolocating bats. Physiol. Rev. 70, 615–641.
NEUWEILER, G., METZNER, W., HEILMANN, U., RÜBSAMEN, R.,
ECKRICH, M. ANDCOSTA, H. H. (1987). Foraging behaviour and
echolocation in the rufous horseshoe bat (Rhinolophus rouxi) of Sri Lanka. Behav. Ecol. Sociobiol. 20, 53–67.
NEUWEILER, G., SINGH, S. AND SRIPATHI, K. (1984). Audiograms
of a South Indian bat community. J. comp. Physiol. A 154, 133–142.
NORBERG, U. (1976). Aerodynamics, kinematics and energetics of
horizontal flight in the long-eared bat Plecotus auritus. J. exp. Biol.
65, 179–212.
NORBERG, U. M. AND RAYNER, J. M. V. (1987). Ecological
morphology and flight in bats (Mammalia; Chiroptera): wing adaptations, flight performance, foraging strategy and echolocation.
Phil. Trans. R. Soc. Lond. B 316, 335–427.
NOVICK, A. (1958). Orientation in paleotropical bats. I.
Microchiroptera. J. exp. Zool. 138, 81–154.
NOVICK, A. (1977). Acoustic orientation. In Biology of Bats, vol. 3
(ed. W. A. Wimsatt), pp. 73–287. New York: Academic Press.
OBRIST, M. K., FENTON, M. B., EGER, J. L. AND SCHLEGEL, P. A.
(1993). What ears do for bats: a comparative study of pinna sound pressure transformation in Chiroptera. J. exp. Biol. 180, 119–152.
POULTON, E. B. (1929). British insectivorous bats and their prey. Proc.
zool. Soc., Lond. 1, 277–303.
PRESTWICH, K. N., BRUGGER, K. E. ANDTOPPING, M. (1989). Energy
and communication in three species of hylid frogs: power input, power output and efficiency. J. exp. Biol. 144, 53–80.
PYE, J. D. (1980). Echolocation signals and echos in air. In Animal
Sonar Systems (ed. R. G. Busnel and J. F. Fish), pp. 309–354. New
York: Plenum.
PYE, J. D. (1992). Equipment and techniques for the study of
ultrasound in air. Bioacoustics 4, 77–88.
PYE, J. D. (1993). Is fidelity futile? The ‘true’ signal is illusory,
especially with ultrasound. Bioacoustics 4, 271–286.
RAYNER, J. M. V. (1985). Linear relations in biomechanics: the
statistics of scaling functions. J. Zool., Lond. A 206, 415–439.
RAYNER, J. M. V. AND ALDRIDGE, H. D. J. N. (1985).
Three-dimensional reconstruction of animal flight paths and the turning flight of microchiropteran bats. J. exp. Biol. 118, 247–265.
RAYNER, J. M. V., JONES, G. ANDHUGHES, P. M. (1989). Load carrying
by flying bats. In European Bat Research 1987 (ed. V. Hanák, I. Horácek and J. Gaisler), pp. 235–245. Praha: Charles University Press.
ROEDER, K. D. (1967). Nerve Cells and Insect Behaviour. Cambridge
MA: Harvard University Press.
RYDELL, J. (1989). Food habits of northern (Eptesicus nilssoni) and
brown long-eared (Plecotus auritus) bats in Sweden. Holarctic
Ecol. 12, 16–20.
SCHNITZLER, H.-U. (1968). Die Ultraschall-Ortungslante der
Hufeisen-Fledermause (Chiroptera: Rhinolophidae) in verscheiden Orientierungssituationen. Z. vergl. Physiol. 57, 376–408.
SCHNITZLER, H.-U. AND GRINNELL, A. D. (1977). Directional
sensitivity of echolocation in the horseshoe bat Rhinolophus
ferrumequinum. I. Direction of sound emission. J. comp. Physiol.
116, 51–61.
SCHNITZLER, H.-U., HACKBARTH, H., HEILMANN, U. ANDHERBERT, H.
(1985). Echolocation behaviour of rufous horseshoe bats hunting for insects in the flycatcher-style. J. comp. Physiol. A 157, 39–46.
SCHNITZLER, H.-U., KALKO, E., MILLER, L. ANDSURLYKKE, A. (1988).
How the bat Pipistrellus kuhli hunts for insects. In Animal Sonar,
Processes and Performance, NATO ASI Series A, Life Sciences,
vol. 156 (ed. P. E. Nachtigall and P. W. B. Moore), pp. 619–624. New York: Plenum.
SHIEL, C. B., MCANEY, C. M. ANDFAIRLEY, J. S. (1990). Analysis of
the diet of Natterer’s bat Myotis nattereri and the common long-eared bat Plecotus auritus in the West of Ireland. J. Zool., Lond.
223, 299–305.
SHIMOZOWA, T., SUGA, N., HENDLER, P. ANDSCHUETZE, S. (1974).
Directional sensitivity of echolocation systems in bats producing frequency modulated signals. J. exp. Biol. 60, 53–69.
SIMMONS, J. A. AND O’FARRELL, M. J. (1977). Echolocation by
the long-eared bat Plecotus phyllotis. J. comp. Physiol. 122, 201–214.
SOKAL, R. R. ANDROHLF, F. J. (1981). Biometry (2nd edition). San
Fransisco: W. H. Freeman.
SPEAKMAN, J. R., ANDERSON, M. E. ANDRACEY, P. A. (1989). The
energy cost of echolocation in pipistrelle bats (Pipistrellus
pipistrellus). J. comp. Physiol. A 165, 679–685.
SPEAKMAN, J. R. ANDRACEY, P. A. (1991). No cost of echolocation
for bats in flight. Nature 350, 421–423.
SPEDDING, G. R., RAYNER, J. M. V. ANDPENNYCUICK, C. J. (1984).
Momentum and energy in the wake of a pigeon (Columba livia) in slow flight. J. exp. Biol. 111, 81–102.
STAPELLS, D. R., PICTON, T. W. ANDSMITH, A. D. (1982). Normal
hearing threshold for clicks. J. acoust. Soc. Am. 72, 74–79.
SURLYKKE, A. (1988). Interaction between echolocating bats and their
prey. In Animal Sonar, Processes and Performance, NATO ASI
Series A, Life Sciences, vol. 156 (ed. P. E. Nachtigall and P. W. B
Moore), pp. 551–566. New York: Plenum.
SURLYKKE, A., LARSEN, O. N. ANDMICHELSEN, A. (1988). Temporal
coding in the auditory receptor of the moth ear. J. comp. Physiol. A 162, 367–374.
SURLYKKE, A. AND MILLER, L. A. (1985). The influence of arctiid
moth clicks on bat echolocation; jamming or warning? J. comp.
Physiol. A 156, 831–843.
SURLYKKE, A., MILLER, L. A., MØHL, B., ANDERSEN, B. B.,
CHRISTENSEN-DALSGAARD, J. AND JØRGENSEN, B. (1993).
Echolocation in two very small bats from Thailand: Craseonycteris
thonglongyai and Myotis siligorensis. Behav. Ecol. Sociobiol. 33,
1–12.
SWIFT, S. M. ANDRACEY, P. A. (1983). Resource partitioning in two
species of vespertilionid bats occupying the same roost. J. Zool.,
Lond. 200, 249–259.
THOMPSON, M. J. A. (1982). A common long-eared bat: moth
predator–prey relationship. Naturalist 107, 87–97.
TROEST, N. ANDMØHL, B. (1986). The detection of phantom targets
in noise by Serotine bats; negative evidence for the coherent receiver. J. comp. Physiol. A 159, 559–567.
VON JOERMANN, G. AND SCHMIDT, U. (1981). Echoortung bei der
Vampirfledermaus. II. Lautaussendung im Flug und Korrelation zum Flügelshlag. Z. Säugetierkunde 46, 136–146.
WATERS, D. A. (1994). The auditory responses of noctuid moths
to the echolocation calls of bats. PhD thesis, University of Bristol.