In contrast to other four-winged insects, the fore- and hindwings of dragonflies are not coupled; they function independently. Thanks to this double flight-power system, large dragonflies (Anisoptera) are capable of carrying out incredible flight manoeuvres (Rüppell, 1989; Rüppell and Hilfert, 1993). Even gliding flight, which is seldom found in Pterygota, is part of their repertoire. This energetically and thermoregulatory important flight behaviour (e.g. May, 1995a,b) enables one to treat the wings of these animals as aerofoils.
The aerodynamic characteristics of an aerofoil can be determined using simple steady-state analyses by disregarding unsteady effects. The air surrounding a wing is accelerated to generate the aerodynamic forces lift L and drag D, and the resultant force thrust T, that enable the insect to fly. The aerodynamic performance of the wing can be quantified by the relationship between lift and drag.
Dragonfly wings are not smooth or simple cambered surfaces. The cross-sectional camber of the wing has a well-defined corrugated configuration. This design is of critical importance to the stability of this ultra-light construction (e.g. Hertel, 1963; Rees, 1975a; Wootton, 1991, 1992; Newman and Wootton, 1986; Kesel et al., 1998). However, from an
aerodynamic point of view, this cross section does not appear to be very suitable. The pronounced bends and edges should lead to high drag values. However, in visualising experiments using profile models, Rees (1975b), Newman et al. (1977), Rudolph (1978) and Buckholz (1986) have shown that this geometry induces positive flow conditions. The vortices filling the profile valleys formed by these bends ‘smooth down’ the profile geometry (Kesel, 1998).
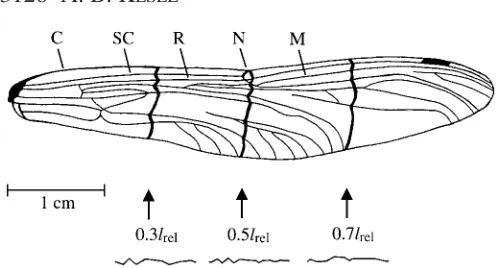
To date, little attention has been paid to variations in the corrugation along the longitudinal axis. The corrugation decreases gradually towards the wing tip, where the wing more or less flattens out. Furthermore, the orientation of the leading edge changes at the nodus. The first bend, formed by the costa, subcosta and radius (Fig. 1) and lying basal from the nodus, faces upwards. This orientation changes because the costa and subcosta fuse at the nodus, distal from which, the first valley is built by the costa, radius and mediana 1, so that the leading edge faces downwards.
Because of the changing corrugation along the longitudinal axis and the changing orientation of the leading edge, one might expect to find differing aerodynamic characteristics along the wing axis. The present study aims to clarify the aerodynamic influence of the ‘dynamic smoothing’ of the JEB2811
During gliding, dragonfly wings can be interpreted as acting as ultra-light aerofoils which, for static reasons, have a well-defined cross-sectional corrugation. This corrugation forms profile valleys in which rotating vortices develop. The cross-sectional configuration varies greatly along the longitudinal axis of the wing. This produces different local aerodynamic characteristics. Analyses of the CL/CD characteristics, where CLand CD are the lift and
drag coefficients, respectively (at Reynolds numbers Re of 7880 and 10 000), using a force balance system, have shown that all cross-sectional geometries have very low drag coefficients (CD,min<0.06) closely resembling those of flat
plates. However, the wing profiles, depending upon their position along the span length, attain much higher lift values than flat plates. The orientation of the leading edge does not play an important role. The detectable lift forces
can be compared with those of technical wing profiles for low Re numbers. Pressure measurements (at Re=9300) show that, because of rotating vortices along the chord length, not only is the effective profile form changed, but the pressure relationship on the profile is also changed. Irrespective of the side of the profile, negative pressure is produced in the profile valleys, and net negative pressure on the upper side of the profile is reached only at angles of attack greater than 0 °. These results demonstrate the importance of careful geometrical synchronisation as an answer to the static and aerodynamic demands placed upon the ultra-light aerofoils of a dragonfly.
Key words: dragonfly, Aeshna cyanea, gliding, wing profile, lift, drag, pressure.
Summary
Introduction
AERODYNAMIC CHARACTERISTICS OF DRAGONFLY WING SECTIONS
COMPARED WITH TECHNICAL AEROFOILS
ANTONIA B. KESEL*
Department of Zoology, Technical Biology and Bionics, University of Saarland, D-66041 Saarbrücken, Germany *e-mail: [email protected]
profile by the vortices generated in the valleys of the bends. Particular consideration is given to changes in profile geometry along the longitudinal axis of the wing.
Materials and methods The profiles
[image:2.612.43.293.58.192.2]Geometrical variables for the profiles used are given in Table 1. The following ‘technical’ profiles were used: a flat plate, a curved plate (camber 7 %) and a narrow asymmetric profile (BENEDEK B-6457-emod) with a small leading edge (radius r=0.6 mm) and 7 % camber. These profiles with elongated tails are used in building model aeroplanes for low Re (<70 000) (Bender, 1987).
Since it was not possible to make sufficiently good enlargements of dragonflies filmed during gliding flight, the cross-sectional geometry had to be determined from a dried dragonfly forewing (Aeshna cyanea Müller). It was obtained using a scanning stereo-optical method: photographs of the
dragonfly wing together with a calibrating cube of known size (1 cm3) were taken from three positions in space and digitized. Using coordinate transformation software (PICTRAN-D) and the coordinates of the calibrating body, it was possible to reconstruct the three-dimensional geometry of the photographed wing. The topography of the wing were thus determined almost non-invasively. These measurements were used to produce enlarged (×7.5) profile models.
Wing profile geometry varies with position along the span. Cross sections were taken at relative span lengths lrelof 0.3 (profile 1; where lrel=0.3=30 % of span length starting at the wing base), 0.5 (profile 2 near the nodal area, see Fig. 1) and 0.7 (profile 3) (Fig. 2). The models were made of 0.25 mm thick sheet brass. Filled profiles (profiles 1A, 2A and 3A), based on the cross-sectional geometry of wing profiles 1–3 but with the ‘valleys’ filled (Fig. 2), were made from lacquered balsa wood.
A final profile, the pressure profile (profile 4), used in the
Fig. 1. Drawing of a dragonfly forewing (Aeshna cyanea) with profile cross sections shown below at 0.3, 0.5 and 0.7lrel, where lrelis
[image:2.612.326.543.70.430.2]the relative span length. C, costa; SC, subcosta; R, radius; N, nodus; M, mediana 1.
Table 1. Geometrical variables of the profiles used in this study
c t l S t/c
Profile (mm) (mm) (mm) (m2) AR (%)
Flat plate 74.8 2.5 279 0.021 3.730 3.342
Curved plate 74.5 2.5 279 0.021 3.745
Asymmetric 111.0 7.0 259 0.029 2.333 6.306
profile
1 76.3 5.6 280 0.021 3.670 7.339
2 81.0 6.1 281 0.023 3.469 7.531
3 82.1 5.2 279 0.023 3.398 6.334
1A 82.6 8.3 275 0.023 3.329 10.048
2A 83.1 6.8 278 0.023 3.345 8.183
3A 83.4 7.0 280 0.023 3.357 8.393
4 78.3 8.9 279 0.022 3.563 11.367
For the geometry of model wing profiles, see Figs 2 and 3.
c, chord length; t, profile thickness; l, span length; S, profile area; AR, aspect ratio.
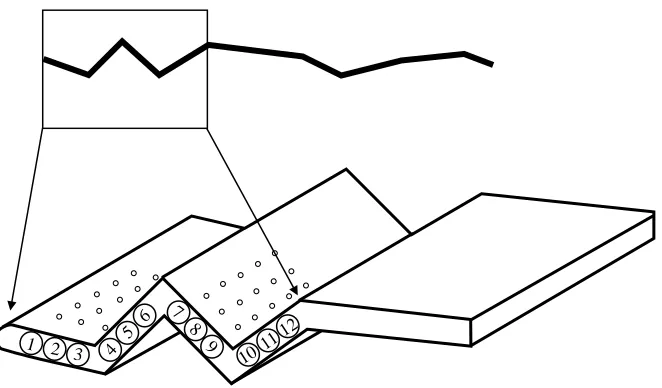
Fig. 2. Geometry of wing profiles used in this study. Profiles 1, 2 and 3 were constructed using measurements taken from the wing cross section at 0.3, 0.5 and 0.7lrel, respectively, where lrelis the relative
[image:2.612.42.292.542.697.2]pressure measurements, was based on the front part of profile 1 (Fig. 3). Twelve metal pipes (diameter 4 mm) were spanwise integrated in the wing profile as shown in Fig. 3. Each pipe had five pressure holes (diameter 1 mm) on the upper and lower surfaces of the profile. The holes on the upper and lower surfaces could be closed as required. Profile 4 was a composite construction of wood, the metal pipes and brass sheets for the upper and lower surfaces.
Wind tunnel
A wind tunnel (Eifel-type) with an open working area was used. Outflow diameter was 0.46 m, and turbulence was 0.3–0.6 %. A detailed description of the wind tunnel is given by Bilo (1979). The wind speed was adjustable between 0.5 and 15 m s−1and was determined using a hot-wire probe (TSI velocity transducer 8469). A thermometer and a barometer were used to measure temperature and atmospheric pressure, respectively. The wing profile holder was situated 0.18 m in front of the tunnel exit and was attached to the measuring system. The wing profiles, when mounted in the holder, were bounded at each end by the walls (without contact; distance from profile to wall <0.5 mm).
Force measurements
Lift L and drag D were recorded by means of a mechanically decoupled two-component balance on an air-cushion bearing. Because of the friction-free bearing, forces were transmitted without moments. These forces were separated into individual lift and drag forces by two perpendicularly oriented air-cushion sledges and transmitted in uniaxial movement. These movements induced the measuring probe to shift, and this displacement was measured via inductive displacement transducers. The transducer signals (recording time 10µs; sampling rate 0.3 Hz; N=20) were amplified, low-pass-filtered and fed, using an A/D converter board (DYSIS PCI-07), into a computer, converted into ASCII format and processed using the calculation package EXCEL. To determine the influence of profile geometry on aerodynamic characteristics, all
measurement series (N=5) were carried out at a Reynolds number (Re) of 10 000, over the velocity range 1.4–2 m s−1. In addition, profile 1 was investigated at Re=7880 and profile 4 at Re=9379. The Reynolds number Re=cU/ν,where c is chord length, U is fluid velocity and νis the kinematic viscosity of the fluid (air), was taken as 1.461×10⁻⁵m2s−1.
A uniform Re disregards the fact that, despite having a variable chord length along the longitudinal axis, the speed of flow around the wing during gliding flight is constant, irrespective of longitudinal position. Since the chord length c at position 0.3lrel is only 78.8 % of the chord length c at position 0.7lrel (at 0.5lrel, c is 97 % of that at 0.7lrel), measurements were also carried out at Re=7880 on profile 1.
Re values of 7880 and 10 000 are both below the critical Reynolds number (Recrit=3.2×10⁵). At Re values below Recrit, the boundary layer of the flowing fluid is laminar. At Re values higher than Recrit, the boundary layer is turbulent, leading to delayed airflow breakaway and thus to a change in the wake effect, producing distinctly reduced drag.
However, the Reynolds numbers chosen, 7880 and 10 000, are distinctly higher than the biologically relevant range. Maximum speeds of 10 m s−1 have been registered during flapping flight in free-flying dragonflies (Aeshna cyanea; Rüpell, 1989). With an assumed chord length c of approximately 0.01 m, this is equivalent to a Reynolds number of 7000. In the gliding flight relevant for this study, Wakeling and Ellington (1997) give a flight speed of approximately 2 m s−1 (Sympetrum sanguineum), which gives a Reynolds number of approximately 1400.
To compare the results from this study with those available in the literature (e.g. Newman et al., 1977; Okamoto et al., 1996), the measurements were made using the ‘customary’ Reynolds number of 10 000. Since the aerodynamic forces lift and drag are largely dependent upon the Reynolds number or the velocity of flow (see equations 1, 2 and also 6), the results are only of limited relevance for the biological system of the dragonfly wing. But they are useful to emphasize the effects of the profile geometry on its aerodynamic characteristics.
1 1112
10 9 8 7
[image:3.612.238.569.69.263.2]6 5 4 3 2
Using the standard formulae:
CL = L/(0.5ρU2S) , (1)
CD = D/(0.5ρU2S) , (2) where ρis fluid density, U is fluid velocity and S is profile area, the dimensionless coefficients of lift CL and drag CD were calculated from the drag and lift forces. Total drag D is composed of pressure drag plus friction drag plus induced drag. The same is true for the drag coefficients:
CD = CD,p + CD,f + CD,i, (3) where CD,pis the pressure drag coefficient, CD,fis the friction drag coefficient and CD,iis the induced drag coefficient. Since the wing profiles were limited at their upper and lower ends by a wall, they can be interpreted as having infinite length. This permits a two-dimensional aerodynamic analysis in which the induced drag can be neglected. Thus:
CD = CD,p + CD,f. (4) Since the pressure drag of a flat plate at an angle of attack α of 0 ° approaches zero in the subcritical Re range, total drag is then equivalent to frictional drag. Its coefficient can be calculated according to the Blasius equation for laminar boundary layers:
CD,f = 2.66/Re0.5 (5)
(Schlichting, 1979). For Re=10 000, the expected minimum CD value for an ideal flat plate with profile thickness t of zero at perfect laminar flow is, therefore, CD,min=CD,f=0.0266. Because of irregularities in the boundary layer and because t>0, the measured value of CD,min should be greater than this value. An approximation is given by Ellington (1984) for Re from 100 to 10 000:
CD,min = 4.8/Re0.5. (6) The aerodynamic performance of a wing during gliding can be determined by means of various CL/CDratios. The gliding ratio
εR, where
εR = (CL/CD) , (7) gives the maximum gliding distance per unit height. The corresponding gliding angle γcan be calculated from:
γ= arctanCD/CL. (8)
The gliding ratio εS gives the minimum sinking rate and is calculated from:
εS = (CL3/CD2) . (9) The gliding ratios εRand εS were determined by calculating the ratios CL/CDand CL3/CD2for each angle of attack α. The maximum value represents εRand εS, respectively.
Pressure measurements
Pressure measurements (N=3) were made with a micro-pressure gauge and profile 4. The micro-pressure values p0obtained were calculated as dimensionless coefficients of pressure CP:
CP = (p0−p∞)/0.5ρU2, (10)
where p0is the measured static pressure of profile, p∞ is the static pressure of flow and 0.5ρU2is the dynamic pressure, for
α=−10 ° to +10 ° in 5 ° steps and U=1.74 m s−1(Re=9300).
Results
None of the profiles analysed at Re=10 000 and at the higher angles of attack showed any sign of either a spontaneous collapse of lift or of flow breaking away. The only exception was the curved plate: a spontaneous collapse of lift was registered at a critical angle of attack αcritof +10 °; at this angle of attack, the lift coefficient CL,crit was approximately equal to the maximum lift coefficient CL,max. Since the increase in lift stagnated at 8–10 ° in all profiles at Re=10 000, and only began to increase again at much higher angles of attack, +8 ° or +10 ° was taken to be αcrit for all profiles at Re 10 000 (Table 2).
The ‘technical’ profiles
As expected, the flat plate with CL,crit=0.773 and εR=6.718 (εS=26.948) generates the least lift, but with CD,min=0.041 also the lowest coefficient of drag (Fig. 4). The curved plate shows favourable aerodynamic characteristics (εR=9.323;
εS=95.19). Considerable lift (28 % of CL,crit) is obtained at an angle of attack of 0 °, but also a higher value for CD,min=0.078. At the critical angle of attack (αcrit=10 ° and
CL,crit=1.284), flow suddenly breaks away and lift collapses. At higher angles of attack (α>20 °), lift begins to increase again (Fig. 4A). The aerodynamic characteristics of the asymmetric profile can be interpreted as a compromise between the flat and cambered plates: CL,crit=1.004,
CD,min=0.054, εR=8.068 and εS=40.602.
The wing profiles (profiles 1, 2 and 3)
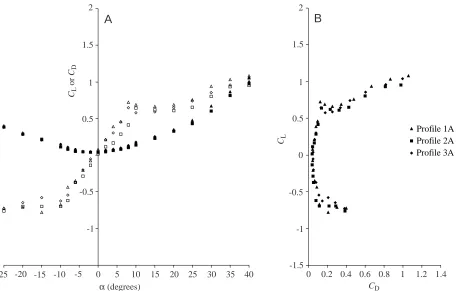
Measurements at Re=10 000 show that the different cross-sectional geometries along the longitudinal axis of the wing are correlated with different aerodynamic characteristics (Fig. 5). With CL,crit=0.953, CD,min=0.053 and a gliding ratio εR of 7.351 (εS=34.927), the aerodynamic performance of profile 1 is relatively high, but with CL,crit=0.999, CD,min=0.06,
εR=7.868 and εS=50.636, the performance of profile 3 exceeds these values. Both profiles have very similar polar plots (Fig. 5B). By comparison, the values obained for profile 2 (CL,crit=0.698; CD,min=0.049; εR=6.528; εS=22.543) are very similar to those of the flat plate (Fig. 4), and their polar plots are also very similar.
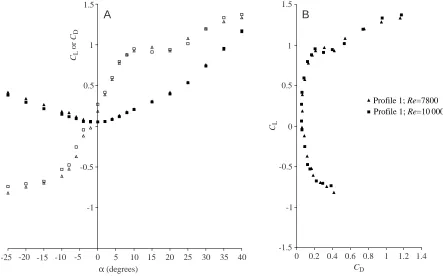
Reducing Re from 10 000 to 7880 in profile 1 (profile 1* in Table 2) led to a distinct reduction in the gliding ratios εR(to 6.306) and εS(to 27.202) and to an increase in CD,minto 0.061 (Fig. 6).
The ‘filled’ profiles (profiles 1A, 2A and 3A)
Fig. 4. (A) Drag CD and lift CL coefficients versus angle of attack αfor the ‘technical’ profiles. Open symbols, CL; filled symbols, CD;
[image:5.612.49.569.86.314.2]Reynolds number Re=10 000. (B) Polar diagrams for the ‘technical’ profiles. Values are means (N=5); all errors are smaller than the symbol size. Flat plate Sc,L<0.9 %, Sc,D<2.6 %; curved plate Sc,L<1.1 %, Sc,D<1.7 %; asymmetric profile Sc,L<0.9 %, Sc,D<2.1 %, where Sc,Lis the standard error of the CLand Sc,Dis that of the CD.
Table 2. Aerodynamic characteristics of the profiles
Flat Curved Asymmetric
Profile plate plate profile 1 1* 2 3 1A 2A 3A 4
CL,crit 0.773 1.284 1.004 0.953 0.968 0.698 0.999 0.723 0.641 0.647 0.552
CD,crit 0.165 0.176 0.160 0.208 0.311 0.124 0.175 0.125 0.138 0.135 0.170
CL,max 1.209 1.330 1.182 1.373 1.334 1.170 1.410 1.081 0.953 1.037 1.042
CL,0 0.022 0.355 0.390 0.270 0.185 0.053 0.262 0.079 0.016 0.040 −0.130
CD,0 0.041 0.078 0.054 0.053 0.061 0.049 0.060 0.044 0.040 0.047 0.130
CD,min 0.041 0.078 0.054 0.053 0.061 0.049 0.060 0.044 0.040 0.047 0.127
(α, degrees) (0) (0) (0) (0) (0) (0) (0) (0) (0) (0) (+2)
αcrit(degrees) +10 +10 +8 +10 +15 +10 +10 +8 +10 +8 +10
α0 (degrees) 0 −4 −4 −4 −2 0 −2 0/−2 0 0 +2
(CL) (0.022) (−0.087) (−0.024) (−0.045) (0.018) (0.053) (0.081) (±0.079) (0.016) (0.040) (−0.063)
εR 6.718 9.323 8.068 7.351 6.306 6.528 7.868 5.790 4.629 4.791 3.248
(α, degrees) (+6) (+6) (+2) (+4) (+4) (+6) (+6) (+8) (+10) (+8) (+10)
γ(degrees) 8.466 6.122 7.065 7.747 9.011 8.709 7.243 9.798 12.191 11.789 17.112
εS 26.948 95.190 40.602 34.927 27.202 22.543 50.636 24.256 13.731 14.861 5.824
(α, degrees) (+6) (+8) (+2) (+6) (+6) (+8) (+6) (+8) (+10) (+8) (+10)
For all profiles except 1*, Re=10 000; for profile 1*, Re=7880.
CL,crit, lift coefficient at αcrit; CD,crit, drag coefficient at αcrit; CL,max, lift coefficient at α=40 °; CL,0, lift coefficient at α=0 °; CD,0, drag
coefficient at α=0 °; CD,min, minimum drag coefficient; αcrit, critical angle of attack; α, angle of attack, α0, αat CL=0; εR, εS, gliding ratio for
maximum range or minimum sinking, respectively;γ, gliding angle.
-15 -10 -5 0 5 10 15 20 25 30 35 40
α (degrees)
CL
or
CD
-1.5 -1 -0.5 0 0.5 1 1.5 2
0 0.2 0.4 0.6 0.8 1 1.2 1.4
CD
Flat plate Curved plate Asymmetric profile
A
B
-1 -0.5 0.5 1 1.5 2
CL
[image:5.612.71.550.388.689.2]Fig. 5. (A) Drag CDand lift CLcoefficients versus angle of attack αfor wing profiles 1, 2 and 3 (see Fig. 2). Open symbols, CL; filled symbols,
CD; Reynolds number Re=10 000. (B) Polar diagrams for profiles 1, 2 and 3. Values are means (N=5); all errors are smaller than the symbol
size. Profile 1 Sc,L<1.1 %, Sc,D<1.3 %; profile 2 Sc,L<0.7 %, Sc,D<2.4 %; profile 3 Sc,L<0.9 %, Sc,D<1.2 %, where Sc,Land Sc,Dare the standard
error of CLand CDmeasurements, respectively.
Fig. 6. (A) Drag CD and lift CL coefficients versus angle of attack αfor wing profile 1 at Re=7880 and 10 000. Open symbols, CL; filled
symbols, CD. (B) Polar diagrams for profile 1 at Re=7880 and 10 000. Values are means (N=5); all standard errors are smaller than the symbol
size. Errors for CL(Sc,L) and CD(Sc,D) are: Re 7880 Sc,L<0.65 %, Sc,D<2.1 %; Re 10 000 Sc,L<1.1 %, Sc,D<1.3 %, where Sc,Land Sc,Dare the
standard error of CLand CDmeasurements, respectively.
Profile 1 Profile 2 Profile 3
-15 -10 -5 0 5 10 15 20 25 30 35 40
α (degrees)
CL
or
CD
-1.5 -1 -0.5 0 0.5 1 1.5 2
0 0.2 0.4 0.6 0.8 1 1.2 1.4
CD
A
B
-1 -0.5 0.5 1 1.5 2
CL
-25 -20
Profile 1; Re=10 000 Profile 1; Re=7800
-15 -10 -5 0 5 10 15 20 25 30 35 40
α (degrees)
CL
or
CD
-1.5 -1 -0.5 0 0.5 1 1.5
0 0.2 0.4 0.6 0.8 1 1.2 1.4
CD
A
B
-1 -0.5 0.5 1 1.5
CL
[image:6.612.87.522.71.351.2] [image:6.612.77.520.415.691.2]εS=17.62). The polar plots become more symmetrical and approach those of the flat plate (Fig. 4). Correspondingly, these profiles show lower CD,min values than the unfilled wings (Table 2).
The pressure measurements (profile 4)
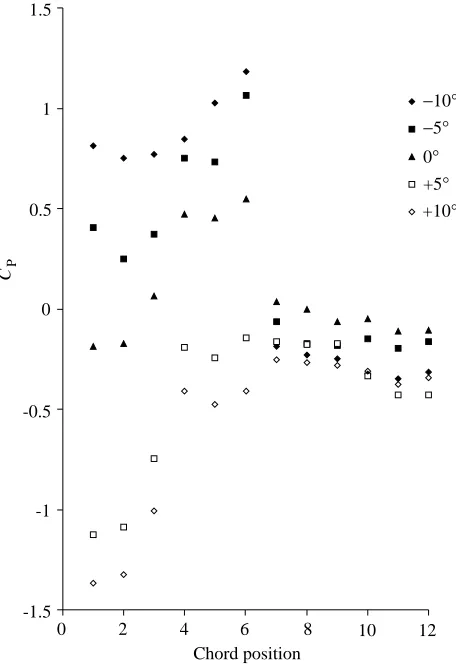
The pressure measurements or calculated CP values show that, at angles of attack from −10 to 0 °, wide areas of negative pressure can be detected on both the upper and lower surfaces of the wing (Figs 8, 9). Furthermore, differences between the first two valleys (see Fig. 3) were found on the upper surface. Fig. 10 shows that only at α>0 ° was sufficient net negative pressure generated to produce lift. This result corresponds to the CL/CD analyses (Fig. 11). As expected, the exaggerated height of this wing profile impacted strongly on its aerodynamic performance, and the gliding ratios were the lowest measured: εR=3.248 and εS=5.824 (CD,min=0.127;
CL,crit=0.552). Lift was produced only over positive angles of attack (α greater than +2 °), but increased rapidly as α increased.
Fig. 7. (A) Drag CDand lift CLcoefficients versus angle of attack αfor wing profiles 1A, 2A and 3A (see Fig. 2). Open symbols, CL; filled
symbols, CD; Reynolds number Re=10 000. (B) Polar diagrams for profiles 1A, 2A and 3A. Values are means (N=5). All standard errors are
smaller than the symbol size. Profile 1A Sc,L<0.7 %, Sc,D<2.5 %; profile 2A Sc,L<0.7 %, Sc,D<2.6 %; profile 3A Sc,L<1.1 %, Sc,D<2.8 %, where Sc,L
and Sc,Dare the standard error of CLand CDmeasurements, respectively.
Profile 1A
-15 -10 -5 0 5 10 15 20 25 30 35 40
α (degrees)
CL
or
CD
-1.5 -1 -0.5 0 0.5 1 1.5 2
0 0.2 0.4 0.6 0.8 1 1.2 1.4
CD
A
B
-1 -0.5 0.5 1 1.5 2
CL
-25 -20
Profile 2A Profile 3A
0 1 1.5
0 2 4 6 8 10 12
Chord position CP
0.5
-1 -0.5
-1.5
−10°
[image:7.612.54.510.71.362.2]−5° 0° +5° +10°
Fig. 8. Pressure coefficient CPon upper side of the wing profile 4
versus chord positions 1–12 (see Fig. 3) for values of angle of attack
[image:7.612.333.556.443.744.2]Discussion The ‘technical’ profiles
A slightly cambered aerofoil (the curved plate) at Re=10 000 performs best as far as the production of lift is concerned. However, it also produces more drag because of its concave lower surface. Lower CD,min values are produced by the flat plate. The measured CD,minof 0.041 corresponds well with the value of 0.04 (t/c=3.3 %; Re=11 000) obtained by Okamoto et al. (1996) with comparable plates and with the expected value of 0.048 calculated from equation 6.
However, neither the flat nor the curved plate fulfils the static demands of an insect wing. To obtain the necessary load-bearing capacity, a thicker wing with much higher material expenditure would be required. This would have a negative effect on the t/c ratio and, thus, on the aerodynamic performance (Okamoto et al., 1996; Sunada et al., 1997). The aerodynamic compromise provided by the asymmetric profile will also be very unfavourable as far as drag and material expenditure are concerned. Thus, to achieve the impressive relationship between material expenditure and stability seen in a dragonfly wing, the corrugated design of the wing appears to be indispensable.
The wing profiles
Analysis of the CL/CDcharacteristics of the wing profiles,
including profile 4, did not produce the extraordinary polar plots described by Newman et al. (1977), but plots much more comparable with those of the technical profiles. At an identical Re (10 000), different cross-sectional geometries along the longitudinal axis can be correlated with different aerodynamic characteristics.
Whilst profile 2 behaves somewhat like a flat plate, profiles 1 and 3 are similar to the asymmetric technical profile, not only in the values of the aerodynamic variables attained, but also in the form of their polar plots. These similarities are surprising given that the leading edges of the profiles are orientated in opposite directions. Whereas profile 1 has an upward-facing leading edge, that of profile 3, which is situated distinctly distal from the nodus, faces downwards (see Figs 1, 2). These findings contradict those of Okamoto et al. (1996), who found the aerodynamic characteristics of a profile to be dependent upon the orientation of the leading edge. Okamoto et al. (1996) used profiles with symmetrical corrugations at regular intervals along the chord length. In addition, the leading and trailing edges of the profiles were orientated in the same direction. Thus, their arrangement produced a positive camber (both edges face downwards, as in the curved plate in the present
0 1 1.5
0 2 4 6 8 10 12
Chord position CP
−10°
−5° 0° +5° +10°
0.5
-1 -0.5
-1.5
0 1 1.5
0 2 4 6 8 10 12
Chord position CP
−10°
−5° 0° +5°
+10° 0.5
-1 -0.5
[image:8.612.70.280.69.376.2]-1.5 Fig. 9. Pressure coefficient CPon the lower side of the wing profile 4
versus chord positions 1–12 (see Fig. 3) for values of angle of attack
α between −10 ° and +10 ° at a Reynolds number of 9300. Values are
means (N=3); mean standard error of CP<9.3 %. Fig. 10. Differences in the pressure coefficient CPbetween the upper
[image:8.612.323.551.73.405.2]study) or a negative camber (both edges face upwards). The profiles based on a wing of A. cyanea in the present study have an irregular corrugation that decreases along the chord length. Furthermore, the trailing edge is always orientated downwards (see Fig. 2). Thus, the wing profiles are similar to the curved plate and asymmetric profile in the presence of a positive camber and in aerodynamic characteristics. Because of the downward-facing leading edge of profile 3, a stronger camber (6 %) exists than in profile 1 (4 %), resulting in increased lift production (CL,crit+5 %, εR+7 %, εSgreater than +30 %).
However, the relatively low CD,min values found in wing profiles 1–3 contradict the interpretation that the wing functions primarily as a cambered plate. These values correspond better to those for the flat plate or the asymmetric profile.
The chord length of a real dragonfly wing varies along its length. Under identical flow velocities during gliding, this will result in an Re reduced by a factor of 0.788 in the proximally slimmer profile 1. At Re=7880, although the aerodynamic performance of profile 1 is reduced by approximately −16.6 % (εR) or −28.4 % (εS) compared with Re 10 000, and CD,min increases by approximately 13.1 %, the relatively high coefficients of drag correspond well to the Re-dependent increase in drag of 12.7 % expected from equations 5 and 6. The principal lift/drag characteristics of the profile are retained.
The ‘filled’ profiles 1A, 2A and 3A also achieve more favourable CD,min values compared with flat plates with a comparable t/c ratio. For flat plates, Okamoto et al. (1996) obtained CD,minvalues of 0.056 and 0.1 for t/c=5 % and 10 %, respectively. This reduction can be explained by the geometrically more favourable form of the leading edge (see Fig. 2) of the ‘filled’ profiles. Nevertheless, their lift production is less favourable than those of profiles 1 and 3, so that it is clear that the performance of the unfilled profiles is not simply caused by the filling of the profile valleys with part of the surrounding air, but rather that the lift-increasing effect of a cambered geometry is at least partly preserved. To summarise, an effective profile form, producing lift like the asymmetric profile, a thin full profile with a longitudinally drawn out tail, but with drag corresponding to that of a flat plate, seems to be induced by the vortices rotating on the profile of a dragonfly wing.
Actual measurements with dragonfly wings have shown that lift production is high, with CL,max=1.05–1.07 (Sympetrum
sanguinea; Wakeling and Ellington, 1997) and 1.05–1.2 (Anax parthenope julius; Azuma and Watanabe, 1988; Okamoto et al., 1996). These values are much higher than those determined in other species, e.g. CL,max 0.7–0.9 (Nachtigall, 1977a,b; Wakeling and Ellington, 1997; Ellington, 1999). Wakeling and Ellington (1997) state explicitly that the increased lift
-15 -10 -5 0 5 10 15 20 25 30 35 40
α (degrees)
CL
or
CD
-1.5
0 0.2 0.4 0.6 0.8 1 1.2 1.4
CD
A
B
-1 -0.5 0.5 1 1.5
CL
-25 -20
Profile 4; Re=10 000 Profile 4; Re=9379
-1 -0.5 0.5 1 1.5
0
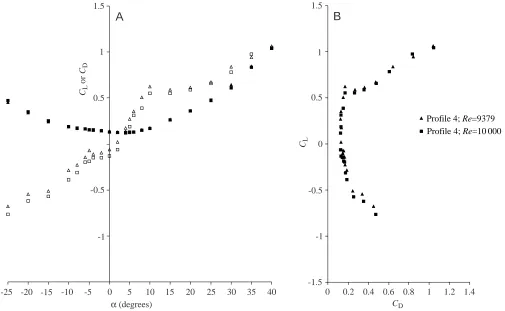
Fig. 11. (A) Drag CDand lift CLcoefficients versus angle of attack αfor profile 4 at Reynolds numbers of 9379 and 10 000. Open symbols, CL;
[image:9.612.58.563.71.382.2]production cannot be due to the Re, to the aspect ratio AR or to the absolute wing area. Thus, other factors must be responsible for the high lift production of dragonfly wings. A plausible candidate for this is the cross-sectional corrugation, a type of profile particularly pronounced in dragonflies and surpassed only by that in the forewing of a locust. As Zarnack (1982) reported, the forewing of a locust forms a characteristic profile during the up- and downstrokes during flapping flight. In fact, the highest recorded values of CL,max (1.3) are for a locust Schistocerca gregaria forewing with a downstroke-like corrugation (Jensen, 1956). Here, too, comparable measurements on a flat forewing (CL,max=1.13) show that the high CLis produced by the cross-sectional configuration of the wing.
Buckholz (1986) demonstrated that such corrugation causes an increase in negative pressure on the upper surface of the profile and, thus, an increase in lift production. But his analyses did not extend to the pressure relationship on the lower profile surface. Since negative pressure is found in all profile valleys, regardless of the profile side, a negative coefficient of pressure is not automatically correlated with greater lift production. Thus, in profiles with symmetrical and uniform corrugation, an increase in lift cannot be predicted from local increases in negative pressure in the profile valleys. The geometric construction, and in particular the sequence of bends and edges over the chord length, plays an important role in the lift production of a wing. An increase in lift due to the vortex system can only be attained if the geometry is optimally tuned. Thus, the primarily static requirements of the cross-sectional configuration will undergo aerodynamically necessary fine tuning, not only over the chord length but also over the span length. This may explain the gradual widening of the wing from the joint up to approximately 0.7lrel, particularly the reorientation of the leading edge at the nodus. To support wing function, particularly the varying longitudinal torsion of the wing during the up- and downstrokes, the configuration of the veins at the base of the wing is critical. The leading edge geometry resulting from the demands on the joint is, however, aerodynamically less favourable and is aerodynamically optimised at the first possible position, i.e. at the nodus. Therefore, the dragonfly wing can be interpreted as a multi-criterion answer to the conflict between static and dynamic demands.
List of symbols
AR aspect ratio (l/c) c chord length (m) CD drag coefficient
CD,crit drag coefficient at αcrit
CD,p pressure drag coefficient
CD,f friction drag coefficient
CD,i induced drag coefficient
CD,min minimum drag coefficient
CD,0 drag coefficient at α=0 °
CL lift coefficient
CL,crit lift coefficient at αcrit
CL,max maximum lift coefficient
CL,0 lift coefficient α=0 °
CP pressure coefficient
D drag (N)
l span length (m) lrel relative span length
L lift (N)
N number of measurements p0 measured pressure (Pa)
p∞ static pressure of flow (Pa) r radius of leading edge (m) Re Reynolds number
Recrit critical Reynolds number
S area of profile (m2) Sc,D standard error of CD(%) Sc,L standard error of CL(%)
t thickness of profile (m)
T thrust (N)
U velocity of fluid (m s−1)
α angle of attack (degrees)
α0 angle of attack (at CL=0) (degrees)
αcrit critical angle of attack (degrees)
γ gliding angle (degrees)
εR gliding ratio (maximum range)
εS gliding ratio (minimum sinking)
ν kinematic viscosity of fluid (m2s−1)
ρ density of fluid (kg m−3)
I would like to thank Katja Schmitt and Klaus Stockhum for technical assistance, Winifred Pattullo for the translation and also two anonymous referees for their critical and important comments on the manuscript.
References
Azuma, A. and Watanabe, T. (1988). Flight performance of a
dragonfly. J. Exp. Biol. 137, 221–252.
Bender, H.-W. (1987). Modellflug-Profilesammlung. Baden-Baden:
Verlag für Technik und Handwerk.
Bilo, D. (1979). About methods to analyse kinematics and
aerodynamics of flight of small birds. Dt. Zool. Ges. 64, 136–142.
Buckholz, R. H. (1986). The functional role of wing corrugation in
living systems. J. Fluids Engineer. 108, 93–97.
Ellington, C. P. (1984). The aerodynamics of hovering insect flight.
IV. Aerodynamic mechanisms. Phil. Trans. R. Soc. Lond. B 305, 79–113.
Ellington, C. P. (1999). The novel aerodynamics of insect flight:
applications to micro-air vehicles. J. Exp. Biol. 202, 3439–3448.
Hertel, H. (1963). Struktur, Form und Bewegung. Mainz: Krauskopf
Verlag.
Jensen, M. (1956). Biology and physics of locust flight. III. The
aerodynamics of locust flight. Phil. Trans. R. Soc. B 239, 511–552.
Kesel, A. B. (1998). Biologisches Vorbild Insektenflügel –
Mehrkriterienoptimierung ultraleichter Tragflächen. In
Biona-Report 12 (ed. W. Nachtigall and A. Wisser), pp. 107–117.
Kesel, A. B., Philippi, U. and Nachtigall, W. (1998). Biomechanical
aspects of insect wings – an analysis using the finite element method. Comp. Biol. Med. 28, 423–437.
May, M. L. (1995a). Simultaneous control of head and thoracic
temperature by the green darner dragonfly Anax junius (Odonata: Aeshnidae). J. Exp. Biol. 198, 2373–2384.
May, M. L. (1995b). Dependence of flight behavior and heat
production on air temperature in the green darner dragonfly Anax
junius (Odonata: Aeshnidae). J. Exp. Biol. 198, 2385–2392. Nachtigall, W. (1977a). Zur Bedeutung der Reynoldszahl und der
damit zusammenhängenden strömungsmechanischen Phänomene in der Schwimmphysiologie und Flugbiophysik. Fortschr. Zool. 24, 14–56.
Nachtigall, W. (1977b). Die aerodynamische Polare des
Tipula-Flügels und eine Einrichtung zur halbautomatischen Polarenaufnahme. Fortschr. Zool. 24, 347–352.
Newman, B. G., Savage, S. B. and Schouella, D. (1977). Model test
on a wing section of a dragonfly. In Scale Effects in Animal
Locomotion (ed. T. J. Pedley), pp. 445–477. London: Academic
Press.
Newman, D. J. S. and Wootton, R. J. (1986). An approach to the
mechanics of pleating in dragonfly wings. J. Exp. Biol. 125, 361–372.
Okamoto, M., Yasuda, K. and Azuma, A. (1996). Aerodynamic
characteristics of the wings and body of a dragonfly. J. Exp. Biol.
199, 281–294.
Rees, C. J. C. (1975a). Form and function in corrugated insect wings. Nature 256, 200–203.
Rees, C. J. C. (1975b). Aerodynamic properties of an insect
wing section and a smooth aerofoil compared. Nature 258, 141–142.
Rudolph, R. (1978). Aerodynamical properties of Libellula quadrimaculata L. (Anisoptera: Libellulidae) and the flow around
smooth and corrugated wing section models during gliding flight.
Odonatologica 7, 49–58.
Rüppel, G. (1989). Kinematic analysis of symmetrical flight
manoeuvres of Odonata. J. Exp. Biol. 144, 13–42.
Rüppel, G. and Hilfert, D. (1993). The flight of the relict dragonfly Epiophlebia superstes (Selys) in comparison with that of modern
Odonata (Anisozygoptera: Epiophlebiidae). Odonatologica 22, 295–309.
Schlichting, H. (1979). Boundary-Layer Theory. New York:
McGraw Hill.
Sunada, S., Sakaguchi, A. and Kawachi, K. (1997). Airfoil section
characteristics at a low Reynolds number. J. Fluids Engineer. 119, 129–135.
Wakeling, J. M. and Ellington, C. P. (1997). Dragonfly flight. I.
Gliding flight and steady-state aerodynamic forces. J. Exp. Biol.
200, 543–556.
Wootton, R. J. (1991). The functional morphology of the wings of
Odonata. Adv. Odonatol. 5, 153–169.
Wootton, R. J. (1992). Functional morphology of insect wings. Annu. Rev. Ent. 37, 113–140.
Zarnack, W. (1982). Untersuchungen zum Flug der
Wanderheuschrecken. Die Bewegung, räumliche Lagebeziehung sowie Formen und Profile von Vorder- und Hinterflügeln. In Insect
Flight 1. Biona-Report 1 (ed. W. Nachtigall), pp. 79–102. Stuttgart,