I in Great Britain
LABILITY OF CONDUCTION VELOCITY DURING
REPETITIVE ACTIVATION OF AN EXCITABLE
EPITHELIUM
WALTER E. SCHWAB*
Department of Biology,
Virginia Polytechnic Institute and State University, Blacksburg Virginia 24061
AND ROBERT K. JOSEPHSON
School of Biological Sciences, University of California, Irvine, California 92717 (Received 12 June 1981)
SUMMARY
Conduction velocity lability was studied in the electrically excitable epithelium of Euphysa japonica by means of intracellular recordings. Three classes of response latency change were identified in response to bursts of stimuli: an initial jump, uniform drift and abrupt jumps in latency. In each case an increase in stimulus frequency produced an increase in latency. The initial jump in latency, which occurred between the first and second response of a series, was related to the afterpotential of the first response. The increased latency of the second response appears to result from the drop in membrane resistance during the hyperpolarizing afterpotential. The uniform drift in latency remains unexplained but may be the result of ion accumulation within the tissue, progressive inactivation of the ionic chan-nels involved in producing the action potential, or junctional phenomena. The abrupt jumps in latency, which often preceded failure to respond, were found to be impulse initiation phenomena.
INTRODUCTION
Epithelia capable of producing and propagating action potentials are found through-out the animal kingdom and are particularly important components of behavioural control in larval amphibians, tunicates, annelids and hydrozoan coelenterates (re-viewed by Anderson, 1980). The electrically excitable, exumbrellar epithelia of hydromedusae offer particularly favourable preparations for the physiological analysis of epithelial conduction. Action potentials in exumbrellar epithelia trigger contractions of subumbrellar musculature resulting in a protective response called crumpling (Hyman, 1940). The exumbrellar epithelia are structurally quite simple, being composed of a single layer of flattened epithelial cells overlying the mesogloea of the
176 W. E. SCHWAB AND R. K. JOSEPHSON
10 Hz
100 mV
[image:2.451.109.372.74.200.2]10 ms
Fig. 1. A series of action potentials recorded intracellularly from the epithelium of E. japonica evoked by electrical stimulation at 10 Hz. The lowest action potential on the bottom trace is the first of the series. Subsequent responses were displaced upward by a raster generator circuit.
swimming bell (Mackie & Passano, 1968). In some species of hydromedusae, the exumbrellar epithelium is nerve-free (Mackie & Passano, 1968) so that epithelial conduction can be examined without the complexities introduced by concomitant neuronal activity. Although the exumbrellar epithelium of hydromedusae is generally quite thin, intracellular recordings are possible. Intracellular electrical recordings have demonstrated that the exumbrellar epithelial cells of Euphysa japonica are elec-trically excitable and that adjacent epithelial cells are elecelec-trically coupled (Josephson & Schwab, 1979). We have also determined the passive electrical properties of the epithelial cells by examining the current flow between the cells. It was found that the epithelium, although composed of discrete cells, behaves in most respects as a single, large, but very thin cell. Thus, when an action potential is initiated anywhere on the epithelium, current flows in two dimensions away from the source rather than uni-directionally as in an axon (Josephson & Schwab, 1979).
wipomca. It will be shown that decreasing conduction velocity is accompanied by a
reduction in the height of the action potential overshoot and an increase in the rise time of the action potentials.
MATERIALS AND METHODS
E. japonica were collected between April and June at the University of Washington
Friday Harbor Laboratories. Specimens were kept in small dishes containing sea water at 9—14 CC, the temperature of the local sea water, and were used within one week of capture.
A rectangular strip of the swimming bell, covered by exumbrellar epithelium on one side and subumbrellar tissue on the other, was prepared by cutting off the margin and apex of the bell and slitting the resulting hollow cylinder up one side. The strip was pinned exumbrellar side up to a layer of transparent resin (Sylgard, Dow Corning, Midland, Michigan) in the bottom of a dish containing sea water. A water-jacket surrounding the dish held the temperature at 9-11 °C.
Action potentials were recorded extracellularly using suction electrodes with plastic tips drawn to o-2-o-3 mm OD. The tissue was stimulated electrically by current pulses delivered either through a suction electrode, like that used for recording, or through two thin, insulated silver wires whose exposed tips were placed close together on the tissue surface. In general, the intensity of the stimuli was twice threshold. Intracellular recordings were made with glass capillary microelectrodes (50-90 MQ) filled with 3 M-KC1. The tissue was viewed with Hoffman modulation contrast optics (Hoffman & Gross, 1975) and the final penetration achieved with a piezoelectric drive (Chen, 1978). Additional details about intracellular recording techniques are given by Josephson & Schwab (1979). Response families were produced by means of a raster-stepper circuit. Several configurations of stimulating and recording electrodes were used (Fig. 2).
The following terms will be used in discussing results. Response latency—the time between the onset of the stimulus and the occurrence of the peak of the electrical response at a recording site. Transit time—the difference between latencies at two recording sites, one of which was closer to the stimulating electrode than the other. As far as is known, conduction velocity in the epithelium of E. japonica is radially symmetrical with no preferential axis. Therefore, the difference in the distance between two recording sites (measured from the point of stimulation) divided by the transit time gives the conduction velocity for the radial distance delimited by the two recording electrodes, even if the two recording electrodes and the stimulating electrode are not all in a single line.
RESULTS Classes of latency change
i78 W. E. SCHWAB AND R. K. JOSEPHSON
m
X" 0 0 3 - 0-60 mm
A", = 1-7 mm
IV
l - 0 - 5 4 mm
^3= 3 - 4 - 5 - 6 mm
Fig. 2. The four types of preparation used: I, an extracellular stimulating electrode and two extracellular recording electrodes (Rt and R,) at different distances from the recording site; II, an extracellular stimulating electrode, an intracellular recording electrode (Ri) near the stimulating electrode and a distant extracellular recording electrode (Rj); III, an intracellular stimulating electrode and an intracellular recording electrode (R) placed close to the stimulat-ing electrode and; IV, an intracellular electrode separated by 3-5 mm.
allow recovery. The interstimulus intervals were constant within a burst and were varied from 0-16 to 5 s on different trials. The response latency at either recording site includes both the response initiation time at the stimulating electrode and the conduc-tion time to the recording electrode. Since initiaconduc-tion time is common to the response latency at each recording electrode, the transit time is due entirely to conduction time between the recording sites.
Preparations varied in their abilities to follow repetitive stimuli and in the lability of the response latency at the two recording sites. Some preparations did not produce an action potential for each stimulus if the interstimulus interval was shorter than a few seconds; other preparations responded in a one-to-one manner to stimulus frequencies of 6 Hz or more. In most preparations the response latency increased at both recording sites for all but the longest interstimulus intervals U9ed.
1 Hz 2Hz
2mV
0-2 Hz 50 mj
Fig. 3. Latency changes during repetitive stimulation at two extracellular recording sites,
X = 1-7 and 34 mm from the stimulating electrode (Type I preparation). The upper sets of
traces are from the closer recording electrode, the lower gets from the more distant electrode. In each group the first response is at the bottom of the display. The three types of latency changes are shown: A, a uniform drift; B, an initial jump (note the interval between the first and second response); and C, an abrupt shift in latency (note the last response).
latency was smaller the lower the stimulus frequency, and at very low stimulus frequencies the response latency was sometimes constant throughout the burst. The transit time between the two recording sites increased as well as the response latency at either site, indicating that there was a progressive decrease in conduction velocity between the two sites (Fig. 4). In most preparations, the percentage increase in response latency at the closer recording site was roughly equivalent to the percentage increase in transit time between the two sites (Fig. 4); in some other preparations the percentage change in latency at the closer recording site was greater than the per-centage change in transit time, indicating that there may be a response initiation component to the increasing response latencies as well as in a conduction velocity component.
i8o W. E. SCHWAB AND R. K. JOSEPHSON
Response latency at close recording site Transit time
4 0 r 016 40 0 1 6
100 500 5 1
Stimulus number
Fig. 4. Latency changes during repetitive stimulation. The curves on the left are increases in latency during repetitive stimulation at the first recording electrode located 1 -7 mm from the stimulating site. The curves in the graph on the right show increases in transit rime of the action potential between the first recording electrode and a second electrode 3-4 mm more distant, and hence reflect the conduction velocity between the two sites. The numbers to the right of each curve are the interstimulus intervals in seconds. The change in response latency between the first and second stimulus at short interstimulus intervals is the initial jump type of shift, while the response latencies after the second stimulus show the uniform drift type of latency increase. The tested stimulus frequencies were presented in random order and each point is the mean of responses from five bursts. Vertical bars are the standard errors for the larger values. The conduction velocity between the two recording electrodes following single shocks averaged 3 3 cm s"1 in this preparation.
3 B and 4). The initial jump in latency increased with decreasing interstimulus interval. The initial jump was also seen both in the transit time between recording electrodes (Fig. 5) and in the latency at each recording site, indicating that at least part of the initial jump in latency was due to a decrease in conduction velocity.
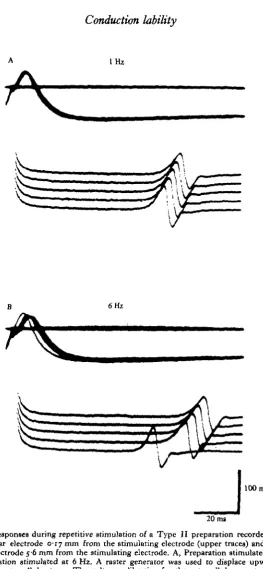
The third type of latency increase, called an abrupt jump, occurred occasionally and unpredictably at both recording sites (Fig. 3 C). The latency change was sometimes transient and the response latency following the next stimulus nearly normal, but more often abrupt jumps in latency preceded failure to respond to the next stimulus. This type of response latency change is similar at both recording sites, indicating that the phenomenon was one of response initiation, or possibly changes in conduction velocity in the immediate vicinity of the stimulating electrode, and not a widespread decrease in conduction velocity.
Latency changes in narrow strips
l H z
6Hz
1
100 mV
[image:7.451.86.350.49.619.2]20 ms
Fig. 5. Responses during repetitive stimulation of a Type II preparation recorded with an intracellular electrode 0-17 mm from the stimulating electrode (upper traces) and an extra-cellular electrode 5-6 mm from the stimulating electrode. A, Preparation stimulated at 1 Hz; B, preparation stimulated at 6 Hz. A raster generator was used to displace upwards each successive extracellular trace. The voltage calibration for the extracellular events represents
l 8 2 W. E. SCHWAB AND R. K. JOSEPHSON
Close recording site 20 r
I
J3
&
2 0 i
-Distant recording site
0 1 3 10
0 1 3 ( 8 )
0-50 (2) 1 0 0 ( 1 )
5 1 2 3 4 5
[image:8.451.66.392.76.261.2]Stimulus number
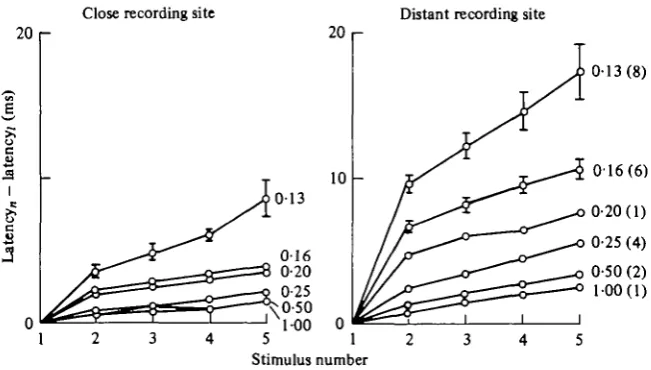
Fig. 6. Changes in latency at close and distant recording sites during repetitive stimulation (Type II preparation). The numbers to the right of the curves are the interstimulus intervals in seconds, and the sample size is in brackets. Standard errors are shown for some of the larger values. The closer electrode was an intracellular electrode O-26-O-S4 mm from the stimulating electrode; the distant electrode was an extracellular electrode 3 -4 mm from the stimulation site. The average latency for the first shock of each series was 12-2 ms at the closer electrode and 40-3 ms at the more distant electrode.
strips, stimulated repetitively, conducted about as many action potentials before failure as did full preparations, and gave latency changes of the same kind and magnitude as seen with large blocks of tissue. Thus the latency changes seen in the epithelium are not due to the progressive development of new, longer pathways.
Initiation and conduction time
20
3
10
2
3
Frequency = 6 Hz
Close recording site Distant recording site
20
10
c.v. = 9-5 cm/s D = 5 6 mm
c.v. = 10-7 £> = 3-4mm
n = 6 c.v. = 8 1 cm/s Z) = 3-4 mm n = 2
c.v. = 15-8 cm/s 0 = 3-4 mm
1 2 3 4 5 1 2 3 4 5
[image:9.451.50.406.65.289.2]Stimulus number
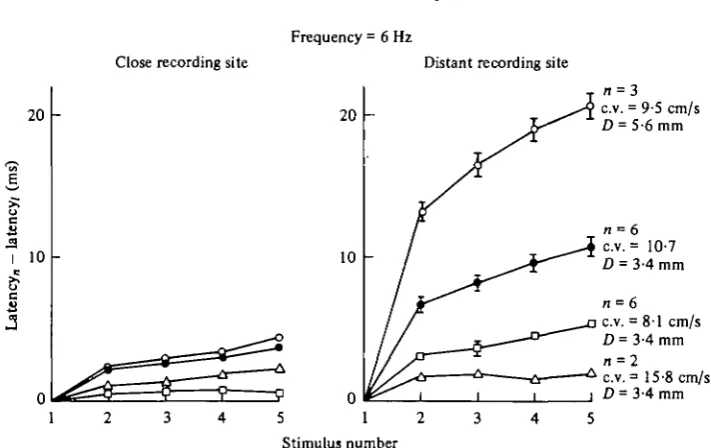
Fig. 7. Variability of the stimulus to response latency between different animals (Type II preparation). Each symbol represents a different animal. Standard errors are indicated where the sample size is 3 or more and the standard error greater than the size of the symbol. All data are from trials with a stimulus frequency of 6 Hz. Figures for sample size, conduction velocity for the first stimulus of each trial, and the distance between the stimulating and more distant recording electrodes are beside the right-hand set of curves. Conduction velocity is based on the transit time between recording electrodes. The distance between the stimulating and the closer recording electrode ranged from 0-17 to 0-54 mm.
0-5 s (Figs. 5B and 6); and (3) abrupt jumps in response latency, apparently due to increases in response initiation time, since the increase in response latency was similar at both recording sites (instances of abrupt jumps have been excluded from plotted latencies such as in Figs. 6 and 7). The size of these latency shifts was quite variable in different preparations (Fig. 7), and often with time in the same preparation. Frequently the conduction velocity through the epithelium slowly declined during the course of
an experiment and the lability of response latency increased.
W. E. SCHWAB AND R. K. JOSEPHSON
1 Hz
2 Hz
1 Hz
_/• t .
1 Hz
v
50 ms Fig. 8. Conduction block beyond the first recording electrode in a Type II preparation. The lower set of traces is from an extracellular electrode 3 4 mm from the stimulating electrode. Each successive sweep is stepped upward. The middle traces (upper set in A) are the responses recorded with an intracellular electrode 0-25 mm from the stimulating electrode. The horizon-tal line is the zero potential level for the intracellular records. The upper set of traces in B-D is a duplicate of the intracellular record, but with each successive sweep displaced upwards. In B-D note the correlation between the small depolarizing response in the intracellular record (marked with an arrow in D) and the occurrence of a propagated response at the distant extracellular recording site. The calibration bar for the intracellular records represents 50 mV, and the calibration bar for the extracellular records represents 0-5 mV.
Action potentials evoked by intracellular current
Fig. 4 indicates that during repetitive stimulation, most of the latency change at a recording site some distance from the stimulating electrode was due to decreasing conduction velocity. There were response latency changes very close to the stimulating electrode, however, which were probably due to changes in spike initiation time. Further, abrupt jumps in latency were not reflected in a changed conduction velocity and so may have been entirely due to delayed action potential initiation.
Lability in response initiation during a stimulus burst could be due to changing membrane impedance, which alters current flow into the tissue from the extracellular stimulating electrode. In order to ensure constant transmembrane stimulating current, responses were initiated by repetitive current pulses injected directly into an epithelial cell with an intracellular electrode. Evoked action potentials were recorded with a second intracellular electrode close to the first (Type III preparation, Fig. 2). The distance between the stimulating and recording electrodes (30-600 fim) was much less than the space constant of the epithelium (1-3 mm, Josephson & Schwab, 1979), so the recorded potential should reflect cellular depolarization at the site of stimulation.
Shifting response latencies, in this case largely reflecting changes in response initiation time, occurred with repetitive intracellular current pulses as well as with extracellular stimuli. Again, the latency changes occurred in the same classes: an initial jump between the first and second stimuli at short interstimulus intervals; uniform drift in latency increases following the second pulse of the stimulus burst ;and unpredictable, abrupt increase in response latency (Fig. 9). The abrupt jumps are interesting in that the membrane depolarization initiated by the stimulus would significantly wane before an action potential rather slowly emerged. The slow initial rise of delayed action potentials is similar to the slow development of action potentials seen frequently during long, depolarizing current pulses (e.g. Fig. 5 of Josephson & Schwab, 1979).
Variation in action potentials during repetitive stimulation
Changes in conduction velocity through the epithelium during repetitive stimulation presumably arise as a consequence of changing epithelial cell excitability or changes in the passive cable properties of the tissue. Alteration of epithelial excitability should be reflected in the size and shape of the action potentials produced by the cells. Type IV preparations (Fig. 2) were used to examine the lability of the epithelial action potentials during repetitive stimulation. The distance between the stimulating electrode and the intracellular recording electrode was approximately 2-5 mm in most instances. This distance was chosen as being mid-way between the positions of the two recording electrodes in Type I preparations and, therefore, in a region over which changes in conduction time had been examined.
i86 W. E. SCHWAB AND R. K. JOSEPHSON
6 Hz
0-5 V
50 mV
200 nA
20 ms
1 hz
100 mV
50 mV
200 nA
50 ms
4 Hz 6 Hz
40 ms 20 ms
10 Hz
50 mV
[image:13.451.42.438.50.490.2]2 kV s"1
Fig. 10. Action potentials during repetitive stimulation in a Type IV preparation. In A and B the lower, superimposed traces are action potentials recorded with an extracellular electrode 2-5 mm from the stimulating electrode in two different animals. The horizontal line is the zero potential level. The upper, stepped traces are the intracellularly recorded action potentials at lower gain, and are included to allow identification of the superimposed responses on the basis of their latency. In A and B, the calibration bar for the upper set of traces represents 200 mV and the bar for the lower set of traces represents 50 mV. The first response of the stepped traces is the lowest. In C, the upper set of traces are the same action potentials shown in Fig. 1 and the lower set of traces are the time derivatives of those potentials obtained with an electronic differentiating circuit (time constant = 5 ms).
i88 W. E. SCHWAB AND R. K. JOSEPHSON
140
„ 120
S x •5 100
140
| 120
o o.
3
100
x 1 4 0
4> ^
I I
•I- 120
100
0 1 2 3 4 5 5-8 0 1 2 3 Decrease in action potential overshoot
(overshoot;— overshoot,,, mV)
4 5 6 7
Fig. I I . Increase in response latency as a function of reduction in action potential overshoot during repetitive stimulation. In Aj and A2 the measured latency was between the stimulus
onset and the action potential peak occurring at an intracellular electrode 2-5 mm away from the stimulating electrode (Type IV preparations). The shaded bars in As are for the change in
latency and overshoot between the first and second response of each series; unshaded bars indicate changes in latency between the first response and responses after the second. These two classes are combined in A,. In B the measured response latency was that between the action potential peak at the intracellular recording electrode near the stimulation site and the peak response at an intracellular electrode 3—5'6 mm more distant (Type II preparations). The number of observations is indicated within the bars; vertical lines give the standard errors.
from essentially the same membrane potential as the second response. Nevertheless, there were usually progressive changes in the form of later action potentials: the initial rise became progressively slower, the maximum rate of voltage change tended to decline and the action potential peak became slightly but continuously less positive during the series (Fig. 10).
shows the initial jump in latency). There seems to be no significant difference between Ihe amplitude-latency relations for the second action potential and that for later responses, therefore data for all responses are grouped in Fig. 11 Av
A striking feature of Figs. 11A1 and A2 is the steepness of the relation between the amplitude of the overshoot and the response latency; a reduction of 3-4 mV in the size of the overshoot is associated with a more than 20 % increase in latency. It should be emphasized that it is a change in action potential overshoot and not total action potential amplitude which is plotted in Fig. 11. At short interstimulus intervals the second and subsequent action potentials arise from the afterpotential of the first spike, and hence begin from a more negative potential than the first. For the results plotted in Fig. 11 A, the voltage at the action potential onset averaged 3-4 mV more negative for the second and subsequent responses than for the first action potential (s.D. = i-6 mV, n = 22 bursts). The reduction in overshoot amplitude for all entries of Fig. 11A averaged 2-2 mV. Therefore in most instances the second and subsequent action potentials of the bursts were larger than the first spikes, mainly because the increased negativity at the onset of the second and subsequent spikes was greater than the decrease in positivity at the peak of the spikes.
Fig. 11 B shows the relation between action potential overshoot and changes in response latency in Type II preparations; i.e. with an intracellular recording electrode close to the stimulating electrode and an extracellular recording electrode several millimetres away. Here the change in transit time refers to the interval between the action potential peak at the intracellular electrode and the peak of the response at the distant extracellular electrode. The data are from 35 bursts showing appreciable response latency shifts in five preparations. The original records were like those in Fig. 5. Because of the short distance between the stimulating and intracellular elec-trodes there was often little temporal dispersion in response latency at the intracellular electrode, and the amplitudes of the third and subsequent responses were not measur-able with sufficient precision to be useful. Consequently over one-half of the entries in Fig. 11 B refer to the response to the second stimulus. The relation between decrease in overshoot amplitude and increase in response latency is quite like that obtained in Type II preparations; again a reduction in 3-4 mV in the potential at the positive peak is associated with more than 20% increase in response latency.
Although the increases in response latency during repetitive stimulation were generally regular and predictable, the changes in action potential waveform sometimes were not. In some trials with some preparations the amplitude of the action potential overshoot dropped initially but then remained nearly constant (as nearly as could be measured) even though the latency progressively increased. In other preparations the overshoot and the maximum rate of potential change fell initially but then waxed and waned erratically, again in the face of regularly increasing response latency. The lack of a universal correlation between action potential parameters and response latency change may be a sampling problem. The action potential was measured at a point and reflected local excitability, while the latency was influenced by the excitability over the whole propagation pathway and therefore represented an average response. Possibly local excitability rose and fell irregularly even though the tissue as a whole was becoming progressively less excitable. Also it should be noted that intracellular
190 W. E. SCHWAB AND R. K. JOSEPHSON
recordings were ephemeral, and a successful electrode penetration seldom remained within a cell for more than a minute or so. Local damage and changes in membrane sealing about the electrode, which altered electrical shunting at the penetration site, may also have contributed to local variability in the waveform of the action potential.
DISCUSSION
Three classes of latency change were identified in the epithelium of E. japomca: uniform drift, initial jump and abrupt jumps. Each appears to have a different mechanistic origin.
The uniform drift in latency is difficult to explain. It is not due to an accumulation ^f the conductance change that produces the afterpotential. Such an augmented conductance would be signalled by increased hyperpolarization, but the afterpotentials of successive response are superimposable, therefore the hyperpolarization does not increase. The uniform drift and the initial jump in latency are associated with declin-ing action potential overshoot and rate of rise, but the change in overshoot is rather small. In squid axons, reducing the extracellular sodium concentration so as to reduce the action potential overshoot by 20 mV results in a 30% reduction in conduction velocity (Hodgkin & Katz, 1949). In the epithelium of E.japonica a reduction of only 2-3 mV is associated with a 20% reduction in conduction velocity.
Evaluation of the causes of latency lability in the epithelium is hindered by the lack of theoretical analysis of active propagation in two-dimensional sheets of tissue. Even for one-dimensional cables such as unmyelinated axons, quantitatively predicting conduction velocity from fibre properties is a difficult task. Successful approaches have required exact knowledge of the kinetics of specific conduction changes (Hodgkin & Huxley, 1952), or, at a minimum, the assumption that the conduction velocity is constant and that the action potential waveform is not a function of the distance along the route of propagation (e.g. Matsumoto & Tasaki, 1977; see general discussion in Jack, Noble & Tsien, 1975). The kinetics of conductance changes are not known for the epithelium of E.japonica, nor is there assurance that the conduction velocity and action potential waveform do not change with propagation distance in a two-dimensional sheet of tissue in which the wave front broadens as the action potential moves away from its source.
Two suggestions might be made as to the possible causes of the uniform drift in latency, even in the absence of direct information. The increasing response latencies could be due to progressive inactivation of the ionic channels involved in the produc-tion of acproduc-tion potentials (Bliss & Rosenberg, 1979). This hypothesis is consistent with the declining action potential overshoot and rate of rise during repetitive stimulation. Alternatively, the latency change might be caused by ion accumulation within the tissue (Bliss & Rosenberg, 1979). Evoked action potentials in the exumbrellar epithel-ium can be recorded extracellularly in either Na+-free or Ca2+-free sea water but the potentials are blocked in the absence of both ions. Further, the amplitude of the intracellular action potential is reduced in the presence of 4 mM Mn2+ (W. E. Schwab, unpublished observations). These results suggest that at least part of the inward current during an action potential is carried by Ca2+. The potential change during an action potential is approximately 70 mV. If the depolarization were entirely due to calcium entry, and if the capacitance of the inner and outer membranes of the epithelial cells were each 1 F/cm2, a total of 7-3 x io~13 moles of Ca2+ per cm2 would have to cross the inner and outer cell membranes to account for the potential change. Since the average thickness of the epithelial cell layer is i-4/jm, this Ca2+ influx would raise the cytoplasmic Ca2+ concentration by approximately 5 x io~6 M. Assuming that the internal Ca2+ concentration in the cell is initially of the order of 1 x io~7 M, the calculated Ca2+ influx would reduce the calcium equilibrium potential from
+140 mV (11 °C) in a resting preparation to +92 mV immediately after an action Dotential. A reduction in electrochemical driving force such as this could result in a
192 W. E. SCHWAB AND R. K. JOSEPHSON
reduction in action potential rise time and overshoot, and would certainly reduce tha conduction velocity. In addition, an intracellular concentration of 5-8 x io~B M-Caa* has been found to uncouple electrically coupled salivary gland cells of Chironomas (Loewenstein, Nakas & Socolar 1967; Olivera-Castro & Loewenstein, 1971; Rose & Loewenstein, 1976). This concentration is about one-tenth the increase in intra-cellular calcium concentration to be expected if calcium were the major ion carrying current across the membrane during the action potential. Thus if calcium is a major current carrier in E. japonica, the intercellular junctions must be less sensitive to uncoupling than Chironomas, or there must be very active sequestering mechanisms in the cytoplasm (cf. Rose & Loewenstein, 1975); otherwise the epithelial cells would become uncoupled after a dozen or so action potentials. Partial uncoupling of the cells, produced by calcium entry, could partially uncouple them, resulting in an increased internal longitudinal resistance, a reduced space constant, and a reduced conduction velocity. These probabilities could be tested in this tissue.
We thank the University of Washington and the staff of Friday Harbor Laboratories for providing facilities for this work. Funds for research were provided by a grant BNS-75-09530 from the National Science Foundation to R.K.J., and funds for other costs were provided by grant BNS-8004851 from the National Science Foundation to W.E.S.
REFERENCES
ANDERSON, P. A. V. (1980). Epithelial conduction: its properties and functions. Prog. Neurobiol. 15, 161-203.
BLISS, T. V. P. & ROSENBERG, M. E. (1979). Activity-dependent changes in conduction velocity in the olfactory nerve of the tortoise. Pfugers Arch. 381, 209-216.
BULLOCK, T. H. (1951). Facilitation of conduction rate in nerve fibres. J. Physiol. 114, 89-97. CHEN, V. K. (1978). A simple piezoelectric drive for microelectrodes. J. Phys. E. 11, 1092-1093. CHUNG, S. H., BLISS, T. V. P. & KEATING, M. J. (1974). The synaptic organization of optic afferents in
the amphibian tectum. Proc. R. Soc. Land. B 187, 421-447.
ERLANGER, J. & GASSER, H. S. (1937). Electrical Signs of Nervous Activity. Philadelphia: University of Pennsylvania Press.
GARDNER-MEDWIN, A. R. (1972). Supernormality of cerebellar parallel fibers: the effects of changes in potassium concentration in vitro. Ada Physiol. Scand. 84, 38-29 A.
GASSER, H. S. (1956). Olfactory nerve fibers. J. gen. Pliysiol. 39, 473-496.
GEORGE, S. A. & SILBBRSTEIN, P. T. (1977). Conduction velocity after effects of spike activity: quantita-tive studies. Soc. Newrosci. Abst. 3, 217.
HODGKIN, A. L. & HUXLEY, A. F. (1952). A quantitative description of membrane current and its application to conduction and excitation in nerve. J. Physiol. 117, 500-544.
HODGKIN, A. L. & KATZ, B. (1949). The effect of sodium ions on the electrical activity of the giant axon of the squid. J. Physiol. 108, 37-77.
HOFFMAN, R. & GROSS, L. (1975). Modulation contrast microscope. Appl. Opt. 14, 1169-1176. HYMAN, L. H. (1940). Observations and experiments on the physiology of medusae. Biol. Bull. mar.
biol. lab., Woods Hole 79, 282-296.
JACK, J. J. B., NOBEL, D. & TSIEN, R. W. (1975). In Electric Current Flow in Excitable Cells, Pp. 502. Oxford: Clarendon Press.
JOSEPHSON, R. K. (1974). Cnidarian neurobiology. In Coelenterate Biology Reviews and Perspectives. New York: Academic Press.
JOSEPHSON, R. K. & SCHWAB, W. E. (1979). Electrical properties of an excitable epithelium. J. gen.
Physiol. 74, 213-236.
Kocsis, J. D., SWADLOW, H. A., WAXMAN, S. G. & BRILL, M. H. (1979). Variation in conduction
•XIEWENSTEIN, W. R., NAKAS, M. & SOCOLAR, S. J. (1967). Junctional membrane uncoupling. Perme-ability transformations at a cell membrane junction. J. gen. Physiol. 50, 1865-1891.
MACKIE, G. O. (197s). Neurobiology of Stomatoca. II. Pacemakers and conduction pathways. J.
Neuro-biol. 6, 357-378.
MACKIE, G. O. & PASSANO, L. M. (1968). Epithelial conduction in hydromedusae. J. gen. Pliysiol. 5a, 600-621.
MATSUMOTO, G. & TASAKI, I. (1977). A study of conduction velocity in nonmyelinated nerve fibers.
Biophys.jf.ao, 1-13.
OLIVERA-CASTRO, G. M. & LOEWENSTEIN, W. R. (1971). Junctional membrane permeability. Effects of divalent cations. J. Mtmbr. Biol. 5, 51-77.
PICKENS, P. E. (1974). Changes in conduction velocity within a nerve net. J. Netirobiol. 5, 413—420. ROSE, B. & LOEWENSTEIN, W. R. (1975). Calcium ion distribution in cytoplasm visualized by aequorin.
Distribution in the cytosol is restricted due to energized sequestering. Science 190, 1024-1026. ROSE, B. & LOEWENSTEIN, W. R. (1976). Permeability of a cell junction and the local cytoplasmic free
ionized calcium concentration: a study with aequorin. J. Membrane Biol. 38, 87-119.
SHELTON, G. A. B. (1975 a). The transmission of impulses in the ectodermal slow conduction system of the sea anemone Calliactis parasitica (Couch). J. exp. Biol. 6a, 421-432.
SHELTON, G. A. B. (19756). Colonial conduction systems in the Anthozoa: Octocorallia. J. exp. Biol. 6a, S7I-578.
SHELTON, G. A. B. (1975 c). Electrical activity and behaviour in Anthozoan hard corals. Nature 253, 558-560.
SPENCER, A. N. (1974). Behavior and electrical activity in the hydrozoan Proboscidactyla flcvicirrata (Brandt). I. The hydroid colony. Biol. Bull. mar. biol. lab., Woods Hole 145, 100-115.
SPENCER, A. N. (1975). Behavior and electrical activity in the hydrozoan Proboscidactyla flavicirrata (Brandt). II. The medusa. Biol. Bull. mar. biol. lab., Woods Hole 148, 236-250.
SPENCER, A. N. (1978). Neurobiology of Polyotcliis. I. Function of effector systems. J. Neurobiol. 9, 143-157.
SWADLOW, H. A. (1974). Systematic variations in the conduction velocity in the rabbit corpus callosum.
Exp. Neurol. 43, 445-451.