With 10 figures Printed in Great Britain
CODING OF DIRECTIONAL INFORMATION BY SINGLE
NEURONES IN THE S-SEGMENT OF THE FM BAT,
MYOTIS LUCIFUGUS
BY PHILIP H.-S. JEN
Division of Biological Sciences, University of Missouri, Columbia, Missouri 65211
(Received 6 November 1979)
SUMMARY
1. Response parameters of S-segment neurones of the FM bat Myotis
lucifugus were measured as a sound was delivered from different azimuthal
angles around the animal's head.
2. The response parameters investigated were the amplitude and threshold of the evoked potential (N3) of the S-segment, together with the threshold, latency and number of impulses (per stimulus pulse) of single units.
3. All the neurones studied had their lowest thresholds either at 20-400 contralateral, or 20-40° ipsilateral or at the front (o°).
4. The amplitude of the sound affected the relationship between stimulus direction and the amplitude of a non-monotonic N3, and the relationship between stimulus direction and the number of impulses of a non-monotonic single unit. It had no such effects with a monotonic N3 and a monotonic single unit.
5. From a study of N3 amplitudes and numbers of impulses of single neurones, it appeared that an azimuthal difference as small as 30 could be easily coded at a 95% correct level with stimuli presented at around 20° ipsilateral, 20° contralateral, and at the front.
6. The inter-aural pressure difference (IPD), which is considered an essential cue for echolocation in Myotis (Shimozawa et al. 1974), changed linearly with angle from 0 to 40° lateral at a rate of 0-4 dB/degree for sounds between 33-5 and 49-0 kHz.
7. Assuming the just-detectable IPD to be 0-5 dB (as in man), the minimum detectable azimuthal difference of Myotis around the median plane would be i-25°.
INTRODUCTION
204 P. H.-S.
JENemitting sounds and listening to the returning echoes. Griffin (1944) called this process echolocation.
Bats locate the source of an echo in the way that all vertebrates locate the source of a sound: by binaural comparison. The interaural time and pressure differences are the two main cues in sound localization (van Bergeijk, 1962). The classical view is that interaural times are important for localizing low-frequency sounds whereas interaural pressure differences are utilized for localizing 9ounds above 3 kHz (Stevens & Newman,
I936)-Since bats have a very small interaural distance and use ultrasonic signals in echolocation, most investigators believe that interaural pressures are the main cues which bats use for sound localization. Indeed, this is indicated by the relative sizes of the nuclear regions in the superior olivary complex (SOC), which is the first region in the brain where the inputs from the two ears converge (Papez, 1930; Rasmussen, 1946; Stotler, 1953). The S-segment (lateral superior olive), which has been shown to be sensitive to the interaural pressure difference, is very prominent in Myotis lucifugus, but the accessory nucleus (medial superior olive) which processes interaural time differences is very small or absent (Irving & Harrison, 1967; Masterton & Diamond, 1967; Masterton, 1974). The proportion of the SOC occupied by these nuclei (and others) is different in bats than in cats or dogs (Irving & Harrison, 1967; Goldberg & Brown, 1968; Harrison & Feldman, 1970).
Over the past decade there have been a number of studies concerned with the directionality of single units and evoked potentials in the cochlear nucleus and inferior colliculus of bats (Grinnell, 19636; Suga, 1964; Grinnell & Grinnell, 1965; Neuweiler, 1970; Grinnell & Hagiwara, 1972; Shimozawa et al. 1974; Schlegel, 1977). However, there have been no studies dealing with the directional properties of neurones in the S-segment. The purpose of this study is to investigate the directional sensitivity of S-segment neurones in order to better understand how the auditory system of a bat processes directional information.
MATERIALS AND METHODS
Twenty-eight Myotis lucifugus (weighing 7-12 g) were anaesthetized for surgery with Nembutal (45 mg/kg of body weight). Using a method described previously (Jen, 1978), the flat head of a i-8 cm nail was glued onto the bat's exposed skull with Eastman 910 and dental cement. The animal was then secured onto a small cross-like metal plate and its head was immobilized by fixing the shank of the nail into a metal rod with a set screw. After a tracheotomy was performed, those parts of the basioccipital and basisphenoid bones which overlay the ventral aspect of the brain stem were exposed. A small opening was made in the bone, then a 3 M-KC1 micro-pipette electrode or a tungsten wire electrode was inserted into the brain through the opening.
100
•o
80
60
40
-A _ 1 1 r
60 40 Contra
20 0 20 40 Ipsi
60 60
Azimuth (deg) 40 Contra
20 0 20 40 Ipsi
[image:3.451.41.382.49.281.2]60
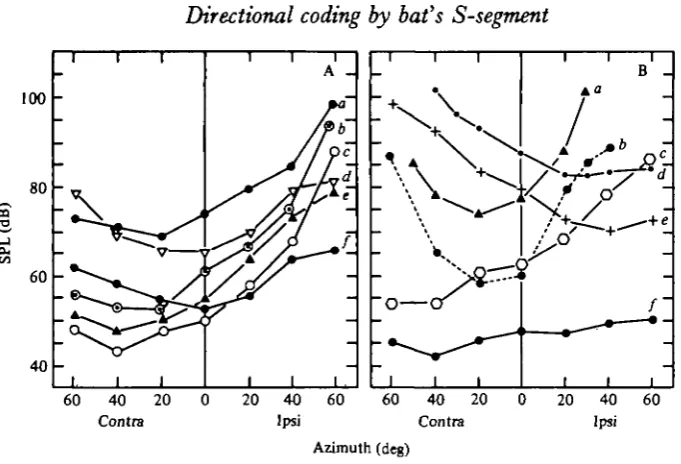
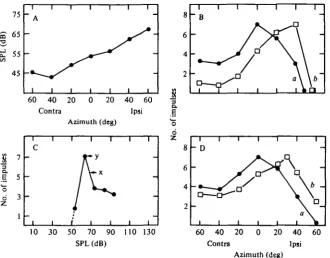
Fig. 1. Relationship between stimulus direction and threshold of (A) six N , potentials and (B) six single units. Best frequencies (kHz) in A were 5 3 6 (a), 48-2 (6), 4 1 0 (c), 3 4 0 (</), 41-5 (e), 44-8 (/). In B they were 8 0 8 (a), 37-5 (6), 76-2 (c), 7 3 4 (d), 37-5 («), 65-6 (/). Contra = con-tralateral; Ipsi =• ipsilateral.
A condenser loudspeaker (38 mm in diameter) was mounted on the top of a wooden bar that could be moved around the bat's head. The distance between the loudspeaker and the animal's ears was 62 cm. Neural responses were recorded in an electrically shielded chamber, the inner walls and ceiling of which were covered with convoluted polyurethane foam to reduce echoes. The temperature of the chamber was kept between 35 and 38 °C. The stimulus was a tone burst of 40 ms duration and 0-5 ms rise and decay times. Tone frequency was chosen to be that frequency which, when delivered at o° (in front of the bat's head), resulted in the lowest threshold for the measured response. It is here termed the best frequency, BF.
Coding of stimulus direction by the S-segment was studied by delivering the stimulus at different angles around the bat's head while measuring the threshold, latency and amplitude of the evoked potential of the S-segment, N3 (Grinnell & Hagiwara, 1972; Suga & Shimozawa, 1974; Jen, 1978), and the threshold, latency and number of impulses of single unit activity. Unless otherwise stated, the stimulus was presented from 6o°, 400 and 200 contralateral, oc (in front of the bat), and 200, 400 and 6o° ipsilateral.
RESULTS
Directional sensitivity of S-segment neurones
(a) Effect of stimulus direction upon N3 threshold. The threshold of the N3 response
was defined as the minimum stimulus level which evoked 15 /tV peak response amplitude. In these experiments, BF's ranged from 38 to 50 kHz.
206
P. H.-S.
JEN0-2
-40 Contra
20 20 40 60
[image:4.451.106.322.45.409.2]Ipsi Azimuth (deg)
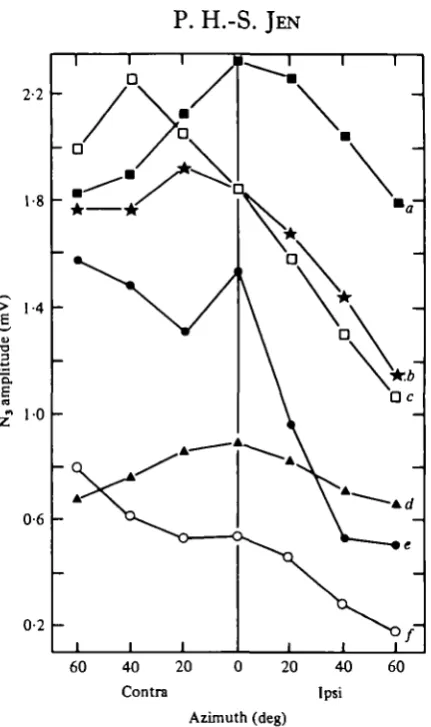
Fig. 2. Relationship between stimulus direction and the amplitude of six representative Nt
potentials (a-fj. The best frequency (kHz) and stimulus level (dB SPL) used to obtain these plots were: (a) 33-5, 91; (6) 45, 95; (c) 41, 95; (d) 44-8, 92; (e) 44-1, 94; (/) 41-5, 84.
the azimuthal angle at which the lowest threshold was obtained is called the best angle. Similarly, the angle at which the highest threshold was obtained is called the worst angle. The difference in threshold between the best and worst angles ranged from
16 to 34 dB with an average of 25 dB.
For the group with a best angle between 20° and 400 contralateral, the worst angle was 6o° ipsilateral. The rate of change of threshold between best and worst angles was 0-15-0-5 dB/degree with an average of 0-3 dB/degree. This value is greater than that for cochlear nuclear neurones but smaller than that for inferior collicular neurones (Grinnell, 19636; Suga, 1964). For the front-sensitive group, the average rate of change in the threshold between the front (o°) and the worst angle (60° contralateral or 60° ipsilateral) was 0-22 dB/degree.
(b) Effect of stimulus direction upon N3 amplitude. In these experiments, the BF's of
100 14
80 10
-0-6
02
115 08
-- 95
- 75
- 55
- 35
- 40
60 40 20 0 20 40 60 Contra Ipsi
[image:5.451.56.402.49.450.2]60 40 20 0 20 40 60 Contra Ipsi Azimuth (deg)
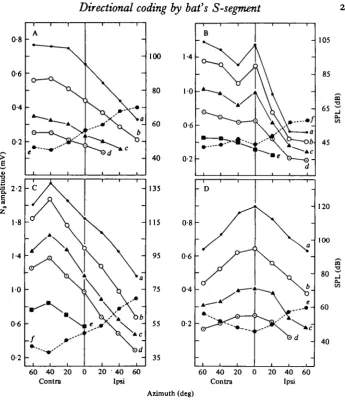
Fig. 3. Relationship of stimulus direction to amplitude (solid lines) and to threshold (dashed lines) for four monotonic N, potentials (A-D). For (A), best frequency was 45 kHz, and to study effect on amplitude, stimulus level was 95 (a), 85 (6), 75 (c) and 65 (d) dB SPL. For (B), BF was 41 kHz and stimulus level was 94 (a) 84 (6), 74 (c), 64 (d), and 54 («) dB SPL. For (C), BF was 41 kHz, stimulus level was 95 (a), 8s (b), 77 (c), 70 (d) and 59 («) dB SPL. For (D), BF was 47-7 kHz and stimulus level was 92 (a), (b), 73 (r) and 63 (d) dB SPL.
The N3 potentials fell into three categories. In one, maximum amplitude was observed with contralateral stimulation (89 impalements; 78%) (Fig. zb, c,f). In the second, the maximum was found with stimulation at the front (20 impalements; 18%) (Fig. 2 a, d). In the third group (5 impalements; 4%), maximum amplitude occurred at two stimulus angles - one contralateral and the other either ipsilateral or at the front (Fig. ze).
208
P. H.-S.
JEN- 40
40 20 0 20 40 60 Contra Ipsi
Azimuth (deg)
Fig. 4. Relationship of stimulus direction to amplitude (solid lines) and to threshold (dashed lines) for one non-monotonic N,. BF was 41-5 kHz and stimulus level was 94 (a), 84 (A), 74 (c), 64 (d), 59 (e) and 54 (/) dB SPL.
at which there was the lowest stimulus threshold (Fig. 3, dashed lines). When there was a non-monotonic response, the angle of maximum amplitude was altered by stimulus level (Fig. 4), and this angle was not always the same as the angle with the lowest threshold (Fig. 4, dashed lines).
The shape of the direction: amplitude plots did not show any significant correlation with the value of the BF, unlike in previous studies (Grinnell, 1963 b; Shimozawa et al.
(c) Effect of stimulus direction upon the threshold of S-segment units. The threshold of the units was denned as the minimum stimulus level which evoked o-1-0-2 impulses per stimulus. Among 19 neurones whose BF's were between 40 and 80 kHz, 12 (63 %) had their best angles at 20-600 contralateral (Fig. 1 B, a-c,f), and 7 (37%) had their best angles at 20-400 ipsilateral (Fig. 1B, d, e). These results are very similar to those obtained from inferior collicular neurones (Grinnell, 19636).
The difference in threshold between the best and worst angles was 15-35 dB with an average of 25-2 dB. The rate of change in threshold over this range was 0-15-0-56 dB/degree with an average of 0-32 dB/degree.
(d) Effect of stimulus direction upon latency of S-segment units. The latency of single
=r 10
6
4
-60 40 20 0 20 40 60
[image:7.451.99.335.47.329.2]Contra Ipsi Azimuth (deg)
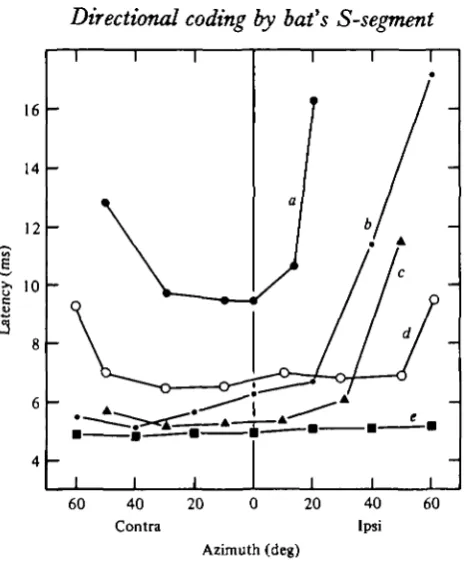
Fig. 5. Relationship between stimulus direction and latency for five representative single units. The frequency (kHz) and stimulus level (dB SPL) used for each measurement were 420, 92 (a); 61 o, 91 (6); 65-6, 95 (c); 45-5, 92 (rf); and 47^5, 92 (e).
unit's BF, at the loudest available level, 85-100 dB SPL (depending upon the BF of each investigated unit).
Among the 10 units studied, 2 exhibited their shortest latencies when the sound was presented directly in front of the bat (Fig. 5 a). Their latencies became very long when measured beyond io° and 200 ipsilateral or 300 and 40° contralateral. One unit (Fig. 5e) maintained almost a constant latency regardless of the position of the loudspeaker. The latency of another unit (Fig. $d) fluctuated only slightly within the range of 500 contralateral and 500 ipsilateral. Beyond that, its latency sharply increased by more than 2 ms. The remaining six units (Fig. 56, c) had their shortest latencies increased sharply when the sound was delivered beyond 20° ipsilateral.
Comparable results have been obtained from inferior collicular neurones of a cat (Erulkar, 1959) and a bat (Grinnell, 19636).
(e) Effect of stimulus direction upon the number of impulses of S-segment units. The stimulus amplitude was always 10-20 dB above the threshold when measured at the front. Among 45 units, the mean number of impulses per stimulus pulse was greatest when stimulation was: (a) contralateral (n = 15; 33%) (Fig. 6d, e); (b) ipsilateral (n = 5; 11 %) (Fig. 6c); (c) at the center (n = 10; 22%) (Fig. 6b,g);(d) at two angles
(n = 11; 25 %) (Fig. 6/, h); (e) over a wide range of angles (n = 4; 9%) (Fig. 6a).
2 1 0
14
10
o
_ •
-60
P. H.-S.
JEN40 20 Contra
0 20 40
Ipsi
60 60
Azimuth (deg) 40 20
Contra
0 20 40
Ipsi
[image:8.451.57.388.44.278.2]60
Fig. 6. Relationship between stimulus direction and the number of impulses per stimulus pulse for eight single units. The frequency (kHz) and stimulus amplitude (dB SPL) used for each measurement were: 720, 90 (a); 75 o, 91 (6); 8o-o, 91 (c); 8o-8, 91 (d); 72-4, 90 (e); 60-2,8g(f); 58-8, 91 (g); and 65-2, 90 (A).
s
•a
SP
L
75
65
55
45
I I I I
" A
-1 I I I
I I I
-1 -1 -1
60 40 20 0 20 40 60
Contra Ipsi
Azimuth (deg)
o
10 30 50 70 90 110 130 SPL (dB)
2
-D. E
o
60 40 20 0 20 40 60
Contra Ipsi Azimuth (deg)
[image:8.451.56.387.334.592.2]20
10
CO
1
- 1 0
- 2 0
70
60
50
40
_ A
N" 15
H 1
/ = 33-5-490 kHz
60 40
Contra
20 0
Azimuth
20
(deg)
40 Ipsi
60
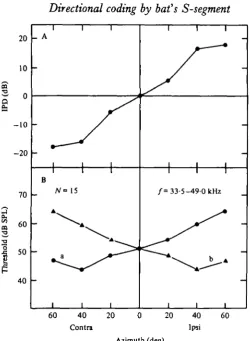
Fig. 8. (A) Relationship between stimulus direction and interaural pressure difference (IPD) was calculated from the mean values of observed thresholds for 15 N, potentials (B, a) by subtracting 'mirror-image' values (B, b). See text.
contralateral (Fig. 7A). With stimulus strength at 64-10 dB higher than the threshold at o° (Fig. 7A) - the angle for maximum discharge was o° (Fig. 7B, a); with stimulus strength at 69 dB, the angle was 40° ipsilateral (Fig. 7B, b).
The observed effects of stimulus strength upon the angle for maximum discharge (Fig. 7B) can be predicted on the basis of the direction:threshold plot (Fig. 7A) and the number of impulses obtained at different signal levels (at the BF) delivered at o° (Fig. 7C). For a signal strength of 69 dB, a mean value of 5-3 impulses per stimulus pulse was observed (Fig. 7C, x). From 7 A it can be predicted that such a stimulus would produce the same effect as a stimulus 5 dB lower, at 20° contralateral. Such a level, 64 dB, produces 7-0 impulses per stimulus pulse at o° (Fig. 7C, y). Hence a 64 dB pulse at 200 contralateral can be predicted to produce 5-3 impulses on average. By this procedure, the points of Fig. 7D (a) were calculated for a 64 dB stimulus level, and those of Fig. 7D (b) for 69 dB. These plots are similar to the experimental results (Fig. B).
(f) Effect of stimulus direction upon interaural pressure difference {IPD). IPD values at
[image:9.451.87.338.48.390.2]2 1 2
P. H.-S.
JEN 12 10 8 6 4 2 0 « 18 3 1$ 14£ 10
-E o .
i'
z 2 0 12 10 8 6 -•hi:i:i:r.i:i:i.i:i
:
• A •M-l-M 1 • 1 1*1*1 1 1 1 1 1 I 1 1
fx
QXE
;
El EX D EE
i i i H i i n i i
-• • A t • • A •i«l«l« l A
[1
1 1 1 1 1 1 1 1 1
0°
i FFFI i i i n n m
... . 1 • 1 • • • • • • • •
F
* *
•*
1.
20° Contrar.j fTi p i FT] 4r- rr
2
0
3 4 5 6 7 8 9 10 11 12
Minimum detectable azimuth angle (deg) 13 14 15
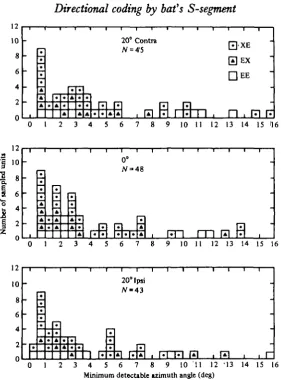
Fig. 9. Distributions of the minimum detectable change in stimulus direction as determined by variation in N, amplitude. XE, EX and EE represent those N, potentials whose maximum amplitude appeared at 20-40° contralateral, 20-40° ipsilateral and at the front, respectively.
potentials with their best angles at 400 contralateral, and BF's ranging from 33-5 to 49-0 kHz (Fig. 8B, a). Assuming sagittal symmetry of the auditory system, the IPD plot was obtained by a subtraction of the values of Fig. 8 B (a) from their ' mirror-image' values (Fig. 8B, b). The IPD changed linearly with azimuth between o° and 40° at a rate of 0-4 dB/degree.
Coding of the minimum detectable change in stimulus direction
12 10 8 6 4 2 20° -A A
[image:11.451.80.362.48.429.2]1 • 1 • 1
A| |A|A
Contra
i R
El
1 1*1 1 1 ,
FJ
H
D
n
XE EX EE I Fl-F
0 1 2 3 4 5 6 7 8 9 10 11 12 13 14 15 1612 10
-1 »
I «
2 -• • • • * A A A • • • • • A A A * • • A A • • A1 1 1 I 1 • l 1 l 1 • I
0° N=>48
m
6 - T r m
1 2 3 4 5 6 7 8 9 10 11 12 13 14 15 16
1 1 1 1 1 • A • • • • • A A • i • • A •
1 1 1 1 1 1 1 1 1 1 1 1
20°Ipsi
N-43
1 n
:
Fi n
1 | . | . | A | |.|A| , | . | M |A| , |A| , , r
12
10
8
6h H
4
2 | - <
o
l 11 II I 1*1 I i
I»I»|A|rtil , frn
0 1 2 3 4 5 6 7 8 9 10 11 12 13 14 15 16 Minimum detectable azimuth angle (deg)
Fig. io. Distributions of the minimum detectable change in stimulus direction as determined by variation in the mean discharge rate of single units. XE, EX and EE represent those units whose maximum discharge rates appeared at 20-40° contralateral, 20—40° ipsilateral and at the front.
the animal is apparently interested in processing echoes returning within this range owing to the forward position of its ears. Sound stimuli, 10-20 dB above the thresholds of investigated Ns potentials or single units, were swung through these three angles in such directions that the stimulus effects on thresholds were similar in all measure-ments.
Data were obtained from 78 N3 potentials and 48 single units. The standard deviations of each mean recorded value were always less than 10% of the mean.
At each of the three angles studied, percentages of the N3 potentials which could code an azimuthal difference of less than 50 are 90% at 200 ipsilateral, 84-5% at o° and 79% at 200 contralateral. Those which could code an azimuthal difference of less than 30 are 7 5 7 % at 200 ipsilateral, 64-1% at o° and 51-6% at 20° contralateral (Fig. 9).
214 P. H.-S.
JENless than 50 at 20° ipsilateral, 70-8% at o° and 69% at 200 contralateral. Furthermore, percentages of single units which could code an azimuthal difference of less than 30 are 60-5% at 20° ipsilateral, 58-3% at 0° and 47% at 200 contralateral (Fig. 10).
DISCUSSION
Binaural neurones of S-segment
The majority of the recordings from the S-segment showed neural responses that were most sensitive to stimuli at 20-400 ipsilateral or contralateral. The neurones underlying these responses may be comparable to the El neurones of Rhinolophus
ferrumequinum, which receive excitation inputs from one ear and inhibitory inputs
from the other (Schlegel, 1977). The responses with a best angle of o° would appear to indicate neurones excited by both ears, like the EE neurones of R. ferrumequinum (Schlegel, 1977).
Directional sensitivity of S-segment
When a sound source is moved around the head of an animal, there is a change in both the interaural pressure difference (IPD) and interaural time difference (ITD) because of the proportional change in the amount of head shadowing and the change in the lengths of the pathways along which the sound waves must travel before arriving at the two ears. In terms of variations in threshold of cochlear nuclear neurones, the amplitude of a sound of 40—60 kHz is attenuated by about 20 dB when it is moved from ipsilateral to 400 contralateral (Grinnell, 19636; Suga, 1964).
If binaural interaction were to occur in the S-segment, one would expect a difference in threshold of N3 potentials or S-segment units between the best and worst angles to be larger than that of the primary auditory neurones. This was demonstrated in the present study, for a sound of 38-50 kHz at 400 contralateral became 25 dB weaker when measured at 400 ipsilateral. Lowering the sound amplitude by 25 dB would change the latency of response and discharge rate of single unit activity (Jen, 1978). Furthermore, as the sound is moved around the animal's head, the proportional change in IPD would cause bilateral differences in the population and number of impulses of activated neurones. All these anticipated changes in neural responses are reflected by the results of the present study (Fig. 1-6) in which the amplitude and threshold of N3 as well as threshold, latency and discharge rate of single units did change with the movement of the sound source.
The mean discharge rates of single units changed as a function of sound location (Fig. 6). This may be due to changes in IPD or ITD as the sound moves from one location to another. A similar effect has been found with cat collicular neurones (Leiman & Hafter, 1972; Bock & Webster, 1974).
Coding of directional information
The minimum detectable azimuthal angle which could be significantly coded at a 95% correct level was Ies9 than 5° in about 70% of the S-segment neurones studied. About two-thirds of that 70 % could even code an azimuthal difference of as small as 30.
For each neurone in the right S-segment of a given capacity to code a difference in stimulus angle, there must be a neurone in the left S-segment with a corresponding coding capacity. If the outputs from corresponding El neurones receiving inhibitory signals from the contralateral ear and excitatory inputs from the ipsilateral ear are compared by some higher-order neurones (von Be'ke'sy, 1930, i960; van Bergeijk, 1962), the coding capacity should be theoretically doubled. Thus based on the present data, a bat could easily detect an azimuthal difference as small as 1-5°. Furthermore, the detection of a difference in stimulus direction even as small as 0-25° by a bat should be possible.
If one assumes the minimum detectable IPD of a Myotis bat is 0-5 dB (Shimozawa
et al. 1974), then, based on the present data, the bat should be able to detect a 1-25°
azimuthal difference around the median plane because the slope of the IPD curve around the midline was 0-4 dB/degree for a 33-5-49-o kHz sound (Fig. 8). A similar value has been suggested by others (Grinnell, 19636; Shimozawa et al. 1974; Schlegel, 1977) and calculated for Phyllostomus hastatus (Harrison & Downey, 1970).
This paper is based upon a Ph.D dissertation submitted to the Department of Biology, Washington University, St Louis (20 April 1974). The preparation of the paper is under the support of the National Science Foundation (research grant BNS-77-23834). I want to thank Professor Suga for his guidance during this research and his comments on this paper. Thanks also go to Drs Gerhardt and Pollak for reading this manuscript and the secretarial assistance of Ms Anita Shaw and Ms Charla Long.
REFERENCES
BEKESY, VON G. (1930). Zur Theorie des Hflrens: Ober das Richtungsh6ren bei einer ZeitdifTerenz oder Lautstarkenungleichheit der beiderseitigen Schallein-wirkungen Physik, 2, 31, 824-835, 857-868.
BsKfeY, VON, G. (i960). Experiments in Hearing, pp. 272-301, New York: McGraw-Hill.
BEHGEIJK, VAN, W. A. (1962). Variation on a theme of Bekesy: a model of binaural interaction. J.
Acoutt. Soc. Am. 34, 1431-1437.
BOCK, G. R. & WEBSTER, W. R. (1974). Coding of spatial location by single units in the inferior colliculus of the alert cat. Exp. Brain Res. 21, 387-398.
ERULKAR, S. D. (1959). The responses of single units of the inferior colliculus of the cat to acoustic stimulation. Proc. R. Soc. Lond. B, 150, 336—355.
GOLDBERG, J. M. & BROWN, P. B. (1968). Functional organization of the dog superior olivary complex: an anatomical and electrophysiologicaJ study. J. Neurophysiol. 31, 639—656.
GRIFFIN, D. R. & GALAMBOS, R. (1941). The sensory basis of obstacle avoidance by flying bats. J'. exp.
Zool. 86, 481-506.
GRIFFIN, D. R. (1944). Echolocation by blind men, bats and radar. Science, N.Y. 100, 589-590. GRIFFIN, D. R. (1958). Listening in the Dark Yale University Press, reprinted Dover, 1974.
GRINNELL, A. D. (1963a). The neurophysiology of audition in bats: Intensity and frequency para-meters. J. PhysioL, Lond. 167, 38-66.
2i6 P. H.-S.
JENGRINNELL, A. D. & GRINNELL, U. S. (1965). Neural correlates of vertical localization by echolocatirn bats. J. Phyriol., Lond. 181, 830-851.
GRINNELL, A. D. & HAGIWARA, S. (1972). Adaptations of the auditory system of echolocation: Studies of New Guinea bats. Z. vergl. Physiol. 76, 41-81.
HARRISON, J. M. & DOWNEY, P. (1970). Intensity changes at the ear as a function of the azimuth of a tone source: A comparative study. J. Acoust. Soc. Am. 47, 1509—1518.
HARRISON, J. M. & FELDMAN, M. L. (1970). Anatomical aspects of the cochlear nucleus and superior olivary complex. In Contributions to Sensory Physiology (ed. D. Neff), vol. 4, pp. 95-143. New York: Academic Press.
IRVING, R. & HARRISON, J. M. (1967). The superior olivary complex and audition; a comparative study.
J. comp. Neurol. 130, 77-86.
JEN, P. H.-S. (1978). Electrophysiology properties of auditory neurones in the superior olivary complex of echolocating bats. J. comp. Physiol. 128, 47-56.
LEIMAN, A. L. & HATTER, E. R. (1972). Responses of inferior colliculus neurons to free field auditory stimuli. Expl. Neurol. 35, 431-449.
MASTERTON, R. B. (1974). Adaptation for sound localization in the ear and brainstem of mammals.
Fedn Proc. 33, 1904-1910.
MASTERTON, R. B. & DIAMOND, I. T. (1967). Medial superior olive and sound localization. Science, N. Y. I55> 1696-1697.
MILLS, A. W. (i960). Lateralization of high-frequency tones. J. Acoust. Soc. Am. 3a, 132-134. NEUWEILER, G. (1970). Neurophysiologische Untersuchungen zum Echoortungssystem der Grossen
Hufeisennase Rhinolophus ferrumequinum (Schreber, 1774). Z. vergl. Physiol. 67, 273-306. PAPEZ, J. W. (1930). Superior olivary nucleus: its fiber connections. A.M.A. Arch. Neurol. Psychiat.
M, 1-20.
RASMUSSEN, G. L. (1946). The olivary peduncle and other fiber projections of the superior olivary complex. J. comp. Neurol. 84, 141-219.
SCHLEGEL, P. (1977). Directional coding by binaural brainstem units of CF-FM bats, Rhinolophus
ferrumequinum. J. comp. Physiol. 118, 327-352.
SHIMOZAWA, T., SUGA, N., HENDLER, P. & SCHUETZE, S. (1974). Diiectional sensitivity of echolocation
system in bats producing FM signals. J. exp. Biol. 60, 53—69.
STEVENS, S. S. & NEWMAN, E. B. (1936). The localization of actual sources of sound. Am.J. Psychol. 53,
3*9-353-STOTLER, W. A. (1953). An experimental study of the cella and connections of the superior olivary complex of the cat. J. comp. Neurol. 98, 401-431.
SUCA, N. (1964). Single unit activity in cochlear nucleus and inferior colliculus of echolocating bats.
J. Physiol., Lond. 172, 449-474.