1043
MS
Magnetization Transfer Histogram Analysis of
Monosymptomatic Episodes of Neurologic Dysfunction:
Preliminary Findings
Jacqueline S. Kaiser, Robert I. Grossman, Marcia Polansky, Jayaram K. Udupa, Yukio Miki,
and Steven L. Galetta
BACKGROUND AND PURPOSE: Patients presenting with a monosymptomatic episode of
neurologic dysfunction (MEND) have a high probability of developing multiple sclerosis (MS).
Our study was designed to determine whether magnetization transfer (MT) histogram analysis
could predict the development of MS for a cohort of patients presenting with a MEND.
METHODS: Eleven patients with a MEND and 21 age-matched control volunteers underwent
MR imaging. Six patients underwent serial MR examinations. MT ratio histogram peak height
(MTRHPH) and the location of the MT ratio histogram peak (LOC MTRHP) were determined
for patients and control volunteers. T2 lesion volume was also calculated. Patients were
clini-cally followed up for 587
6
308 days to determine or rule out the development of MS.
RESULTS: Three patients went on to develop MS. There was no statistically significant
difference in the MTRHPH (P
5
.65) and the LOC MTRHP (P
5
.71) between patients and
control volunteers. For those patients who underwent multiple examinations, no statistically
significant differences in the MTRHPH (P
5
.64), LOC MTRHP (P
5
.58), and T2 lesion volume
(P
5
.47) were seen. There were no statistically significant correlations between any of the
parameters studied.
CONCLUSION: We found no difference in MT histogram parameters among control
vol-unteers, patients with a MEND without MS, and patients with a MEND who went on to a
diagnosis of MS. Our preliminary findings suggest that there may not be a substrate of disease
in the normal-appearing white matter that is predictive of the development of MS.
Based on clinical experience, MR imaging is the
best ancillary test to show cerebral abnormalities
in patients with clinically definite multiple sclerosis
(MS), 95% of whom have lesions revealed by MR
imaging (1). This number probably underestimates
the sensitivity of MR imaging in that it does not
include spinal cord imaging. Combined brain and
spinal cord imaging can increase the sensitivity of
MR imaging to almost 100% (2). MR imaging
cri-teria for the diagnosis of MS have been proposed
Received June 1, 1999; accepted after revision January 10, 2000.
Presented at Annual Meeting of the Radiological Society of North America; November 1998; Chicago, IL.
Funded in part by the National Institute of Neurological Dis-orders and Stroke, National Institutes of Health Grants NS37172 and NS29029.
From the Department of Radiology, University of Pennsyl-vania Medical Center, Philadelphia, PA.
Address reprint requests to Robert I. Grossman, MD, Neu-roradiology Section, Department of Radiology, University of Pennsylvania Medical Center, 3400 Spruce Street, Philadelphia PA 19104.
qAmerican Society of Neuroradiology
based only on conventional proton density– and
T2-weighted images (1, 3).
There are many reports indicating that
magneti-zation transfer (MT) imaging is even more
sensi-tive than conventional MR imaging for detecting
the presence of MS lesions (4, 5). Abnormal MT
ratio (MTR) values have been shown not only in
plaques visible on conventional MR images but
also in normal-appearing white matter (NAWM) (4,
6–8). The abnormal MTR values in the NAWM
have been attributed to microscopic disease (6, 9,
10). MTR values have previously been determined
using 2D regions of interest (4–8, 11). This method
evaluates the disease status of tissues locally,
be-cause it is determined from the voxel values within
these regions. Although this is a satisfactory
meth-od for the detection of local disease processes or
the interrogation of individual lesions, it cannot
quantitate global disease burden in a diffuse or
multifocal disease such as MS.
dis-ease that could be detected by MTR histogram
analysis. Our hypothesis was that, using MTR
his-togram analysis, we would be able to detect disease
in the brains of patients with a MEND who
even-tually went on to a diagnosis of MS (9, 10, 12).
Our aim was also to differentiate those patients
with a MEND who went on to a diagnosis of MS
as defined by the Poser criteria from those patients
with a MEND who did not develop MS (13) by
using the MTR histogram peak height (MTRHPH).
Although several studies using MTR histogram
analysis have been reported in the literature (9, 10),
to our knowledge, this is the first report of an MTR
histogram analysis of patients with a MEND.
Additionally, we investigated whether MT would
be more prognostic than T2 lesion volume for
pre-dicting the development of MS in the same cohort
of patients presenting with a MEND, considering
that MT is considered to be an extremely sensitive
technique for quantitation of global disease burden.
Methods
Our patient cohort consisted of 11 patients (seven women and four men; age range, 23–51 years; mean age, 35.1 years) with a MEND. All patients were recruited from the Compre-hensive Multiple Sclerosis Center at our institution and were under the care of a neurologist specializing in MS. An age-matched control group of 21 healthy volunteers (10 women and 11 men; age range, 28–61 years; mean age, 38.9 years) also underwent examination. Those with a medical history of systemic or neurologic disease were excluded from the study. A second cohort, consisting of six of the 11 patients from the first cohort, were followed longitudinally by serial MR and clinical examinations. Three patients underwent three MR ex-aminations each, and three patients underwent two examina-tions each. In these patients, the interval between the first and last MT and T2-weighted studies varied from 169 days to 906 days (mean time, 292 days 6 106 days). All patients were followed up clinically. Written informed consent was obtained from each participant entering the study. Additionally, the in-stitutional review board approved the study.
All MR examinations (17 for patients and 21 for control volunteers) were performed on the same 1.5-T system (Signa; GE Medical Systems, Milwaukee, WI) with a quadrature trans-mitter/receiver head coil. After obtaining sagittal localizer T1-weighted spin-echo images of the whole brain (600/11/1 [TR/ TE/excitations]), 3-mm contiguous axial fast spin-echo images of the whole brain (2500/16280/1) were acquired with a 256 3192 matrix and a 22-cm field of view. Using MT parameters previously established by other investigators, unenhanced axial MT images were obtained (4, 5). A standard 3D gradient-pulse sequence (106/5/1, flip angle of 128) with a 2563128 matrix and a 22-cm field of view was used. MT images were obtained by the application of 19-ms single-cycle, sinc-shaped satura-tion pulses before each excitasatura-tion. The RF pulses had an av-erage field intensity of 3.67 3 1026 T (156 Hz) and were
applied at a frequency of 2 kHz below the resonance of water (14). The interval between the end of the saturation pulse and the beginning of each excitation was approximately 1 ms. Five-millimeter-thick axial images at similar intervals were also obtained without the saturation pulses but with otherwise identical imaging parameters.
All image data were transferred from the imager directly to a Sun Sparc 20 (Sun Microsystems, Mountain View, CA) workstation (four processors, 256 MB RAM) via the picture archiving and communications system of the radiology de-partment. An internal version of the 3DVIEWNIX software
system, which has been previously described by Udupa et al (15, 16) and Samarasekera et al (17), was used to measure T2 lesion volume. The operator initially defined CSF, white matter, and gray matter using long recovery time/short echo time as well as long recovery time/long echo time MR images. The software automatically then selected and delineated potential lesion sites, using a method based on a theory of ‘‘fuzzy con-nectedness’’ (18). The operator subsequently determined which were the ‘‘true’’ lesions among the computer-detected potential lesions. The T2 volume of the lesions was then computed by summation of the volume of the lesions accepted by the op-erator. Our algorithm used to quantitate T2 volumes has been reported to have an intraobserver and interobserver coefficient of variation of 0.9% and a false volume fraction of 1.3% (15). All operator input needed for T2 volume estimation was pro-vided by the same person (J.S.K.), who was blinded to whether the patients had developed MS by the time of clinical follow-up.
The volume of CSF and brain parenchyma were also as-sessed using 3DVIEWNIX software. After an operator speci-fied sample points of CSF, white matter, and gray matter, the extracranial contents were segmented. CSF, white matter, and gray matter were then segmented, with each being treated as a fuzzy-connected 3D object containing the above-specified points (16). An operator then reviewed all the segmented sec-tions, and any remaining extracranial contents were excluded. The amount of MT was quantitated by calculating the MTR. The MTR, defined as the percentage of signal loss between otherwise identical images obtained with and without satura-tion, was calculated by using the following equation (4):
MTR5[(Mo2M )/M ]s o 3100%,
where Moand Msrepresent the signal intensity of a voxel in the image obtained for the same patient and for the same ac-quisition without and with saturation, respectively.
The 3DVIEWNIX software system was then used to seg-ment the whole brain parenchyma from the MT images and to generate a histogram of the pixel intensity from the MTR maps of only the whole brain. To compare the MTRHPHs of patients and control volunteers with different brain volumes, the MTRHPHs were normalized by dividing the peak height of the MTR histogram by the total number of voxels in the brain parenchyma. In the subsequent discussion, we refer to the nor-malized whole-brain MTRHPH as MTRHPH. The algorithms used for generating the whole-brain MTR histograms have been previously described in detail by van Buchem et al (9).
The MTR histogram parameters of patients and control vol-unteers were compared using a Wilcoxon ranked sum test for independent samples; P values of less than .05 were considered to represent a significant difference in results between patients with a MEND and control volunteers. Both the patient and control groups were evaluated retrospectively to determine whether the groups were matched in terms of age.
The MTRHPH (proportion of pixels at the most common MTR value) reflects the amount of residual normal brain pa-renchyma (9, 10) in that it typically has a narrow peak located at an MTR value of 40% in both patients with MS and normal control volunteers. The narrow peak indicates that most of the brain tissue contains MTR values within a small range. Al-though the MTRHPH in patients with MS is centered near the MTR of normal control volunteers, the average height of the peak in patients with MS is significantly lower because of a relative increase of the number of pixels with lower MTR val-ues that correspond to plaqval-ues and NAWM in patients with MS (4, 10). Considering our assumption that patients with a MEND would be similar to patients with MS, the MTRHPH and the location of the whole-brain MTR histogram peak (LOC MTRHP) were determined for both patients and control volunteers.
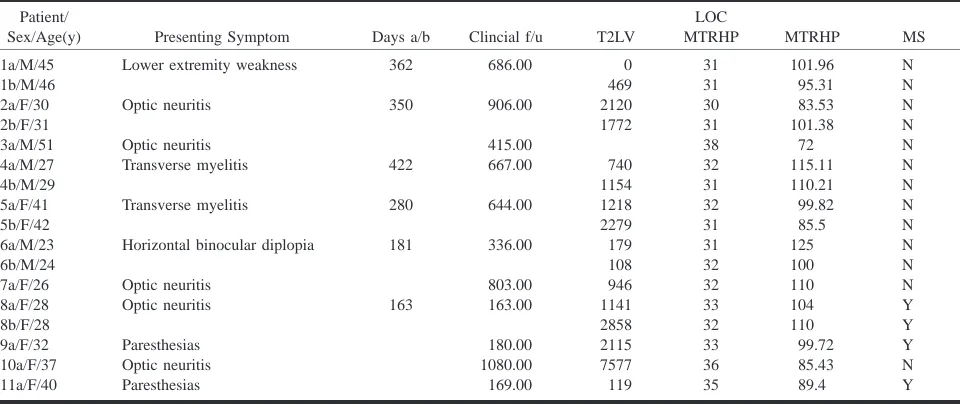
Table 1: MEND patients symptoms and data
Patient/
Sex/Age(y) Presenting Symptom Days a/b Clincial f/u T2LV
LOC
MTRHP MTRHP MS
1a/M/45 1b/M/46 2a/F/30 2b/F/31
Lower extremity weakness
Optic neuritis 362 350 686.00 906.00 0 469 2120 1772 31 31 30 31 101.96 95.31 83.53 101.38 N N N N 3a/M/51 4a/M/27 4b/M/29 5a/F/41 5b/F/42 Optic neuritis Transverse myelitis Transverse myelitis 422 280 415.00 667.00 644.00 740 1154 1218 2279 38 32 31 32 31 72 115.11 110.21 99.82 85.5 N N N N N 6a/M/23 6b/M/24 7a/F/26 8a/F/28 8b/F/28
Horizontal binocular diplopia
Optic neuritis Optic neuritis 181 163 336.00 803.00 163.00 179 108 946 1141 2858 31 32 32 33 32 125 100 110 104 110 N N N Y Y 9a/F/32 10a/F/37 11a/F/40 Paresthesias Optic neuritis Paresthesias 180.00 1080.00 169.00 2115 7577 119 33 36 35 99.72 85.43 89.4 Y N Y
[image:3.612.312.539.352.437.2]* Days a/b (days between first [a] and last [b] MR examinations); clin f/u (time from initial MR examination to final clinical follow-up); T2LV (T2 lesion volume, measured in cc’s); LOC MTRHP (location of magnetization transfer ratio histogram peak); MTRHP (magnetization transfer ration histogram peak); MS (presence [y] or absence [n] of multiple sclerosis at the time of clinical follow-up).
Table 2: Results comparing MTRHP and LOC MTRHP between patients and control subjects*
MTRHP LOC MTRHP
Patients Control subjects
P value
98.7615.3 95.5611.5
.65
33.062.4 32.761.0
.71
[image:3.612.60.287.354.406.2]* The values listed under MTRHP represent the average MTR his-togram peak height within the corresponding group; likewise, the val-ues under LOC MTRHP represent the average location of the histo-gram peak within each group.
Table 3: Results of correlations among the parameters used to evaluate patients and control subjects*
LOC MTRHP
T2LV R5 20.56 (P value5.32)
MTRHP
T2LV R50.00 (P value51.00)
LOC MTRHP MTRHP R50.46 (P value5.35)
* MTRHP (magnetization transfer ratio histogram peak height), LOC MTRHP (location of magnetization transfer ratio histogram peak height), T2LV (T2 macroscopic lesion volume).
six patients who underwent multiple MR examinations, the percentage change per unit time of the MTRHPH, LOC MTRHP, and T2 lesion volume was also made between the first and the last MR examinations. We also examined whether there was a correlation between the MTRHPH, LOC MTRHP, and T2 lesion volume for both the patients and the control volunteers by using Spearman correlation coefficients.
Results
Table 1 lists the patient examinations along with
the details pertaining to symptoms, acquisition
times, and the disease parameters computed from
the images. There was no statistically significant
difference in age between the patients and the
con-trol volunteers. The mean value of age was 35.1
6
8.8 years (mean
6
SD) for the 11 patients with a
MEND and was 38.90
6
10.0 years for the control
volunteers. There was also no statistically
signifi-cant difference in the MTRHPH (P
5
.65) and the
LOC MTRHP (P
5
.71) between the patients and
the control volunteers (Table 2). Although limited
by a small sample size, our preliminary results
show that for those patients who underwent
mul-tiple MR examinations, no statistically significant
differences were seen over time in the MTRHPH
(P
5
1.00), LOC MTRHP (P
5
.81), and T2 lesion
volume (P
5
.44).
There were no statistically significant differences
between patients and control volunteers regarding
any of the parameters (MTRHPH, LOC MTRHP,
and T2 lesion volume) at the time of the initial MR
examination (Table 3) or at the subsequent MR
ex-aminations of those patients entered in the
longi-tudinal part of the study.
Three of the 11 patients went on to a diagnosis
of MS as defined by the Poser criteria (13). A
sta-tistical analysis comparing patients with a MEND
who went on to develop MS and patients with a
MEND who did not go on to develop MS was not
performed. There would not have been enough
sta-tistical power for a meaningful result considering
that only a few patients in our study went on to
develop MS. No obvious differences were seen,
however.
Discussion
MEND. New lesions identified on MR images
more than 1 month after the initial clinical
presen-tation indicate clinically probable MS according to
the Poser criteria (13). More recently, Barkhof et
al (19) suggested that the presence of juxtacortical
lesions and contrast-enhanced lesions among
pa-tients with monosymptomatic neurologic
dysfunc-tion are highly specific prognostic factors for
pro-gression to MS. Those patients presenting with
isolated acute syndromes and normal MR images
of the brain are at a lower risk of progressing to
MS (20, 21). The presence and number of lesions
on MR images of the brain markedly increase the
risk of progression to MS, not only in cases
pre-senting with optic neuritis but also in cases of
iso-lated spinal cord and brain stem syndromes (20–
26). In the Optic Neuritis Treatment Trial, only
16% of patients with optic neuritis and normal MR
images went on to develop MS as compared with
51% of patients with optic neuritis and abnormal
MR images at symptom onset (21). Moreover,
Miller et al (27) found that progression to MS
oc-curred in 42% of patients with isolated spinal cord
dysfunction and in 57% of patients with isolated
brain stem manifestations. Thus, MR imaging
serves as a powerful predictive tool for determining
the risk of MS among patients presenting with a
MEND (20, 22).
Our sample size may be too small from which
to reach any definitive conclusions; a larger number
of patients may be necessary to verify our
hypoth-esis because of the possible subtle changes.
Nev-ertheless, our preliminary results show no
statisti-cally significant difference in MT histogram
parameters (ie, the MTRHPH and the LOC
MTRHP) among control volunteers, patients with
a MEND without MS, and patients with a MEND
who developed MS. These findings suggest that
there may not be an initial substrate of diffuse
dis-ease in individuals with a MEND; specifically, our
patient cohort with monosymptomatic disease does
not seem to have a diffuse low-level lesion base on
MT histograms. Moreover, the initial disease
bur-den as assessed by the initial T2 lesion volume did
not correlate with the development of MS.
Addi-tionally, no significant correlations were seen
be-tween the development of MS and the three
param-eters (MTRHP, location of MTRHP, and T2 lesion
volume) evaluated.
Our preliminary results of the three of 11
pa-tients with a MEND whose conditions evolved to
MS show that no predictive features could be
de-tected by our methodology. Possible limitations of
our study include the notion that whole-brain MT
imaging using MTR histogram analysis may not be
sensitive enough for detecting diffuse subtle
chang-es in the NAWM. Alternatively, minimal
micro-scopic disease may be focal and overwhelmed by
the whole-brain MTR histogram approach. Other
methodologies, including proton spectroscopy, may
provide increased sensitivity in this important
co-hort of patients.
The mean interval between the first and last MR
examinations of patients who underwent multiple
MR examinations was 292
6
106 days; this may
have been too short a period during which to detect
progressive changes in patients with a MEND. van
Buchem et al (10) found a decrease in MTRHP in
their cohort of seven patients studied
longitudinal-ly, and they proposed that the MTRHP could be
used as a volumetric tool that is sensitive to
dif-ferences in global lesion load occurring in a
rela-tively short period of time. These patients,
how-ever, were studied over a longer period of 25
months (approximately 760 days). Moreover, in a
study by Lacomis et al (28), T1 times were
pro-longed in NAWM for patients with clinically
di-agnosed MS of at least 5 years’ duration.
Never-theless, this finding was not observed among
patients with MS of less than 5 years’ duration.
Because all the patients in our study were followed
for less than 5 years, changes in the NAWM may
not have been apparent during the shorter interval
of this study.
The mean time between the first MR
examina-tion and the final clinical follow-up for patients
who did not develop MS was 692
6
244 days (or
587
6
308 days if patients who developed MS are
included). This interval may be too short a period
to detect which patients will develop MS. In a
study by Filippi et al (22), more than three-quarters
of their patients with a MEND who developed MS
did so during the first 2 years. Likewise, Cohen et
al (29) showed that the risk of developing MS for
patients with isolated optic neuritis is higher during
the first 2 years after onset.
Conclusion
In cases of MS, a disease in which clinical signs
and symptoms correspond poorly with the extent
and activity of disease, quantitative data reflecting
the burden of disease would be useful in
under-standing the natural course of the disease and in
the assessment of therapeutic intervention. Our data
indicate that using MR imaging data, such as
whole-brain MT imaging and T2 lesion volume, it
may be difficult to predict which patients with a
MEND will go on to develop MS. This suggests
that MR imaging criteria for entry into therapeutic
trials, before a diagnosis of definite MS has been
established, may result in incorrect characterization
and perhaps unnecessary treatment.
Acknowledgments
We especially thank Lois Mannon for help in recruiting pa-tients for the study.
References
1. Paty DW, Oger JJ, Kastrukoff LF, et al. MRI in the diagnosis of
MS: a prospective study with comparison of clinical evalua-tion, evoked potentials, oligoclonal banding, and CT.
2. Thorpe JW, Kidd D, Moseley IF, et al. Spinal MRI in patients
with suspected multiple sclerosis and negative brain MRI.
Brain 1996;119:709–714
3. Fazekas F, Offenbacher H, Fuchs S, et al. Criteria for an increased
specificity of MRI interpretation in elderly subjects with sus-pected multiple sclerosis. Neurology 1988;38:1822–1825
4. Dousset V, Grossman RI, Ramer KN, et al. Experimental allergic
encephalomyelitis and multiple sclerosis: lesion characteriza-tion with magnetizacharacteriza-tion transfer imaging. Radiology 1992;182:
483–491
5. Hiehle JF, Grossman RI, Ramer KN, Gonzalez-Scarano F, Cohen JA. Magnetization transfer effects in MR-detected multiple
sclerosis lesions: comparison with gadolinium-enhanced spin-echo images and nonenhanced T1-weighted images. AJNR Am
J Neuroradiol 1995;16:69–77
6. Loevner LA, Grossman RI, Cohen JA, et al. Microscopic disease
in normal-appearing white matter on conventional MR images in patients with multiple sclerosis: assessment with magneti-zation-transfer measurements. Radiology 1995;196:511–515
7. Filippi M, Campi A, Dousset V, et al. A magnetization transfer
imaging study of normal-appearing white matter in multiple sclerosis. Neurology 1995;45:478–482
8. Filippi M, Rocca MA, Martino G, Horsfield MA, Comi G.
Mag-netization transfer changes in the normal appearing white matter precede the appearance of enhancing lesions in patients with multiple sclerosis. Ann Neurol 1998;43:809–814
9. van Buchem MA, Udupa JK, McGowan JC, et al. Global
volu-metric estimation of disease burden in multiple sclerosis based on magnetization transfer imaging. AJNR Am J Neuroradiol
1997;18:1287–1290
10. van Buchem MA, McGowan JC, Kolson DL, Polansky M, Gross-man RI. Quantitative volumetric magnetization transfer
anal-ysis in multiple sclerosis: estimation of macroscopic and mi-croscopic disease burden. Magn Reson Med 1996;36:632–636
11. Hiehle JF, Lenkinski RE, Grossman RI, et al. Correlation of
spec-troscopy and magnetization transfer imaging in the evaluation of demyelinating lesions and normal appearing white matter in multiple sclerosis. Magn Reson Med 1994;32:285–293
12. Richert ND, Ostuni JL, Bash CN, Duyn JH, McFarland HF, Frank JA. Serial whole brain magnetization transfer imaging in
re-lapsing-remitting multiple sclerosis patients: natural history and the effect of interferon-1b. AJNR Am J Neuroradiol 1998;
19:1705–1713
13. Poser CM, Paty DW, Scheinberg L, et al. New diagnostic criteria
for multiple sclerosis: guidelines for research protocols. Ann
Neurol 1983;13:227–231
14. McGowan JC, Schnall MD, Leigh JS. Magnetization transfer
imaging with pulsed off-resonance saturation: variation in contrast with saturation duty cycle. J Magn Reson Imaging
1994;4:79–82
15. Udupa J, Odhner S, Samarasekera S, et al. 3DVIEWNIX: an open,
transportable, multidimensional multimodality, multiparame-tric imaging software system. SPIE Proc 1994;2164:58–73
16. Udupa JK, Wei L, Samarasekera S, Miki Y, van Buchem MA, Grossman RI. Multiple sclerosis lesion quantification using
fuzzy-connectedness principles. IEEE Trans Med Imaging 1997;
16:598–609
17. Samarasekera S, Udupa JK, Miki Y, Luogang W, Grossman RI.
A new computer-assisted method for quantification of enhanc-ing lesions in multiple sclerosis. J Comput Assist Tomogr 1997;
21:145–151
18. Udupa JK, Samarasekera S. Fuzzy connectedness and object
def-inition: theory, algorithms, and applications in image segmen-tation. Graph Models Image Processing 1996;58:246–261
19. Barkhof F, Filippi M, Miller DH, et al. Comparison of MRI
cri-teria at first presentation to predict conversion to clinically definite multiple sclerosis. Brain 1997;120:2059–2069
20. Morrissey SP, Miller DH, Kendall BE, et al. The significance of
brain magnetic resonance imaging abnormalities at presenta-tion with clinically isolated syndromes suggestive of multiple sclerosis: a 5-year follow-up study. Brain 1993;116:135–146
21. Optic Neuritis Study Group. The 5-year risk of MS after optic
neuritis: experience of the Optic Neuritis Treatment Trial.
Neurology 1997;49:1404–1413
22. Filippi M, Horsfield MA, Morrissey SP, et al. Quantitative brain
MRI lesion load predicts the course of clinically isolated syn-dromes suggestive of multiple sclerosis. Neurology 1994;44:
635–641
23. Campi A, Filippi M, Comi G, et al. Acute transverse
myelopa-thy: spinal and cranial MR study with clinical follow-up. AJNR
Am J Neuroradiol 1995;16:115–123
24. Tas MW, Barkhof F, van Walderveen MA, Polman CH, Hommes OR, Valk J. The effect of gadolinium on the sensitivity and
specificity of MR in the initial diagnosis of multiple sclerosis.
AJNR Am J Neuroradiol 1995;16:259–264
25. Soderstrom M, Lindqvist M, Hillert J, Kall TB, Link H. Optic
neuritis: findings on MRI, CSF examination, and HLA class II typing in 60 patients and results of a short-term follow-up.
J Neurol 1994;241:391–397
26. Francis DA, Compston DAS, Batchelor JR, McDonald WI. A
re-assessment of the risk of multiple sclerosis developing in pa-tients with optic neuritis after extended follow up. J Neurol
Neurosurg Psychiatry 1987;50:758–765
27. Miller DH, Ormerod IE, Rudge P, Kendall BE, Moseley IF, McDonald WI. The early risk of multiple sclerosis following
isolated acute syndromes of the brainstem and spinal cord.
Ann Neurol 1989;26:635–639
28. Lacomis D, Osbakken M, Gross G. Spin-lattice relaxation (T1)
times of cerebral white matter in multiple sclerosis. Magn
Re-son Med 1986;3:194–202
29. Cohen MM, Lessell S, Wolf PA. A prospective study of the risk