p exp. Biol. (1977), 67, 89-96 8g
With 2 figures Printed in Great Britain
BEHAVIOURAL THRESHOLDS
FOR DIFFUSE ILLUMINATION IN THE
GOLDFISH
BY WILLIAM N. TAVOLGA* Department of Animal Behavior,
American Museum of Natural History, New York and Department of Biology,
City College of the City University of New York
(Received 13 September 1976)
SUMMARY
Thresholds for diffuse, broad-band illumination were obtained for the goldfish (Carassius auratus) by avoidance conditioning. The light source was a television cathode-ray tube whose output was controlled over a range of 140 dB by a combination of 'brightness' control, blanking of scan lines, and neutral density filters. The threshold was calculated in terms of irradiance to be 2-9 x i o ^ / t W cm~2 (± a standard deviation of 1*4). The determination of absolute, rather than relative, values, and the use of overhead, diffuse illumination provided data that would be ecologically and behaviourally relevant.
INTRODUCTION
Behaviour in fishes is highly dependent on vision, especially in such activities as reproduction (Breder & Rosen, 1966) and spatial orientation (Trevarthen, 1968). However, most research on the physiology of vision in fishes has been limited to the study of the eye as a sense organ. Data are available on dark adaptation, pigment physiology, and spectral sensitivity through electrophysiological (Jacobson, 1964; Witkovsky, 1965, 1968), and behavioural techniques (Blaxter, 1968, 1969; Hester, 1968; Yager, 1967, 1968a, b; Muntz & Northmore, 1973). Most of the work has been done on a few species, primarily the goldfish, although dark adaptation and thresholds to monochromatic light were obtained for the cichlid fish Tilapia (Tavolga & Jacobs, 1971).
All of the electrophysiological studies and even the conditioned response methods used a light delivery system that consisted either of light beams projected directly into the eyes or illuminated panels set in front of the head (Northmore & Yager, 1975). On the behavioural level of organization (i.e. in terms of the entire organism functioning adaptively) this is not the way in which a fish (or most other animals) normally obtains visual information. Visual input is normally derived from illumi-nation that is diffuse and that is reflected from the surroundings.
A second feature of most studies on fish vision has been that the quantitative data have been reported only in relative terms (e.g. in logarithmic units of dark adaptation, or relative sensitivity).
The two primary objectives of the present study were to (a) obtain behavioural thresholds for diffuse illumination, and (b) to report these thresholds in objective, physical, terms so as to provide data that would be ecologically relevant.
MATERIALS AND METHODS
The subjects used in this study were seven goldfish (Carassius auratus) of the common 'comet' strain. They were 8 to 9 cm in standard length, and were housed in individual aquaria under naturally cycling illumination.
The psychophysical technique was based on avoidance conditioning similar to that used in hearing studies on fishes (Tavolga & Wodinsky, 1963; Jacobs & Tavolga,
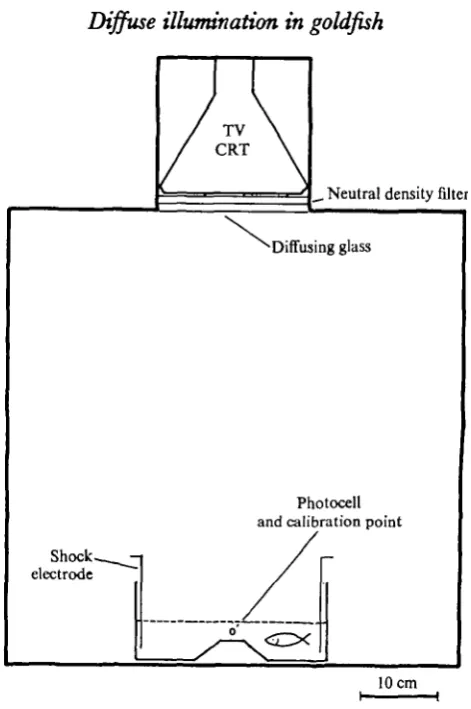
1967, 1968) and also to obtain thresholds for monochromatic light (Tavolga & Jacobs, 1971). The test tank, an aquatic shuttle-box, was enclosed in a light-tight and sound-insulated chamber. The water over the centre hurdle was set high enough so that the fish could swim across, yet low enough to reduce the incidence of intertrial crossings. This activity can be equated with false positive responses. An average of 2 crossings per min of intertrial interval was regarded as tolerable. The trial sequence began with the onset of light, followed after 10 sec (the CS-US interval) by a pulsed electric shock delivered through stainless-steel mesh electrodes at the ends of the tank. The optimum shock level was determined empirically to be 10 V, 60 Hz, in the form of a 10 msec pulse delivered at the rate of 1 pulse sec"1. The shock continued until the fish crossed the hurdle. In doing so, it broke an infra-red light beam to a photocell. This stopped the shock and turned off the light stimulus. As far as can be determined, the infra-red beam had no effect on the behaviour of the fish, and was probably invisible to them. An intertrial period averaging 60 sec followed (range 30 to 120 sec). An 'escape' response was one in which the subject did not cross the barrier in time, and received a shock. An' avoidance' response was one in which the subject crossed the barrier within the allotted CS-US interval. This provided objective evidence that the subject had detected the light. After several days of training, the animals reached a level of reliability adequate for testing (i.e. about 80% avoidances over a session of 25 trials). Fig. 1 is a diagram of the apparatus used.
Light source: its control and calibration
Diffuse illumination in goldfish
9
1TV CRT
_, Neutral density filter
•"Diffusing glass
Photocell
and calibration point
Shock, electrode
10 cm
[image:3.451.107.343.46.401.2]I I
Fig. i. Schematic representation of the test tank (shuttle-box), within the test chamber. The light source is set into the ceiling.
r (A)
at - (B)
- (Q
400 500
Nanometres
600 700
Fig. 2. Graphs of the spectra of sunlight (A) and the light source used here, i.e. the television cathode-ray tube (B). The spectrum of a ' cool-white' fluorescent tube is shown for comparison ( Q . All spectra were obtained through the use of a spectroradiometer, and spectra A and C conform closely to those shown in the RCA Electro-Optics Handbook.
of light. By a combination of brightness adjustment and control of the number of scan lines, a total dynamic range of 4 log units was attained. This range was further expanded by the use of neutral density filters that could be inserted from the outside of the test chamber through a light-tight slit.
Diffuse illumination in goldfish 93
For the present, the values reported here will be given in radiometric rather than photometric terms, since there is no reason to assume that the 'standard human observer' has the same visual capacities as the 'standard fish observer'.
Using the same instruments, the attenuating system of the CRT was calibrated and adjusted over its 4 log unit range. The neutral density filters were separately calibrated. Combinations of these filters were tested with brighter light sources to avoid possible errors resulting from using them together. The filters consisted of 21-5 X28 cm photographic glass plates, exposed and developed, and then tested for uniformity, transmission density and possible spectral effects.
Using the maximum attenuation possible with this system, combining attenuation range of the CRT and the filters, the irradiance level could be attenuated to 2-25 x icr7 /iW cm"2. Since no instruments available were capable of detecting such low light levels, I was forced to rely on an extrapolation based on the measurements and calibrations for the component parts of the attenuation system. Because most of the results provided values in the range of I O ^ / J W cm"2, the units presented here will be picowatts, rather than microwatts (i.e. the fully attenuated light irradiance value given above would become 0-225 pW cm~2).
Threshold techniques
The psychophysical method used here was the common ' up-down' or ' staircase' technique, similar to that of the von B6k£sy audiometer. After each avoidance, the light level was lowered for the next trial, and after each escape (shock trial) the light level was raised. The attenuation steps were along a logarithmic scale. In the initial trials, beginning with the maximum light level, the attenuation steps reduced the CRT light output by a factor of 0-5 after each avoidance. This was done auto-matically by combinations of reduced CRT brightness and reduced number of scan lines. When the limit of this system was attained, the control machine was reset to maximum brightness, a neutral density filter was inserted to correspond with the maximum prior attenuation level, and the trial sequences were resumed. This was repeated, until a level was reached where the subject was alternately avoiding and escaping (i.e. stabilizing the level of light in the neighbourhood of its threshold). At this point the attenuation steps were made smaller (attenuation by a factor of about o#8), and thus a better resolution of threshold could be obtained. The subjects were given a period of 5 min of dark adaptation within the test chamber. It generally took from 30 to 50 min of trials to reach the level at which the subject began to make errors, so that dark-adaptation was in fact much longer than the initial 5 min.
The calculation of thresholds was based on the assumption of the 50% point on the psychometric graph (i.e. that the limen lies midway between the level of an avoidance trial and the next escape level). A minimum of 20 such changes (avoidance to escape, or escape to avoidance) were used for each threshold determination. With one exception (one animal died after three tests), each animal was tested at least 10 times.
Initially, the bottom of the shuttle-box was painted a dull white, with a measured reflectance of about 2%. The rest of the test tank and the entire inside of the test chamber were painted a matt black, with a measured reflectance of about 0-2%. About hah0 the determinations were made with the bottom of the test tank painted
matt black along with everything else. The results "will be presented in these two categories.
All the timing, sequencing and data accumulation functions were combined in a single control center that was designed and constructed for this specific purpose. This instrument, dubbed the Video-Ichthyotron, was made to specifications by Woerner Enterprises, Ridgewood, New Jersey, and consisted almost entirely of integrated circuit 'chips' using T T L counters, gates, latches, etc. In addition to manual operation from front panel controls, the instrument timed the CS-US interval, the shock pulses, the intertrial interval, and separated the response latency data for avoidance and escape trials. In its automatic mode, the instrument controlled the light level in preset steps of i, 3 or 6 dB over a 40 dB range in accordance with the staircase method of threshold determination (later converted to log units).
Derived in concept from similar electronic devices used in the study of fish audition (the Audio-Ichthyotron: Tavolga, 1966), the Video-Ichthyotron also pro-vided a readout of data after each trial. The data consisted of the response latency (in tenths of a sec) and the setting of the automatic attenuator. These data were entered, by means of a set of solenoids over the keyboard, into a programmable electronic calculator (Wang 380) and typewriter. The data were printed out and accumulated for statistical analysis. During the onset of a trial, the operation of the system was entirely silent, so that no acoustic cues could have affected the behaviour of the subject. The only sounds loud enough to be detectable inside the test chamber were the data being printed on the typewriter, and this only occurred at the end of a trial. During automatic operation, the instrument had to be monitored and reset when it reached the end of its attenuation range. At this time, during an intertrial period, the attenuator was reset to zero and an appropriate neutral density filter was inserted.
RESULTS
After preliminary training of about 2 weeks, the animals were given several sessions on the automatic attenuator to determine the approximate threshold level. The preliminary training sessions consisted of 25 trials per day per fish. The first threshold approximations started with 50 trials per day per fish, and eventually reached up to 150 to 200 trials per day per fish. These threshold approximations spanned a period of 3 weeks, and at this point the number of subjects that were working reliably was reduced to seven, from the original 20 at the start of training. The approximate level of the threshold was now determined, and the attenuator was then switched to sequencing trials in the smallest steps to obtain more accurate threshold values.
Diffuse illumination in goldfish 95
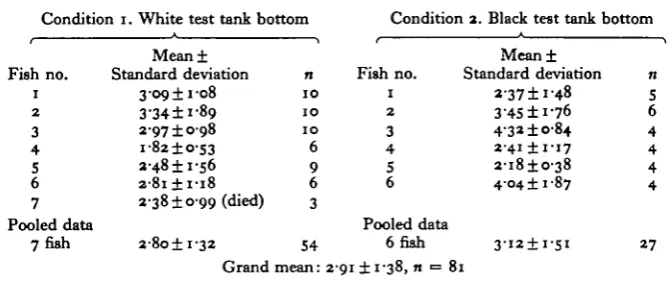
Table 1. Visual thresholds in goldfish in terms of irradiance
(all means are in pW cmr~2)
Condition i. White test tank bottom Condition a. Black test tank bottom
Fish no. 1 2 3 4 5 6 7 Pooled data 7fish Mean± Standard deviation
3-09 ± 1 -08 3-34 ±1-89 2-97 ± 0 9 8 i-82±o-53 3-48 ±1-56
a-8i±i-i8
2-38 ±0-99 (died) 2-8o±i-32 Grand n 1 0 1 0 1 0 6 9 6 3 54 mean: 21
Fish no. 1 2 3 4 5 6 Pooled data 6 fish
91 ±1-38, n •=
DISCUSSION Mean± Standard deviation *-37±i'48 3-45 ±1-76 4-3* ±0-84
2 4 1 ±1-17 2-i8±o-38 4 0 4 ± 1 87
3 ' i 2 ± i - 5 i 81 n 01 6 4 4 4 4 27
The threshold for diffuse illumination determined here for the goldfish is approxi-mately 3 pW cm"2, and the predominant errors probably tend to bias the results toward a value that is too low. Since the technique permitted occasional intertrial responses, there is a significant probability that some of the responses recorded as avoidances may well have been 'false alarms', in the context of signal detection theory. It is apparent, also, that the subjects were not using vision to swim across the barrier. Most likely touch and perhaps lateral line were the main modalities involved. The fact that there was no significant difference in performance between the two bottom-reflecting conditions supports this notion. Considering the low light levels of irradiance at threshold, a 2 % reflectance from the substrate was hardly perceptible. A further source of error probably results from the calibration process, in which the total effect of all the methods of attenuation is extrapolated rather than measured directly.
In studies on fish vision, there has been a lack of data on the physically definable, i.e. 'absolute', value for visual limits. Data are normally reported in terms of relative values, usually logarithmic units. For comparative purposes, and for behavioural and ecological utility, absolute measures are necessary (e.g. Blaxter, 19756). For example, Nikolsky (1963) cites some data on the sunfish (Lepomis), stating that (p. 47) it 'can perceive light at an intensity of io~10 of normal daylight'. This is equivalent to the light level 'in the Sargasso Sea at a depth of 430 m'. Two available figures for 'normal daylight' intensity are io6 lux (RCA Electro-Optics Handbook) and 1-2 x ioB lux (Sverdrup, Johnson & Fleming, 1942). These can be converted to 37000 and 44800/iW cm"2, giving a threshold value of 3-7 and 4-48 pW cm"8.
For abyssal oceanic fish, Clarke & Denton (1962) suggested threshold values of io"3 to io"4 pW cm"2. These values may seem very low, but could be close to the amount of light detectable at depths of a km, and threshold values, based on vertical migrations, have been reported by Blaxter (1975 a) in the order of 1 to o-i pW cm"2. Another figure that makes an interesting comparison is that of the visual threshold for the human eye. Although subject to much variability and controversy, the approximate human visual limit is usually taken as io"8 millilamberts (Bartley, 1951).
This is roughly convertible to about 3-4 pW cm~a in irradiance terms (Judd, 1951), and is remarkably close to the goldfish threshold reported here and to that of the sunfish cited by Nikolsky.
This study was supported by a grant (GB-6565) from the National Science Foundation. I am grateful to Mrs Brigitte Cappelli for her technical assistance and to Mr Andrew Woerner for his electronic ingenuity.
RBFERBNCES
BARTLBY, S. H. (1951). The psychophysiology of vision. In Handbook of Experimental Psychology (ed. S. S. Stevens), pp. 921-84. New York: Wiley.
BLAXTER, J. H. S. (1968). Visual thresholds and spectral sensitivity of herring larvae. J. exp. Biol. 48.
39-53-BLAXTER, J. H. S. (1969). Visual thresholds and spectral sensitivity of flatfish larvae. J. exp. Biol. 51,
231-30.
BLAXTER, J. H. S. (1973a). Do fish have an absolute sense of light intensity? In Vision in Fishes (ed. M. A. AH), pp. 719-29. New York: Plenum Press.
BLATTER, J. H. S. (19756). Fish vision and applied research. In Vision in Fishes (ed. M. A. Ali), PP- 757-73- New York: Plenum Press.
BRKDER, C. M., JR. & ROSEN, D. E. (1966). Modes of Reproduction in Fishes. New York: Natural History Press.
CLARKE, G. L. & DENTON, E. J. (1962). Light and animal life. In The Sea, vol. 1 (ed. M. N. Hill), pp. 456-68. New York: Wiley.
HESTER, F. J. (1968). Visual contrast thresholds of the goldfish (Carassius auratus). Vision Res. 8, I3I5-35.
JACOBS, D. W. & TAVOLOA, W. N. (1967). Acoustic intensity limens in the goldfish. Antm. Behav. 15,
3»4-35-JACOBS, D. W. & TAVOLCA, W. N. (1968). Acoustic frequency discrimination in the goldfish. Anim.
Behav. 16, 67-71.
JACOBSON, M. (1964). Spectral sensitivity of single units in the optic tectum of the goldfish. Q. Jl
exp. Physiol. 49, 384-93.
JUDD, D. B. (1951). Basic correlates of the visual stimulus. In Handbook of Experimental Psychology (ed. S. S. Stevens), pp. 811-67. New York: Wiley.
MUNTZ, W. R. A. & NORTHMORE, D. P. M. (1973). Scotopic spectral sensitivity in a teleost fish
(Scardimus erythrophthalmus) adapted to different daylengths. Vision Res. 13, 245-52.
NIKOLSKY, G. V. (1963). The Ecology of Fishes. New York: Academic Press.
NORTHMORE, D. P. M. & YAOER, D. (1975). Psychophysical methods for investigations of vision in fishes. In Vision in Fishes (ed. M. A. Ali), pp. 689-704. New York: Plenum Press.
RCA ELECTRO-OPTICS HANDBOOK (1968). RCA, Harrison, New York.
SVERDRUP, H. U., JOHNSON, M. W. & FLEMING, R. H. (194a). The Oceans. Englewood Cliffs, New
Jersey: Prentice-Hall.
TAVOLOA, W. N. (1966). The audio-ichthyotron — evolution of an instrument for testing auditory capacities in fishes. Trans. N.Y. Acad. Sci. a8, 706-12.
TAVOLOA, W. N. & JACOBS, D. W. (1971). Scotopic thresholds for monochromatic light in the cichlid fish, Tilapia heudclotii macrocephala. Vision Res. 11, 713-17.
TAVOLOA, W. N. & WODINBKY, J. (1963). Auditory capacities in fishes. Pure tone thresholds in nine species of marine teleosts. Bull. Amer. Mus. Nat. Hist. 136, 179-239.
TREVARTHEN, C. (1968). Vision in fish: the origins of the visual frame of action in vertebrates. In
The Central Nervous System and Fish Behavior (ed. D. Ingle), pp. 61-94. Chicago: University of
Chicago Press.
WITKOVSKY, P. (1965). The spectral sensitivity of retinal ganglion cells in the carp. Vision Res. 5, 603-14.
WITKOVSKY, P. (1968). The effect of chromatic adaptation on color sensitivity of the carp electro-retinogram. Vision Res. 8, 823-37.
YAGER, D. (1967). Behavioral measures and theoretical analysis of spectral sensitivity and spectral saturation in the goldfish, Carassius auratus. Vision Res. 7, 707-27.
YAGER, D. (1968 a). Behavioural measures of the spectral sensitivity of the dark-adapted goldfish
Nature, Land, aao, 1052-3.
YAOER, D. (19686). Behavioural analysis of color sensitivities in goldfish. In The Central Nervous